Renko Charts: Brick Size, Reversals and Real Limits
Blog/Renko Charts: Brick Size, Reversals and Real Limits
General
Renko Charts: Brick Size, Reversals and Real Limits
Renko charts explained for crypto traders: how bricks form, which box size to use, what Renko hides, and why you shouldn't backtest or fill orders on bricks.
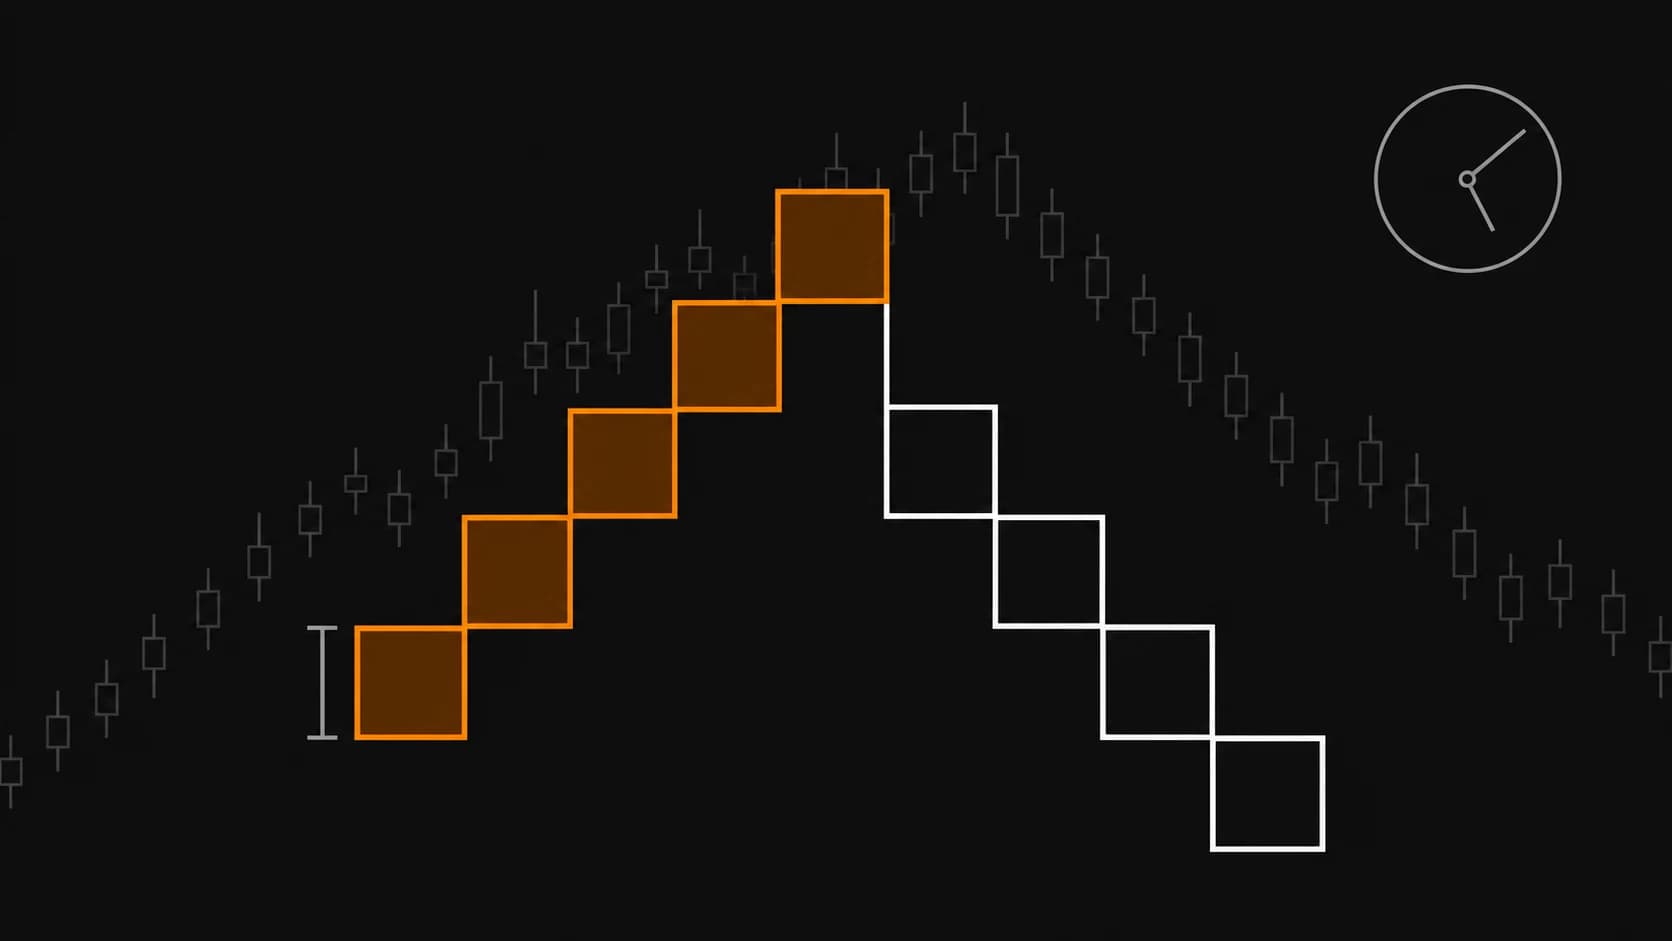
Renko charts plot price as equal-sized bricks and ignore time. A new brick prints only after price moves one full box size past the last brick, so a quiet market adds nothing to the chart and a trending market prints a steady staircase. Your box size decides almost everything Renko shows you. The other part to understand is what the bricks leave out.
This guide covers how bricks are built, how to choose a box size for crypto, how Renko compares with other alternative chart types, and the one mistake that wrecks Renko-based automation: backtesting and filling orders at brick prices.
How are Renko bricks built?
Renko bricks are built from price movement alone. Each brick has the same height (the box size), and a new brick forms only when price closes one box beyond the top or bottom of the last brick. A reversal brick needs two box sizes of movement, because it has to clear the full body of the previous brick first.
TradingView's Renko documentation gives a clean example. With a 2-point box and a last brick spanning 52 to 54, the next up brick needs a close at or above 56. A down brick needs a close at or below 50. A close at 57 still prints one brick at 56, because partial boxes don't count.
Three rules follow from that:
Bricks never share a column. One brick per x-axis step, always touching at the corners.
Continuation costs one box, reversal costs two. That asymmetry is where Renko's noise filtering comes from. It is also where its lag comes from.
The x-axis isn't time. Ten bricks might take ten minutes during a liquidation cascade or three days in a weekend chop.
Close vs. OHLC source
TradingView lets you build bricks from either the close or the full OHLC of the underlying interval. Close-based bricks are calmer and ignore wicks. OHLC-based bricks react to intrabar extremes, so they print more often and pick up more noise. On a perp that routinely wicks through levels to sweep stops, close-based bricks usually give the cleaner read.
The interval underneath still matters
Renko isn't truly timeless on most platforms. TradingView builds bricks from the chart interval's data. A 15-minute Renko chart uses 15-minute closes, and a brick only locks in once that interval finishes. Real-time "projection" bricks can appear on intraday intervals before then, but they disappear on reload. Treat them as provisional, the same way you'd treat an unclosed candle.
Box size: the setting that decides what you see
Box size is the only parameter that matters much on a Renko chart. Too small, and you get a candlestick chart with extra steps. Too large, and a full swing can play out between two bricks without you seeing it. TradingView offers three sizing methods, and they behave very differently on crypto.
ATR. The box size comes from Average True Range, with a default length of 14. The box adapts to volatility, which suits crypto, where a fixed dollar amount means different things at different price levels. TradingView sets this as the default for a reason.
Traditional (fixed). You type in a fixed box size. TradingView suggests starting around 1/20th of the current price. On BTC at 100,000 that's a 5,000-point brick, which is a swing-trader's view and far too coarse for intraday perps. Fixed boxes also go stale as price trends, because the box shrinks relative to price on the way up.
Percentage (LTP). The box is a percentage of the last close (default 1%), rounded to tick size. Percentage sizing scales cleanly across BTC, ETH and small caps. TradingView notes it is subject to repainting, though, so don't trust its history for signal work.
A practical way to calibrate: start with ATR on the timeframe you normally trade. Then compare brick reversals against the swing highs and lows you'd mark by hand on candles. If Renko flags reversals that you'd call noise, increase the box. If it misses swings you'd trade, reduce it.
Renko vs. candles, Heikin Ashi, Line Break, Kagi and Point & Figure
Renko belongs to a family of alternative chart types that transform raw price to make trends easier to read. Some keep the time axis and some drop it. That one difference decides whether a chart type can be traded against real prices or only read.
Chart type
Time axis
What triggers a new bar
Prices are real?
Best use
Candlesticks
Yes
Each interval closes
Yes
Execution, entries, stops, everything
Heikin Ashi
Yes
Each interval closes (smoothed OHLC)
No, averaged
Trend reading; can pair with standard-OHLC fills
Renko
No
Price moves one box (two to reverse)
No, brick levels
Trend clarity, clean S/R, regime context
Line Break
No
Close beats the high/low of the last N lines
Closes only
Spotting trend reversals
Kagi
No
Reversal amount exceeded; line thickens on breaks
Partly
Supply/demand shifts
Point & Figure
No
Box size plus reversal count (often 3)
No, box levels
Long-horizon targets and breakouts
Heikin Ashi is the odd one out. Its OHLC values are synthetic, but each HA bar maps to exactly one real bar. A strategy can therefore compute signals from HA data and still fill orders at real prices. Renko, Line Break, Kagi and Point & Figure lose that one-to-one mapping. Once that's gone, the chart's prices can't be used for fills.
What Renko charts hide from you
Renko removes noise by throwing information away. Those discarded details include several things a derivatives trader needs: wicks, time, volume context, and the true price at any moment. Knowing what's missing is the difference between using Renko as a lens and getting surprised by it.
Wicks and sweeps. A close-based brick chart won't show the long wick that ran your stop. That is a problem if you trade liquidity sweeps or place stops near obvious highs and lows.
Time and funding. A position held across 12 flat bricks might have sat through several funding intervals. Renko makes a slow grind and a fast impulse look identical, and those two moves carry very different risk.
Volume and time-based indicators. RSI, MACD or a moving average applied to a Renko chart calculate on bricks, not hours. A 20-period EMA on bricks is a different indicator from a 20-period EMA on 1H candles. Volume tools that assume regular intervals lose most of their meaning.
Reversal lag. Because a reversal needs two boxes, your first signal of a turn arrives at least two box sizes after the extreme. Size the box to the move you're willing to give back.
Gaps and illiquid wicks. Fast moves can print several bricks from one interval. The prices between those bricks never filled for anyone in the order you'd see on the chart.
None of this makes Renko useless. Renko is a trend lens, not an execution chart, and it works when you treat it that way.
Why you shouldn't backtest a strategy on Renko bars
Backtesting directly on Renko bars produces fills at brick prices that never existed when the trade would have happened. The equity curve this creates usually looks far better than anything you could trade live. TradingView flags the problem itself and advises against backtesting strategies on Renko charts.
According to TradingView's support note on non-standard chart types, a strategy on a Renko chart fills orders at brick levels "disconnected from actual market prices at any given moment." The "Using standard OHLC" property fixes this for Heikin Ashi only, because HA bars stay tied to the time scale. For Renko there is no equivalent switch.
The mechanics are simple. A brick closes at a round box level. On the real chart, price had already moved past that level by the time the interval confirmed the brick. Every entry in the backtest gets a slightly better price than you'd get live. Stack that across hundreds of trades with leverage, and a losing system can look profitable.
If you want a Renko-driven system, use the approach in the next section. Then backtest it on standard candles, with realistic fees and slippage, before any money goes near it.
Using Renko as a filter on a standard chart
The safe way to use Renko in a system is to read brick direction in the background while your strategy runs and fills on normal candles. Pine Script supports this through ticker.renko() with request.security(). Signals come from Renko, while alerts, stops and backtest fills stay on real prices.
The Pine Script docs on non-standard chart data confirm two things. You can request Renko values on any chart type, but Pine can't draw Renko bricks. The docs also note that these values are built from lower-timeframe data, so they approximate tick-based bricks rather than reproduce them exactly.
Here's a minimal Pine Script v6 indicator that turns Renko direction into a regime filter and fires flip alerts:
//@version=6
indicator("Renko Regime Filter", overlay = true)

atrLen = input.int(14, "Renko ATR length", minval = 1)

// Request ATR-sized Renko bricks for the current symbol and timeframe
renkoId = ticker.renko(syminfo.tickerid, "ATR", atrLen)
[rOpen, rClose] = request.security(renkoId, timeframe.period, [open, close])

brickUp  = rClose > rOpen
flipUp   = brickUp and not brickUp[1]
flipDown = not brickUp and brickUp[1]

// Colour the standard candles by Renko regime
barcolor(brickUp ? color.teal : color.maroon)

plotshape(flipUp,   "Renko flip up",   shape.triangleup,   location.belowbar, color.teal)
plotshape(flipDown, "Renko flip down", shape.triangledown, location.abovebar, color.maroon)

alertcondition(flipUp,   "Renko flip up",   "Renko regime flipped long on {{ticker}}")
alertcondition(flipDown, "Renko flip down", "Renko regime flipped short on {{ticker}}")
Because the candles stay real, any stop or target you set references prices that actually traded. You can use brickUp purely as a filter: only take your existing long trigger when the Renko regime is up. That's often a better use of Renko than treating flips as entries.
Wiring the alert to an exchange
To turn the flip into an order, set up a normal TradingView webhook alert:
Add the indicator to a standard candlestick chart of the perp you trade, on your working timeframe.
Create an alert, choose "Renko Regime Filter" as the condition, and pick "Renko flip up" (or down).
Set the trigger to Once Per Bar Close so provisional bricks can't fire the alert.
Enable the webhook URL and paste the JSON payload from your execution platform into the message box.
Fire one test alert with minimum size and check the fill price against the candle, not the brick.
If you run execution through Crodl, the payload comes from a Trading Trigger. That's also where symbol mapping, sizing rules and TP/SL live, so the Pine side only has to say "flip happened." The free Pine Library has alert templates you can adapt if you'd rather not write the alert plumbing yourself.
Who Renko charts suit, and who should skip them
Renko charts suit traders who struggle to hold trends through noise and want a cleaner picture of regime. They're a poor fit for scalpers, liquidity-sweep traders, and anyone whose edge depends on exact wicks, timing or volume. The chart type amplifies some styles and quietly breaks others.
Good fit:
Swing and position traders on BTC and ETH perps who exit too early on red candles.
Systematic traders who want a regime filter that ignores time-of-day chop.
Anyone marking support and resistance. Renko tops and bottoms often line up as clean horizontal shelves.
Poor fit:
Scalpers working 1-minute structure, where the two-box reversal lag eats the whole move.
Smart-money traders reading FVGs, order blocks and sweeps, all of which depend on real wicks and real bar timing.
Traders who rely on session timing, killzones or funding windows. Renko erases the clock.
One useful habit: keep a Renko pane beside your execution chart rather than replacing it. Renko handles direction, and the candles handle entry, stop and size. If you're comparing behaviour across venues, the live markets page helps you spot which symbols are trending cleanly before you choose a box size.
Frequently asked questions
Are Renko charts good for crypto trading?
Renko charts work well on crypto for reading trend direction and support and resistance, especially with ATR-based bricks that adapt to volatility. They're weaker for precise entries, because they hide wicks and time. Most traders get the best results using Renko as a regime filter beside a candlestick chart and executing at real prices.
What is the best Renko box size?
No single box size is best. ATR with a length of 14 is a sensible default, because it scales with volatility. From there, adjust until brick reversals match the swings you'd actually trade. Bigger boxes mean fewer signals and more lag. Smaller boxes mean more signals and more noise. Validate any choice with a backtest on standard candles.
Do Renko charts repaint?
Renko bricks can change before they're confirmed. On TradingView, real-time projection bricks appear on intraday intervals and are lost on reload, and percentage-based box sizing is documented as subject to repainting. ATR bricks can also shift as ATR updates. Use bar-close alerts and treat unconfirmed bricks like unclosed candles.
Can I backtest a strategy on a Renko chart?
You can run a backtest on a Renko chart, but the results won't be reliable. Orders fill at brick prices that don't match real market prices, so performance is typically overstated. Instead, request Renko data with ticker.renko() inside a strategy running on standard candles. Signals then come from bricks while fills use real prices.
What's the difference between Renko and Heikin Ashi?
Heikin Ashi smooths each time-based candle by averaging OHLC values, so it keeps the time axis and one bar per interval. Renko drops time entirely and prints bricks only on fixed price moves. That's why TradingView lets Heikin Ashi strategies fill on standard OHLC, while Renko has no equivalent setting.
The bottom line on Renko
Renko charts give you one thing very well: a clear view of trend direction with intraday noise removed. In exchange you lose time, wicks and real prices. Read regime from the bricks, and keep execution, stops and backtests on real candles.
If you want to run a Renko regime filter as a live webhook system, test it on standard candles first. Then create a free Crodl account and route the flip alerts to your exchange at small size before scaling up.
Information disclaimer: This article draws on official documentation and other sources available at the time of writing. We aim to keep it accurate, but information may be incomplete or become outdated. Chart construction, platform features, alert behaviour, fees and terms can change and may vary by provider.
Always check the latest provider documentation before relying on a chart, script or automated workflow. The code and settings shown are educational examples, not a recommended trading strategy. Renko uses synthetic brick levels, and backtests may differ materially from live execution.
This content is for general information only and is not financial or investment advice. Trading involves risk, including loss of capital. Historical results and automation do not guarantee profits or prevent losses.
Share this article
Ready to automate your trading?
Connect your exchange, set up automations, and start trading smarter — all from one platform.