Crodl Blog
News, guides, and insights on crypto trading and automation.
Trading
What Professional Traders Actually Use
Most professional traders do not build their edge from random indicator mashups. Here is the actual stack many serious traders use for regime filtering, volume confirmation, position sizing, and risk control.
Read article
Trading
Pine Script Indicator Alert Template for TradingView Webhooks
Copy this Pine Script v6 alertcondition template for stop-loss and four take-profit events, or give the included prompt to your AI coding assistant.
Trading
Pine Script Strategy Alert Template for TradingView Webhooks
Copy this Pine Script v6 strategy alert template, or give the included prompt to your AI, to add separate long, short, and exit webhook messages.
Indicators
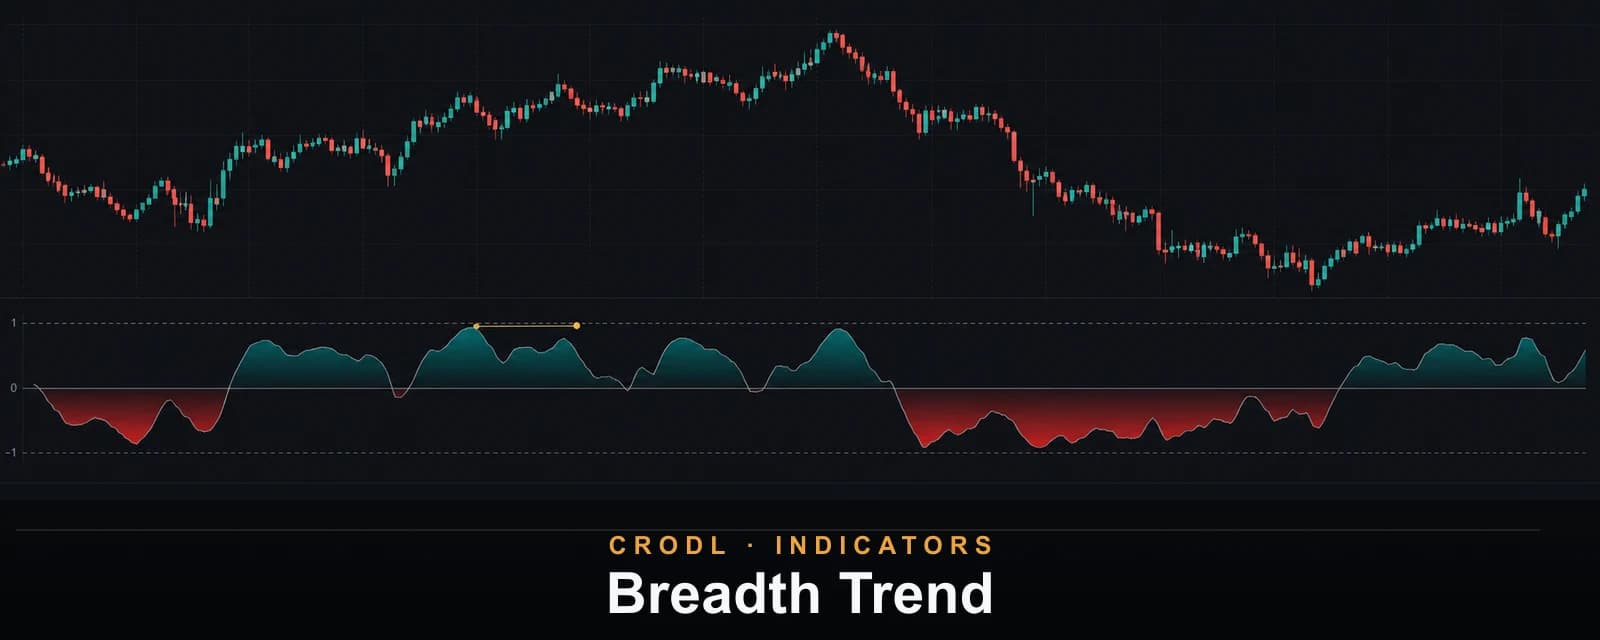
Breadth Trend
Score upward versus downward range expansion on a normalized −1 to +1 scale, confirm regime changes, and mark liquidity sweeps with weaker breadth.
Indicators
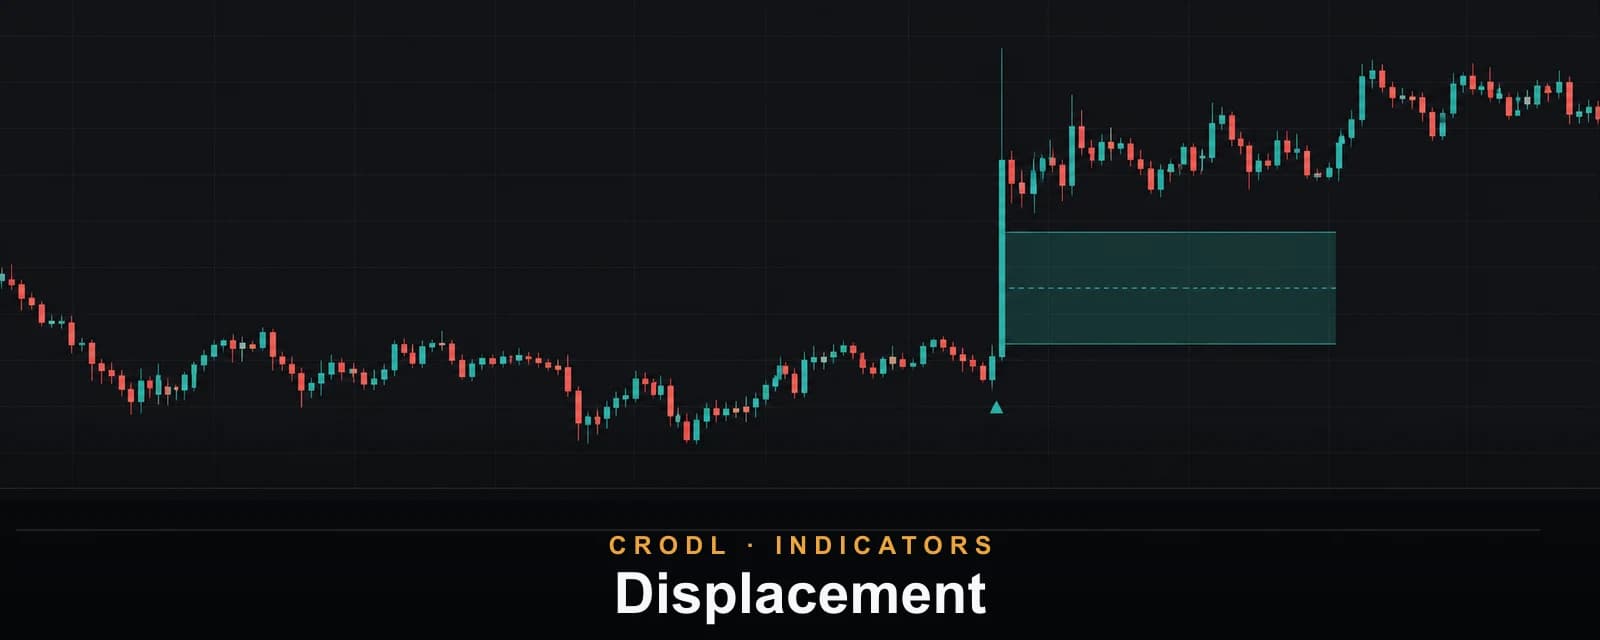
Displacement
Find ATR-sized impulse candles, require directional body dominance or an FVG, and carry the latest bullish and bearish imbalance zones forward.
Indicators
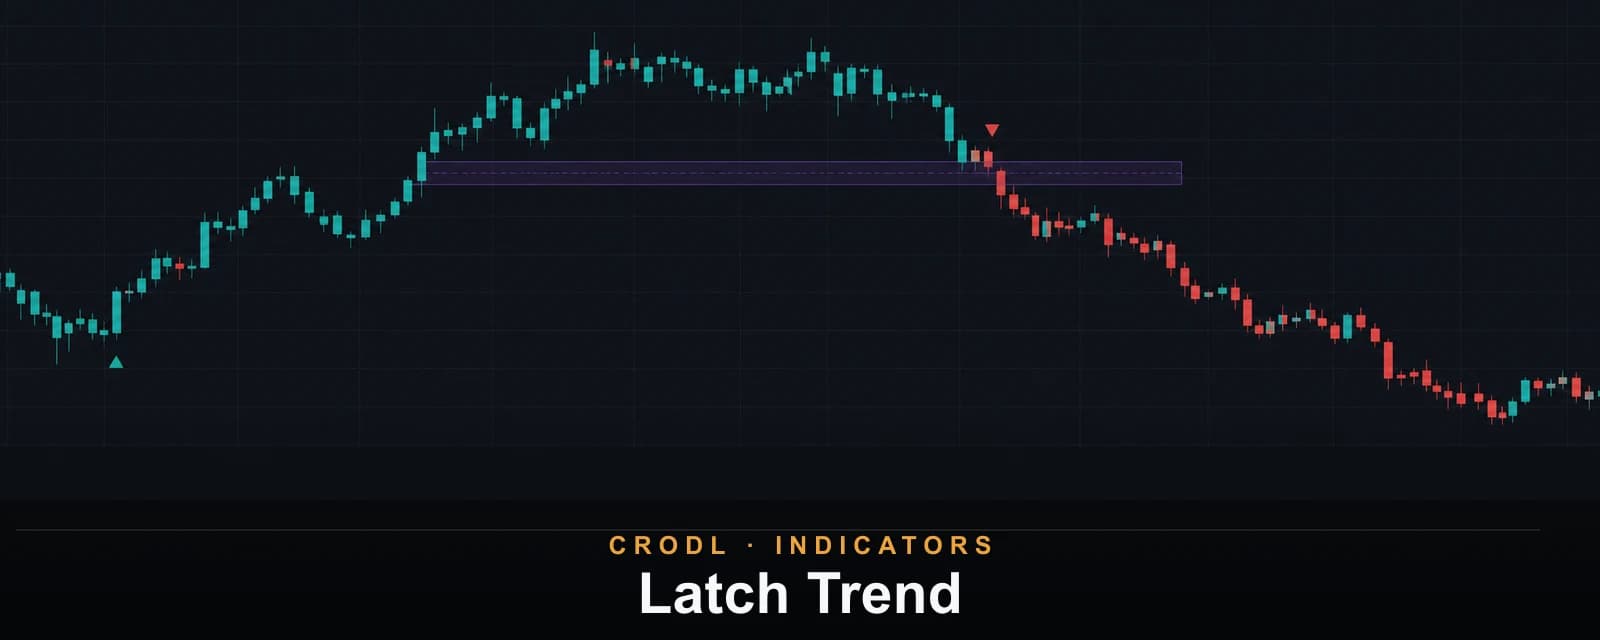
Latch Trend
A close-confirmed trend regime that stays latched until price breaks the active anchor candle, with MTF calculation and calendar resets.
Indicators
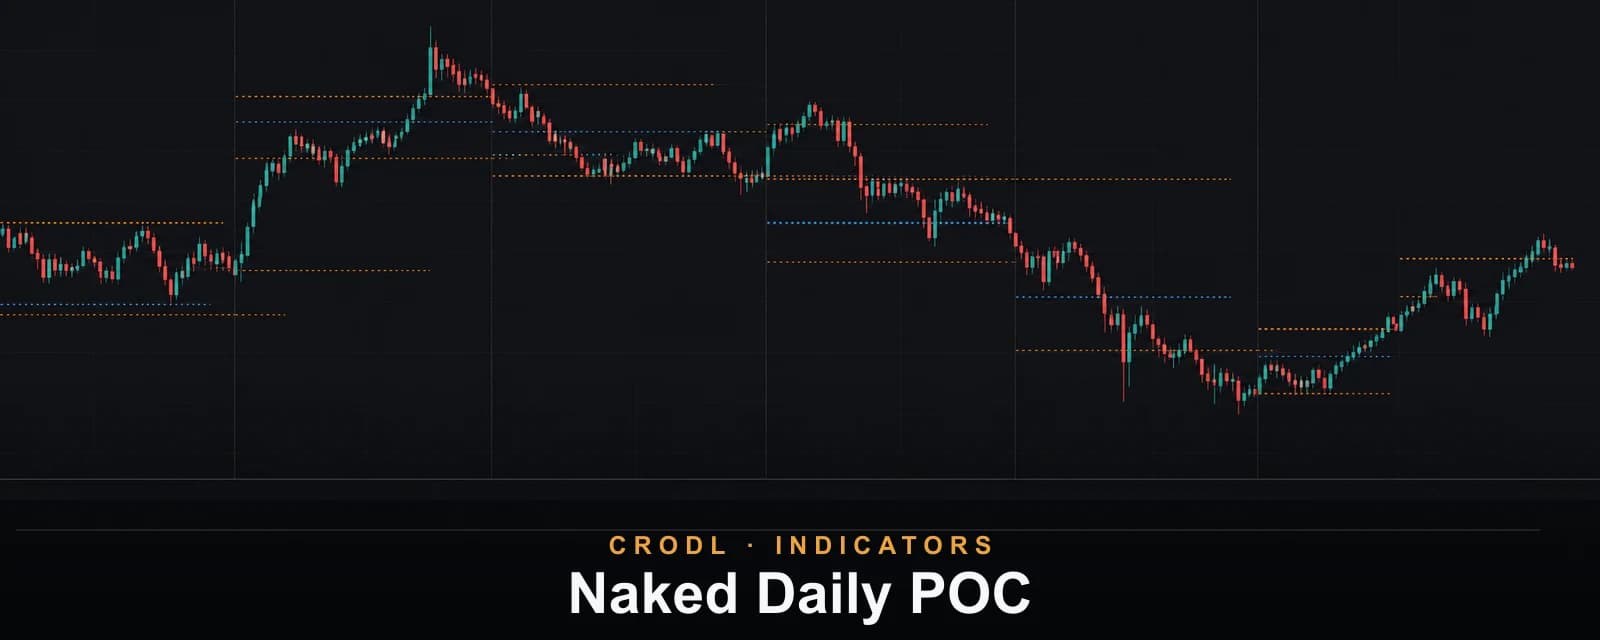
Naked Daily POC
Project completed UTC daily POC, VAH, and VAL levels forward until price revisits them, using the terminal's body-weighted volume-profile model.
Indicators
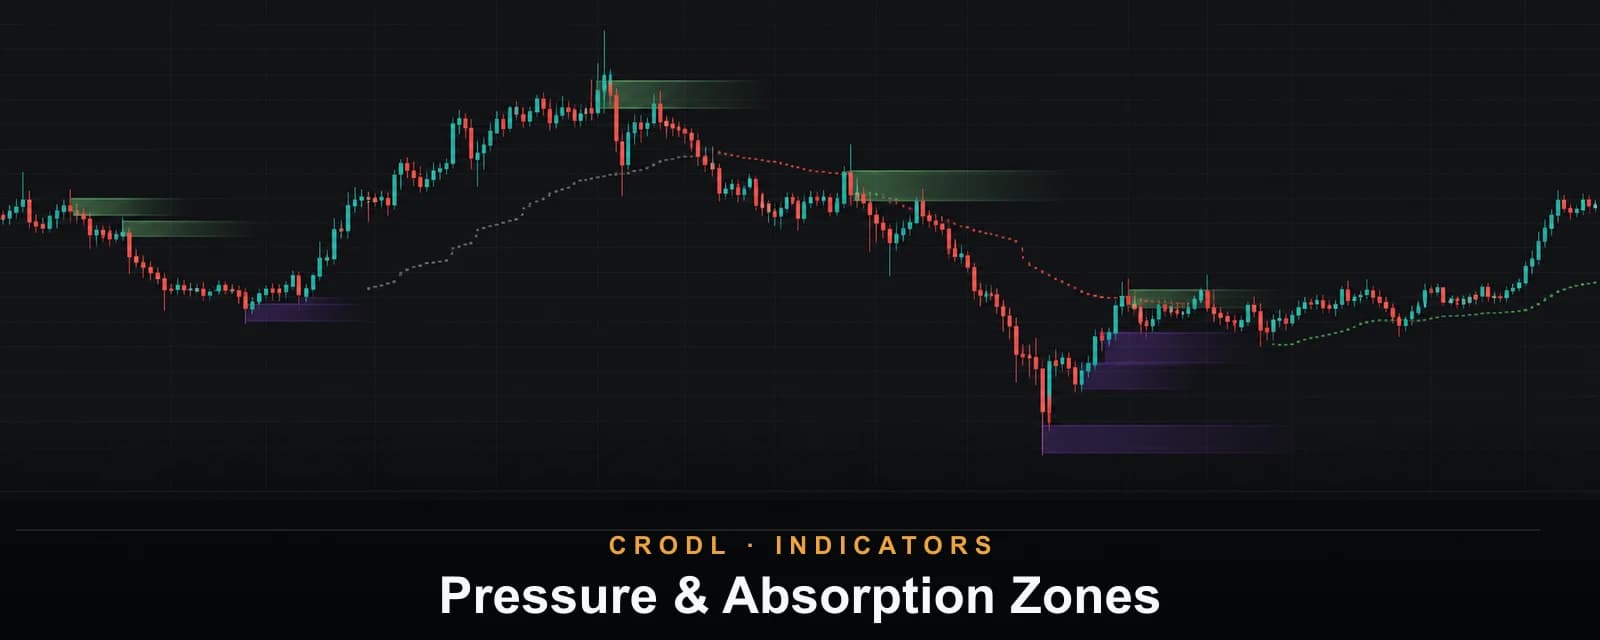
Pressure & Absorption Zones
Map estimated aggression, high-effort rejection, and the path of least resistance from closed OHLCV candles—without pretending candle data is an order book.
Indicators
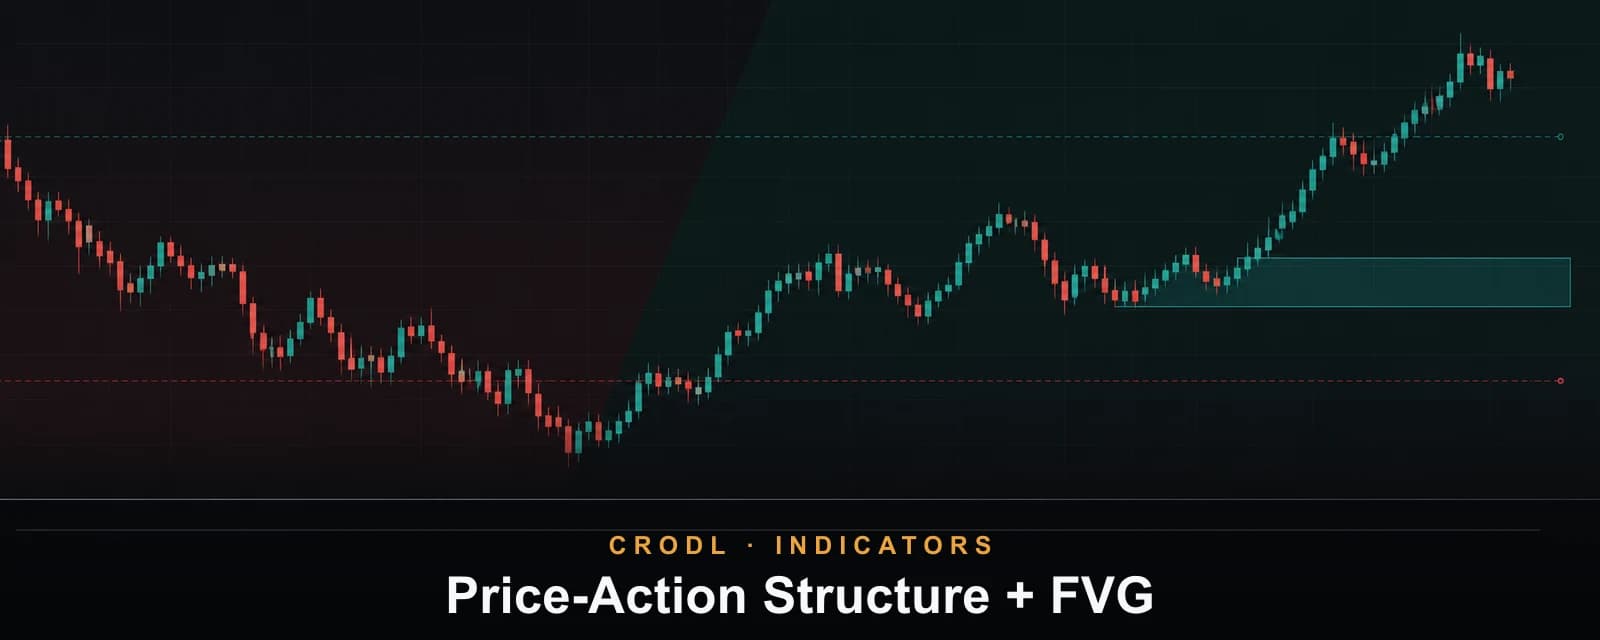
Price-Action Structure + FVG
A clean price-action map combining break-of-structure trend, the latest swing levels, and one trend-aligned fair value gap at a time.
Indicators
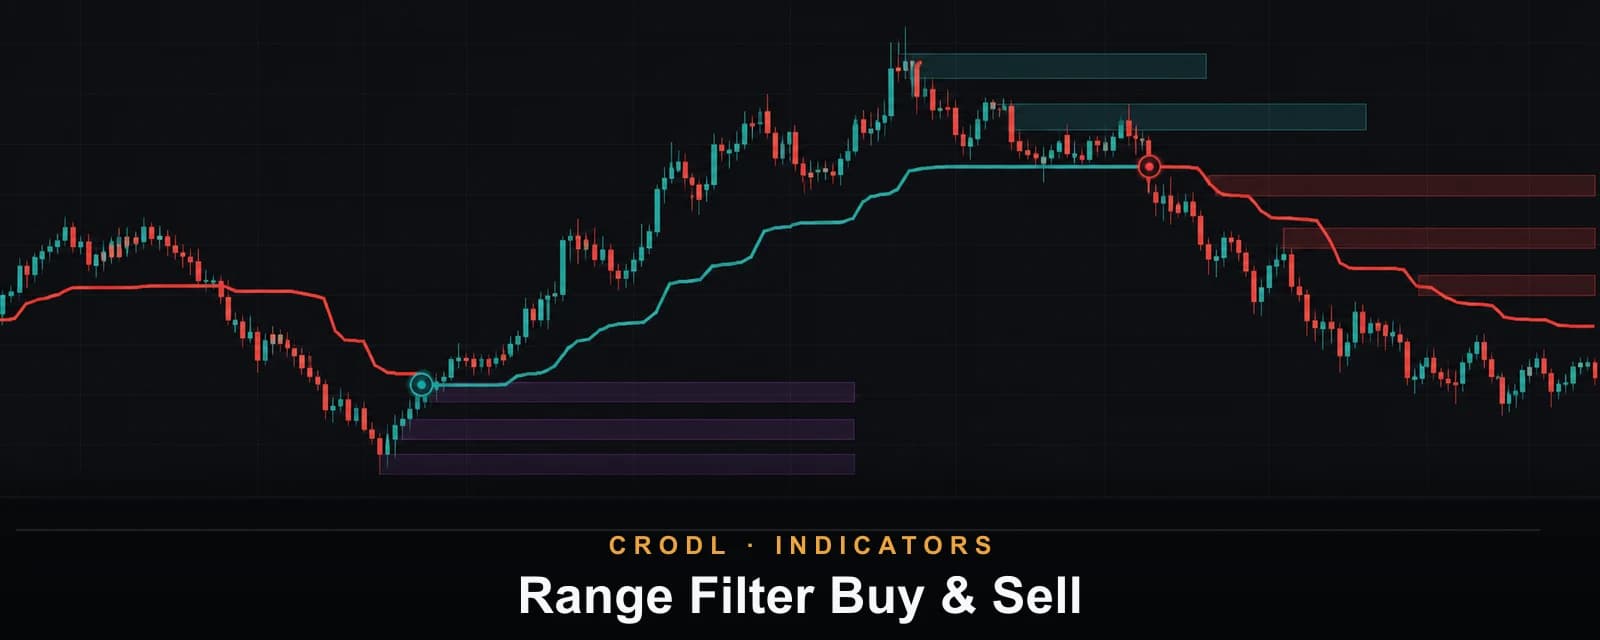
Range Filter Buy & Sell
Filter price through a double-smoothed range, shade target bands, and mark strictly alternating breakouts on the chart or a higher timeframe.
Indicators
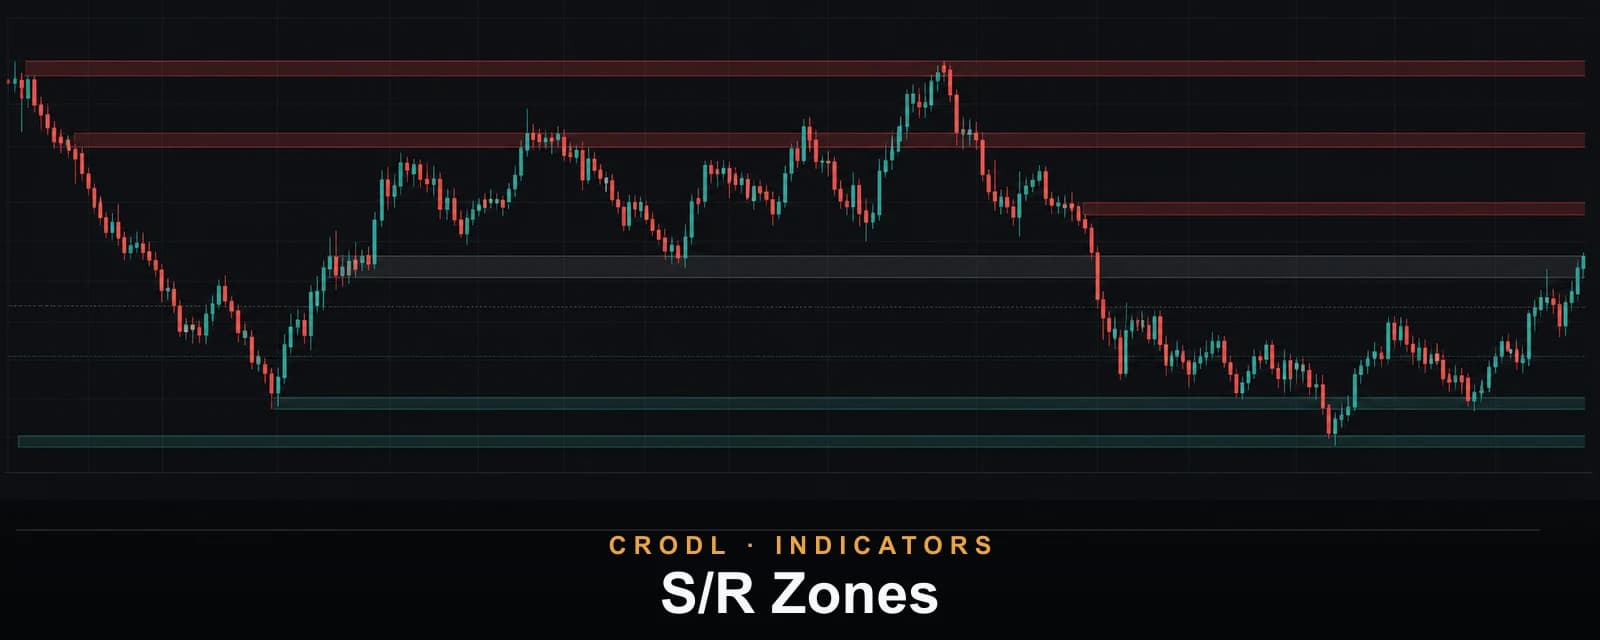
S/R Zones
Persistent support and resistance bands from confirmed pivots, with MTF calculation, volatility-aware merging, and explicit close-break behavior.
Indicators
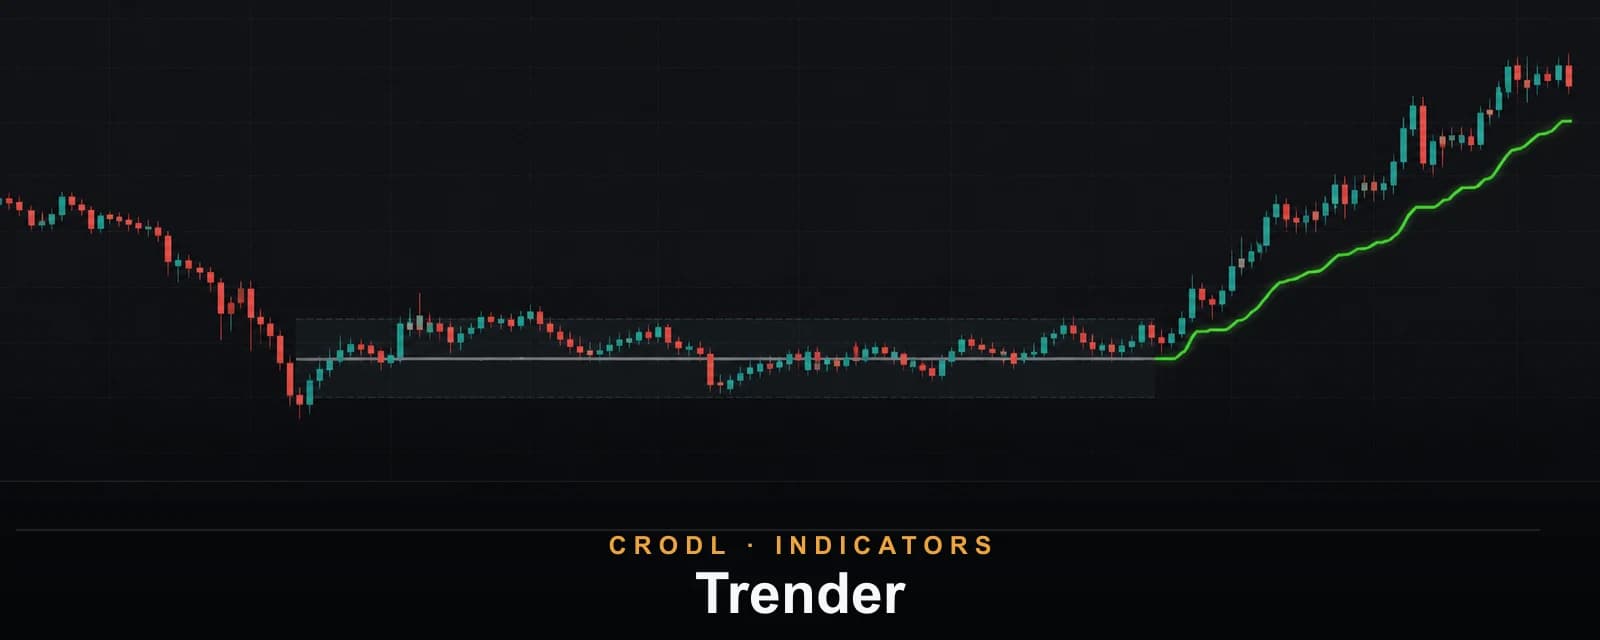
Trender
A Kalman-filtered trend rail that holds flat inside noise, then commits to a controlled rising or falling leg when the market actually changes state.
Indicators
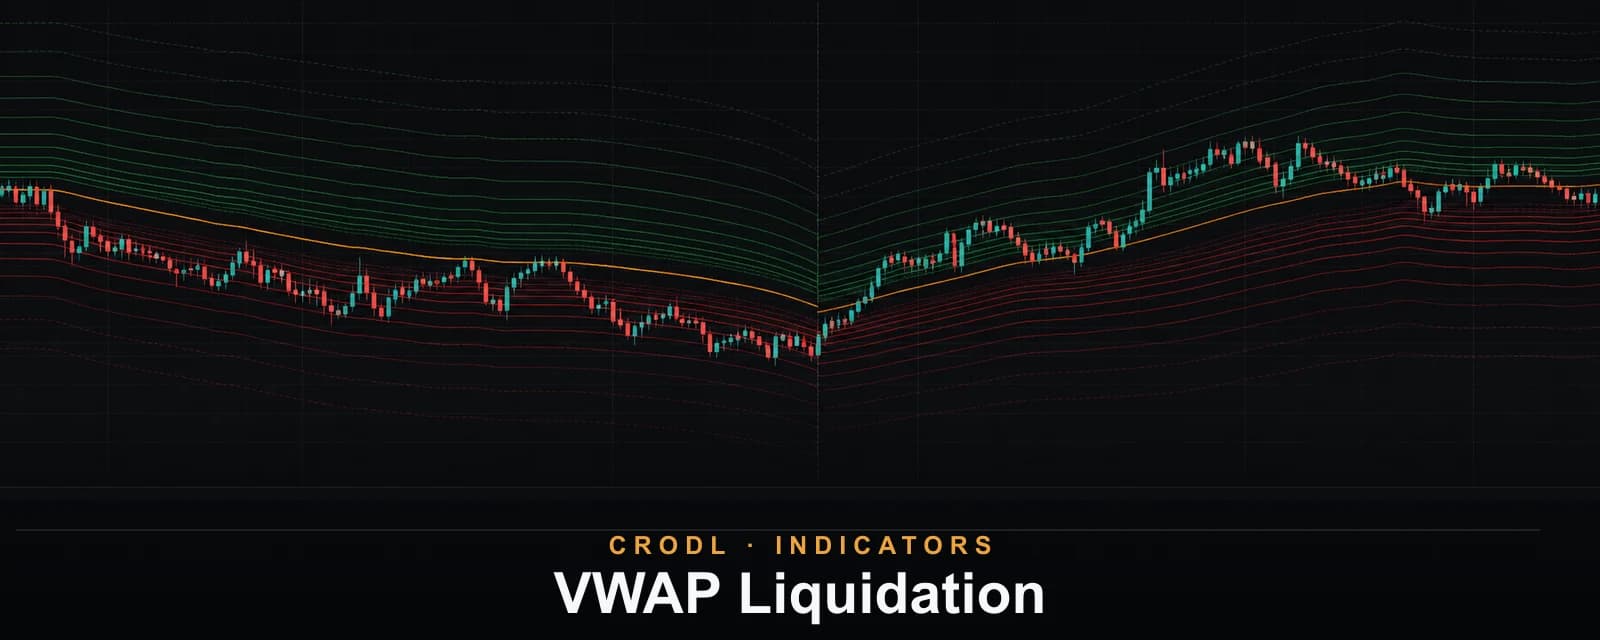
VWAP Liquidation
Plot estimated 5x–100x liquidation ladders around daily VWAP, either tracking fair value or freezing as static rails from the day-open VWAP.
Drawing Tools
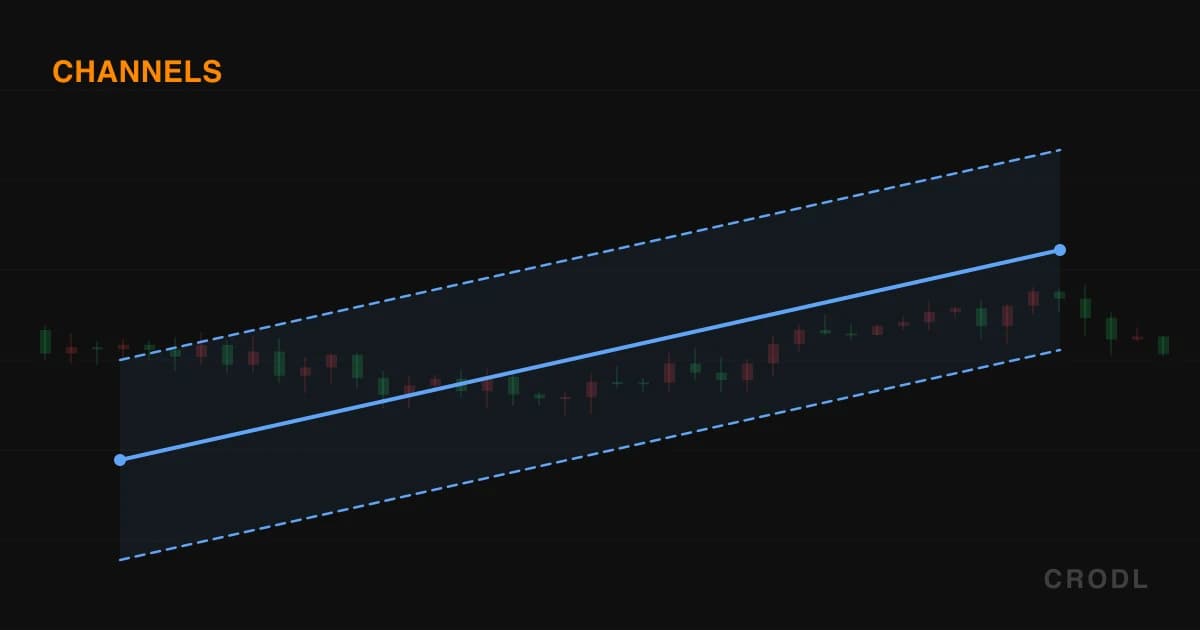
Channel Drawing Tools: Five Ways to Frame a Trend
The five channel tools on the Crodl chart — parallel, ATR, regression, flat top/bottom and disjoint — what each one measures, and when to reach for which.
Drawing Tools
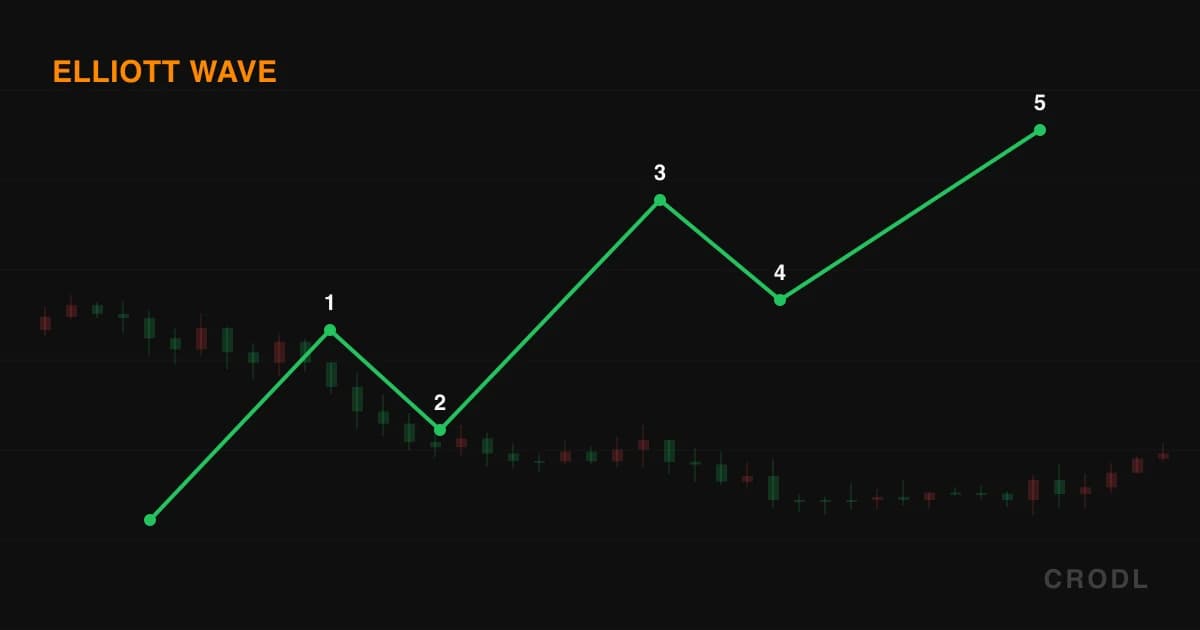
Elliott Wave Drawing Tools: Five Label Sets for the Count You Actually See
Crodl's five Elliott Wave drawing tools — impulse, ABC correction, ABCDE triangle and the WXY / WXYXZ combos — label the wave count you place, click by click.
Drawing Tools
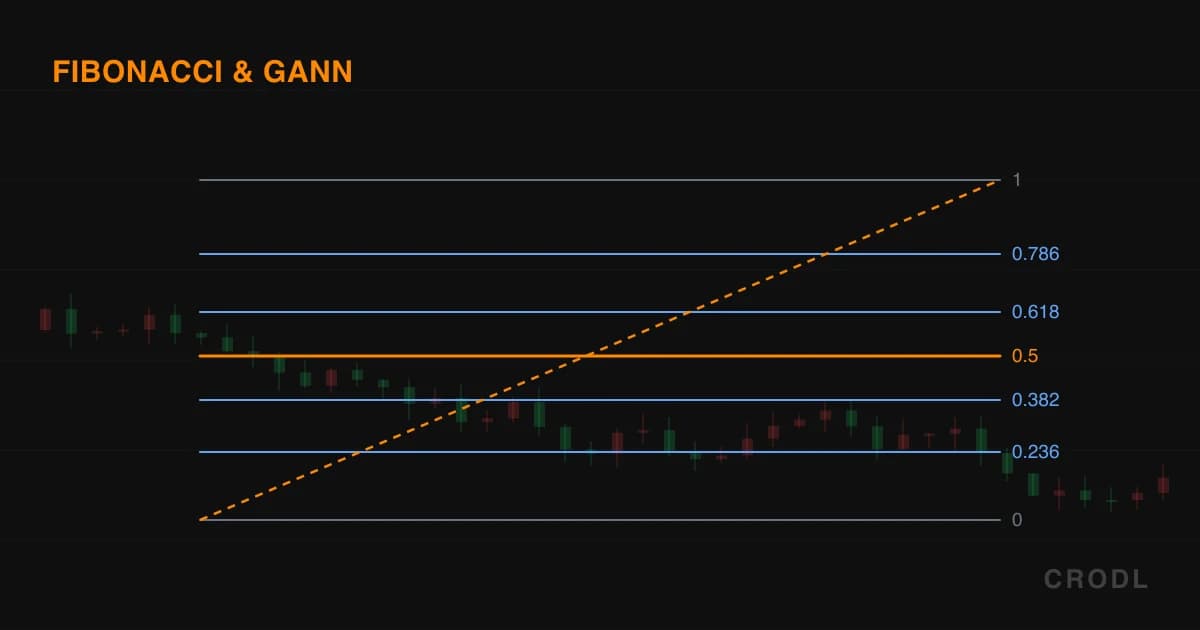
Fibonacci & Gann Drawing Tools on the Crodl Chart
Crodl's eight Fibonacci and Gann drawing tools — retracement, extension, channel, fan, circles, time zones, Gann fan and box — and their exact level sets.
Drawing Tools
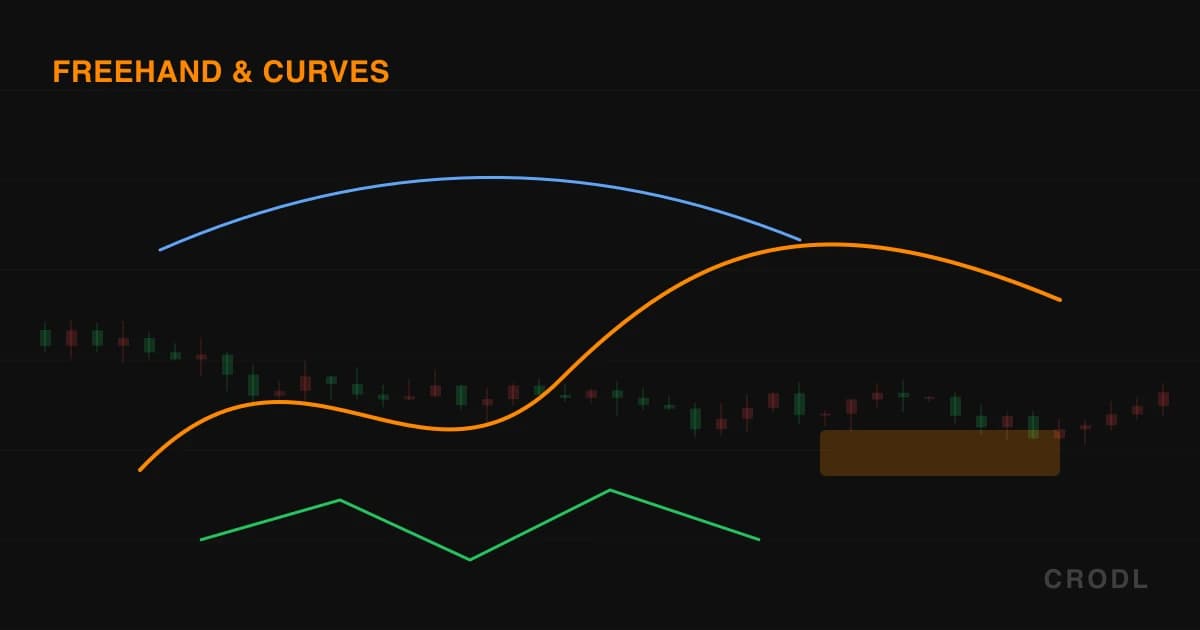
Freehand & Curves: Drawing What a Straight Line Cannot
Brush, Highlighter, Path, Polyline, Arc, Curve and Double Curve on the Crodl chart — how each stroke is captured, what the control points really do, and where every default lands.
Drawing Tools
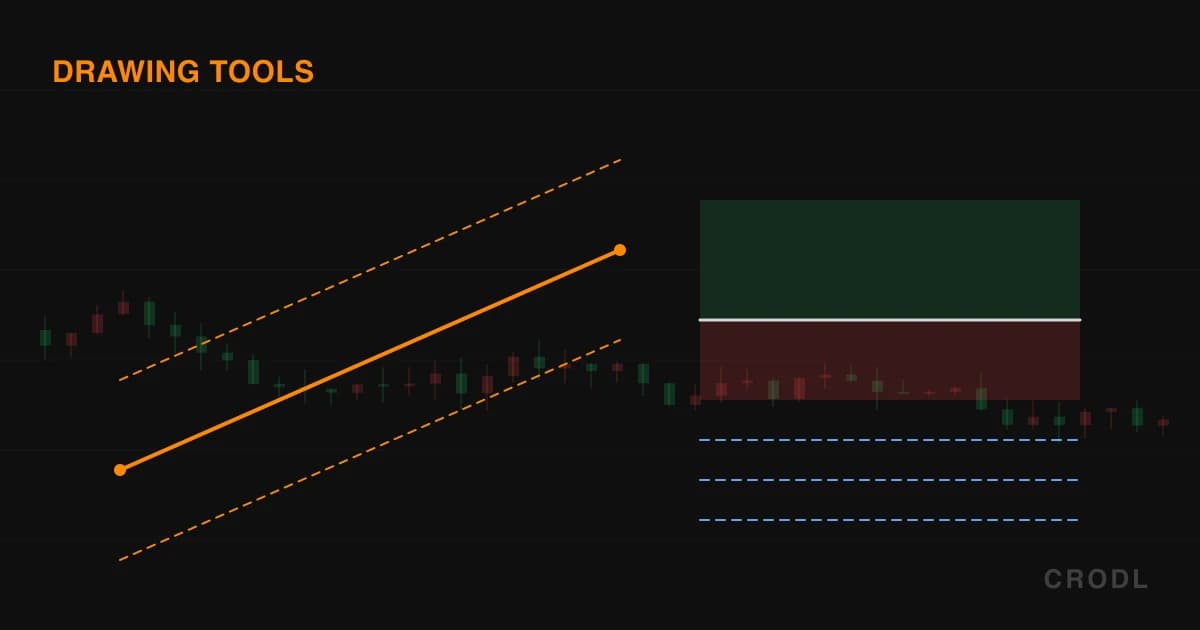
Every Drawing Tool on the Crodl Chart: The Complete Guide
A map of all 51 drawing tools on the Crodl chart — lines, channels, Fibonacci, pitchforks, patterns, positions, measurement and annotation — and when to reach for each.
Drawing Tools
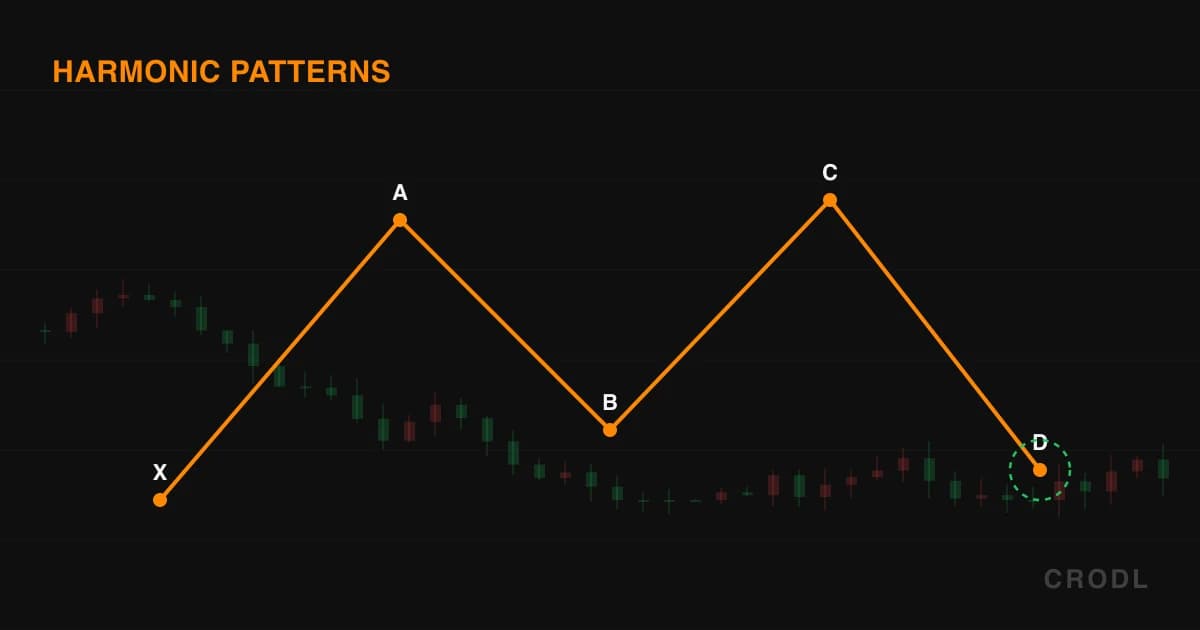
Harmonic Pattern Tools: Drawing XABCD, ABCD and Three Drives
Draw harmonic structures by hand on the Crodl chart: five-click XABCD, four-click ABCD with a live CD:AB ratio readout, and the seven-click Three Drives.
Drawing Tools
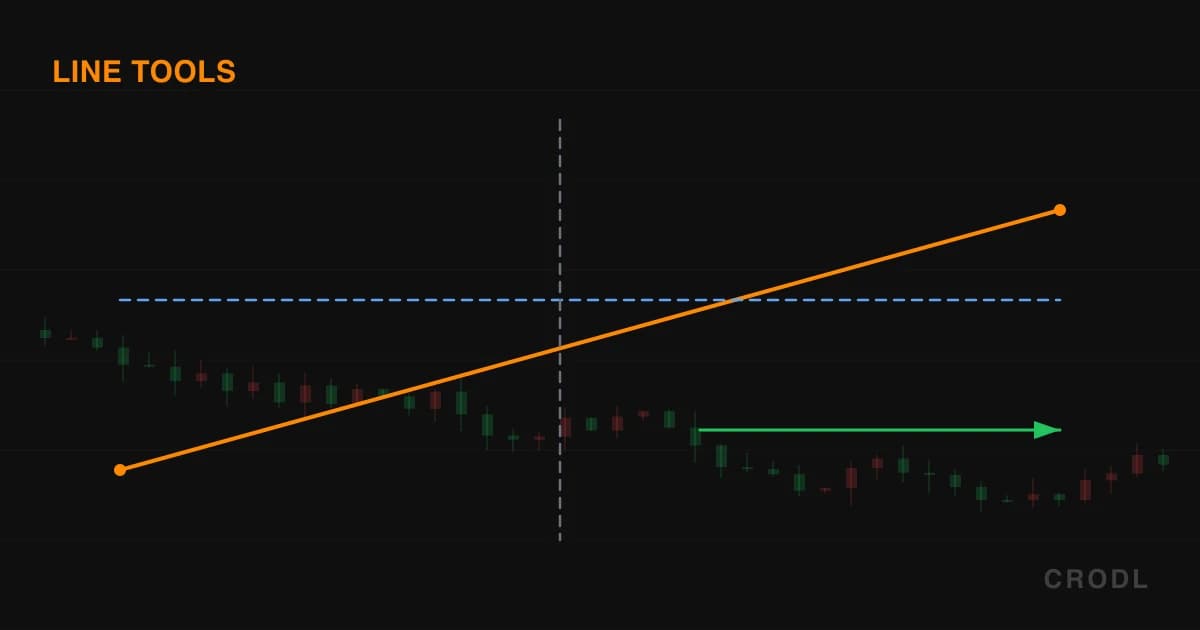
Trend Lines, Rays and Guides: Every Line Tool on the Crodl Chart
A guide to the ten tools in the Crodl chart's Lines flyout: trend lines, rays, arrows, horizontal and vertical guides, and two that measure as you draw.
Drawing Tools
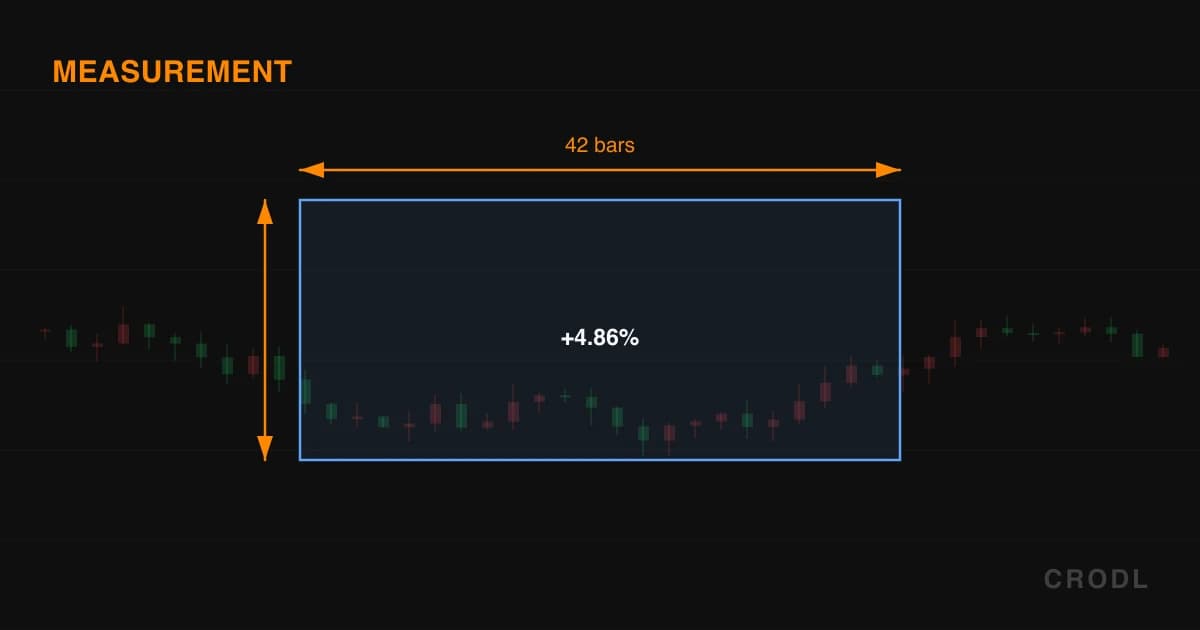
Measurement Tools: Price Range, Date Range and Premium/Discount
The four Measure tools on the Crodl chart: price range with delta and percent, date range in bars and elapsed time, both at once, and premium/discount zones.
Drawing Tools
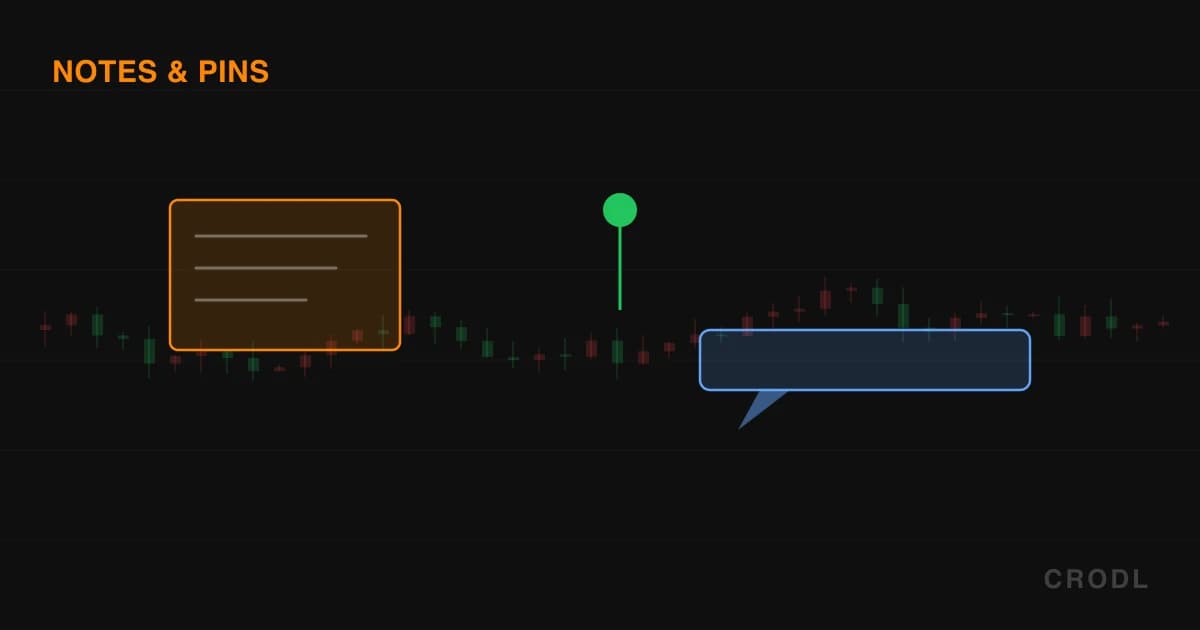
Notes, Pins & Position Forecast: The Chart as a Place You Leave Messages
Note, Price Note, Pin and Comment anchor typed text to a candle. Circle and Rotated Rectangle mark what a box cannot. Position Forecast projects a move with a confidence cone.
Drawing Tools
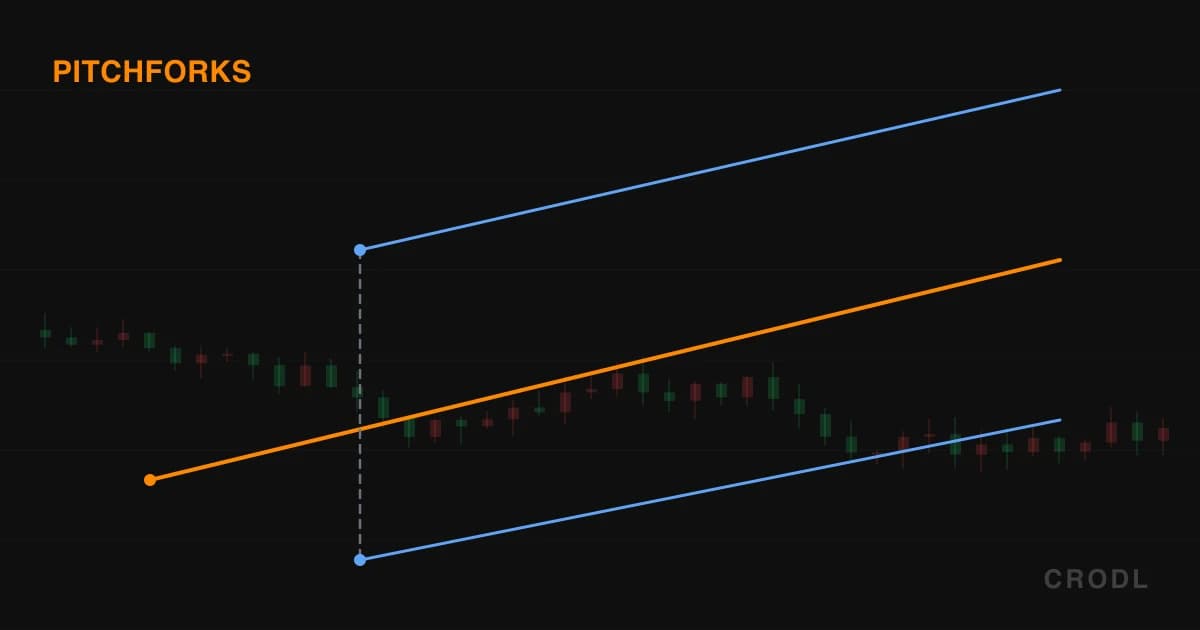
Pitchforks on Crodl: Andrews', Schiff and Modified Schiff
Three-click pitchfork tools on the Crodl chart: how the median line and tines are built, exactly how each variant shifts the origin, and when to use Schiff.
Drawing Tools
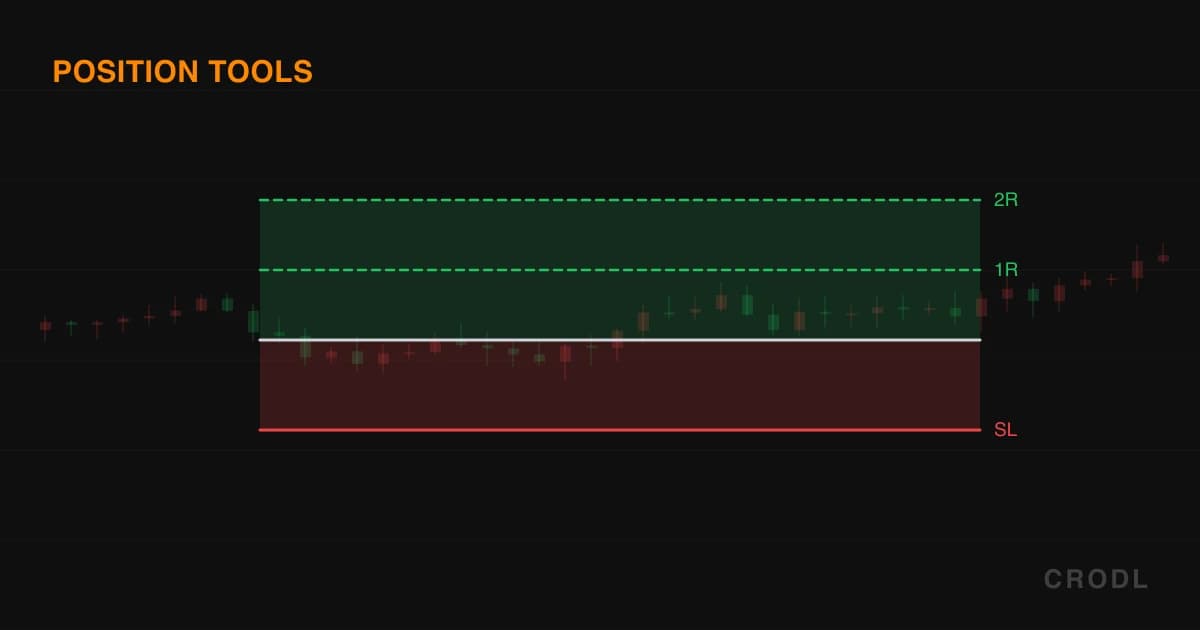
Position Tools: Draw the Trade Before You Take It
Crodl's chart has four position tools: classic long/short with a live risk/reward card, plus ATR variants that price the stop and target ladder in volatility.
Drawing Tools
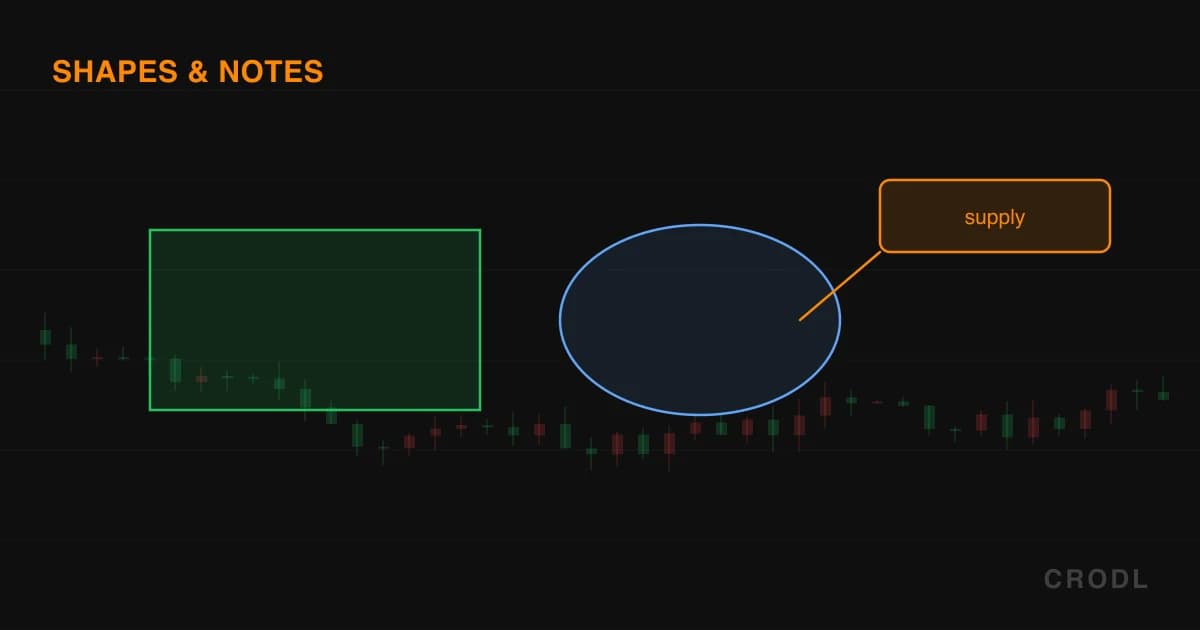
Shapes & Annotations: Turning Your Chart Into a Research Journal
Rectangles, ellipses and triangles mark the zones you will trade against later. Text, callouts, price labels and arrow marks leave notes for your future self.
Drawing Tools
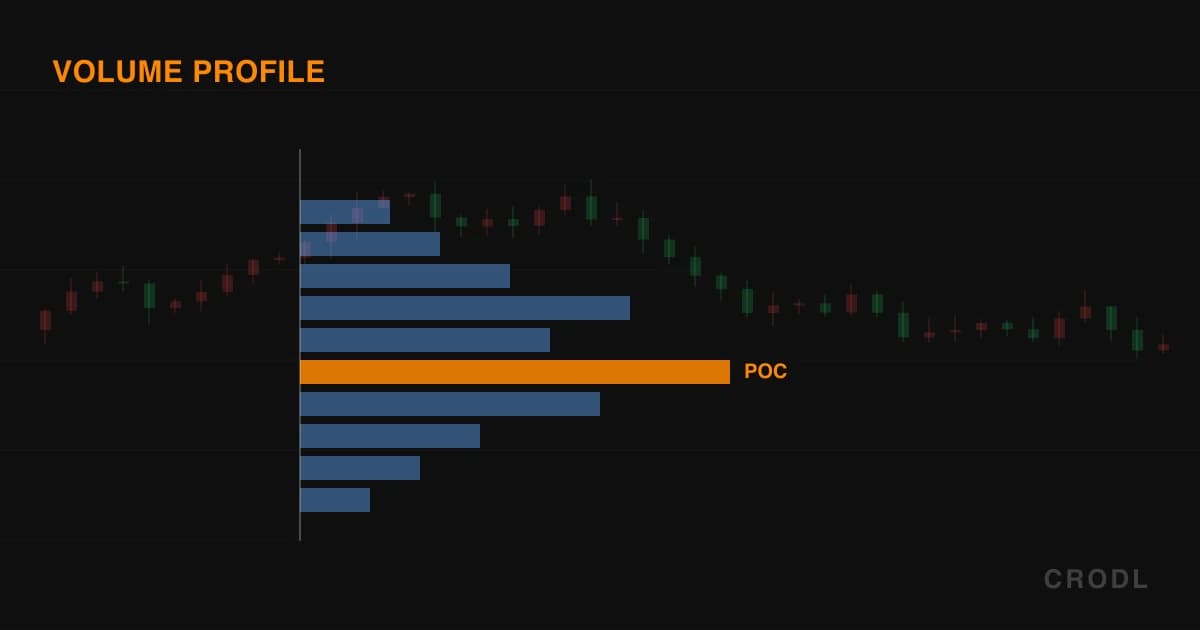
Volume Profile Drawing Tools: Fixed Range and Anchored
Crodl's two volume-profile drawings — a fixed range you place between two candles, and an anchored profile that runs from one candle to the live bar — with POC, value area and a buy/sell split.
Indicators
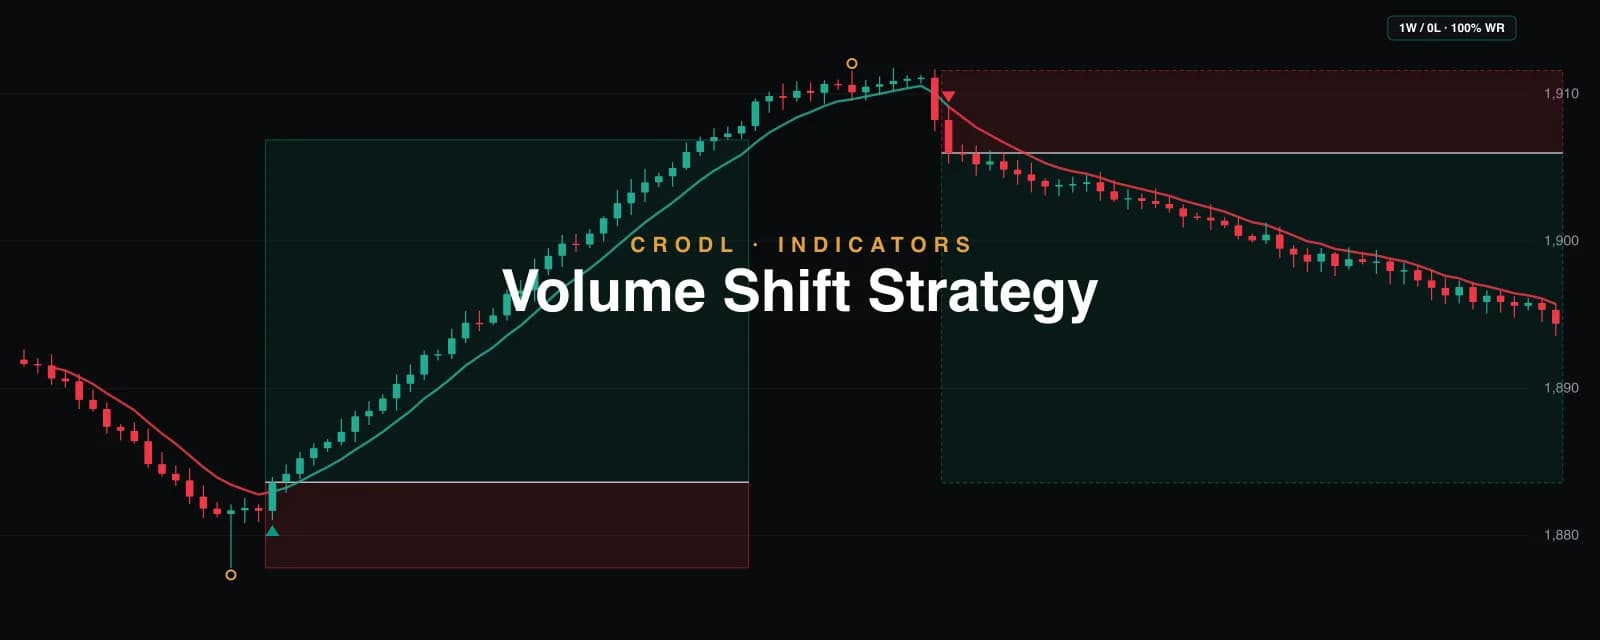
Volume Shift Strategy: The Trend Flips, Traded at 1:4
How Crodl's Volume Shift Strategy trades trend flips mechanically: entry at the flip close, stop at the previous swing, 4R target, plus daily discipline stops.
Indicators
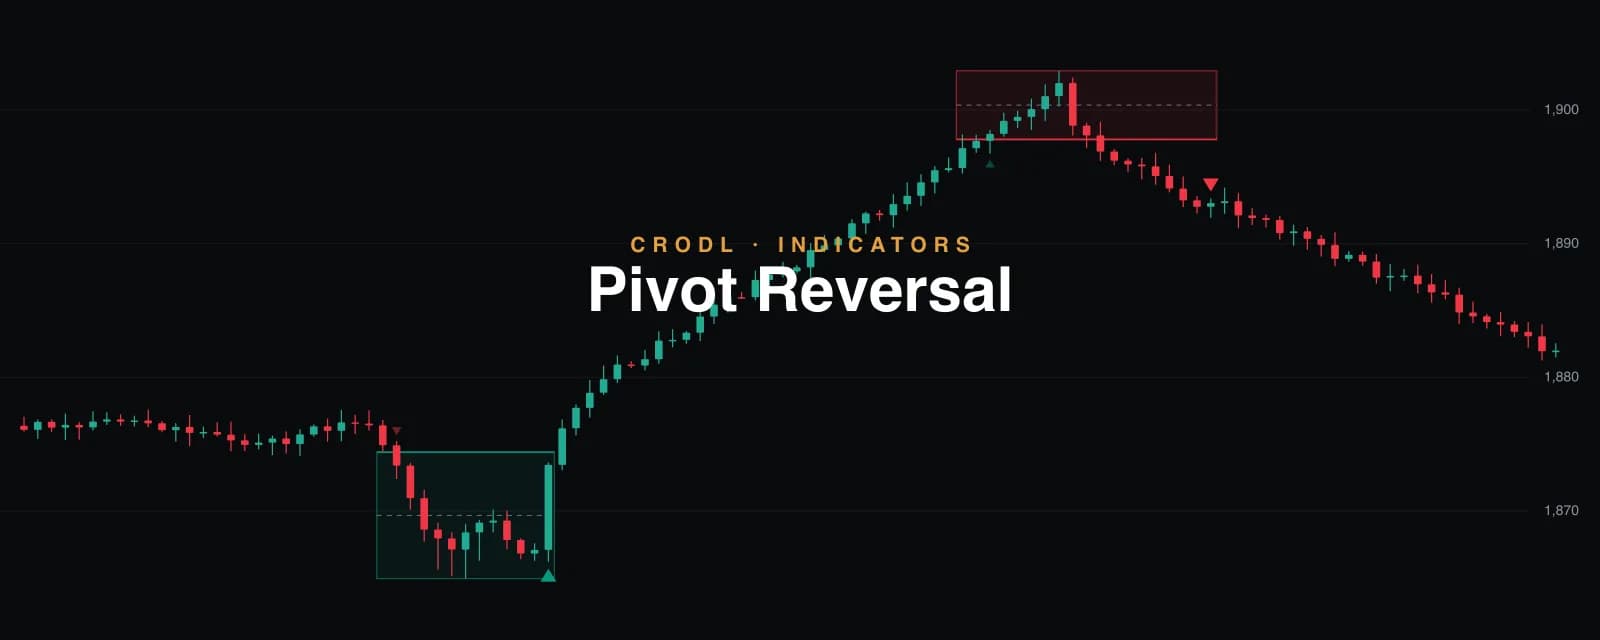
Pivot Reversal: When the Break Is the Trap
How Crodl's Pivot Reversal turns failed pivot breaks into signals: it maps the flush zone, then fires when price recloses through the level it just broke.
Indicators
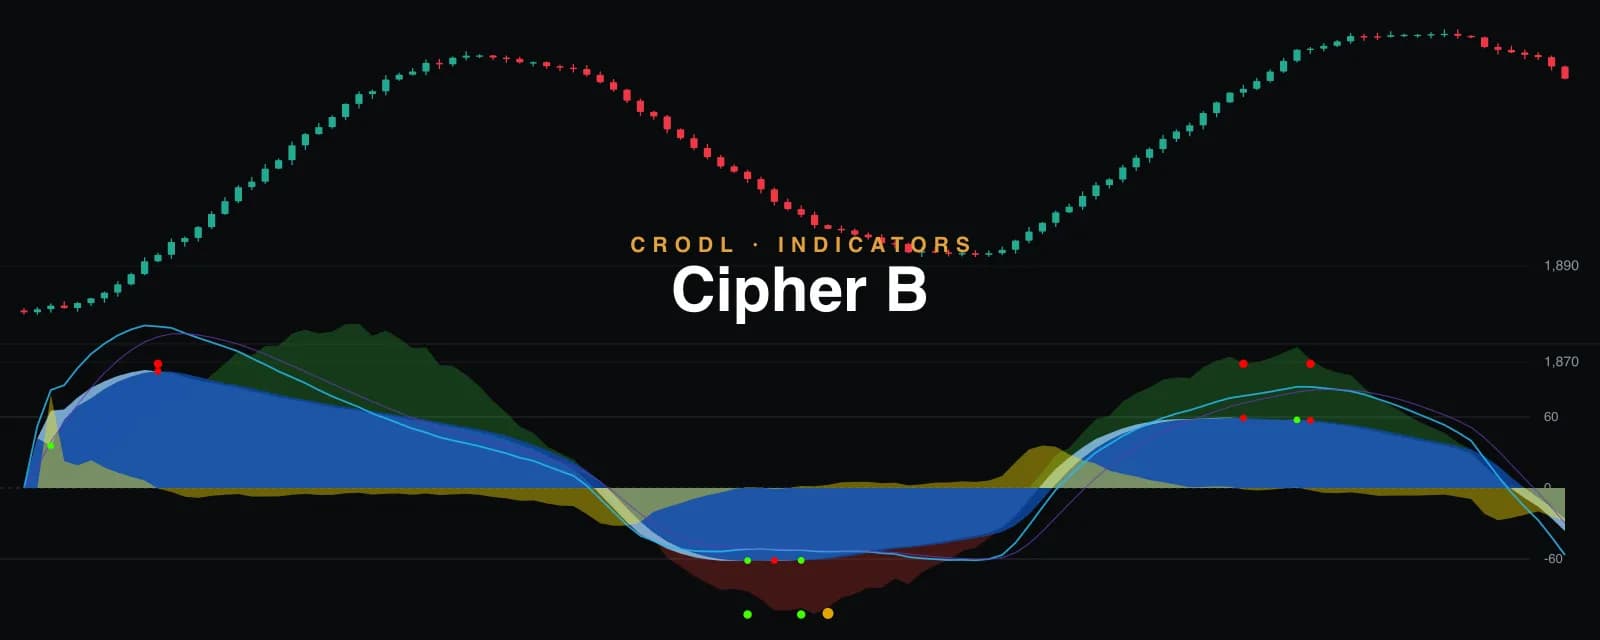
Cipher B: The Full VuManChu Suite in One Pane
How Crodl's Cipher B preset ports the open-source VuManChu Cipher B Divergences — WaveTrend waves, buy/sell/gold dots, RSI+MFI money flow, Stochastic RSI and the fractal divergence engine — natively into the terminal, with server-verified alerts.
Indicators
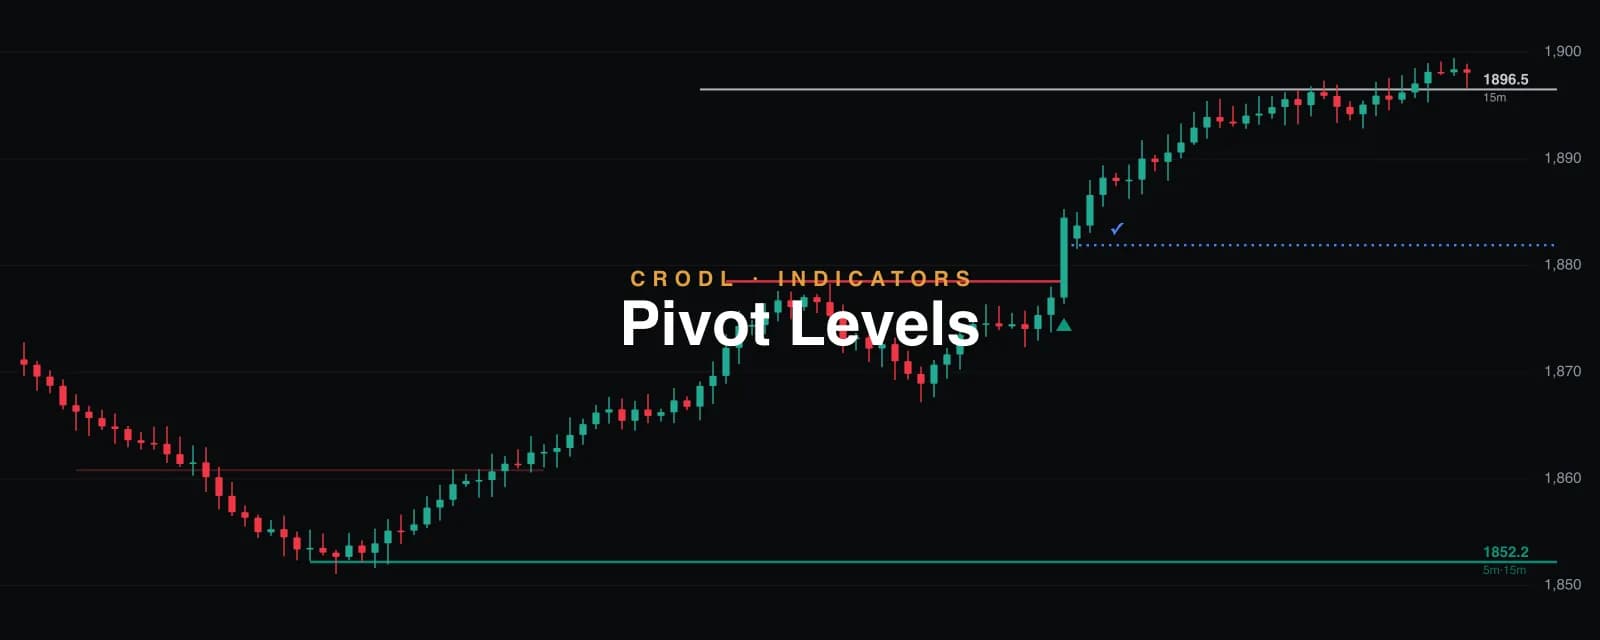
Pivot Levels: Multi-Timeframe Pivots as Managed S/R Levels
How Crodl's Pivot Levels indicator turns swing pivots from up to three timeframes into managed horizontal levels — spacing merge, cross-timeframe confluence, wick-adjust on failed breaks, breakout arrows, and a dotted ATR entry-confirmation line.
Indicators
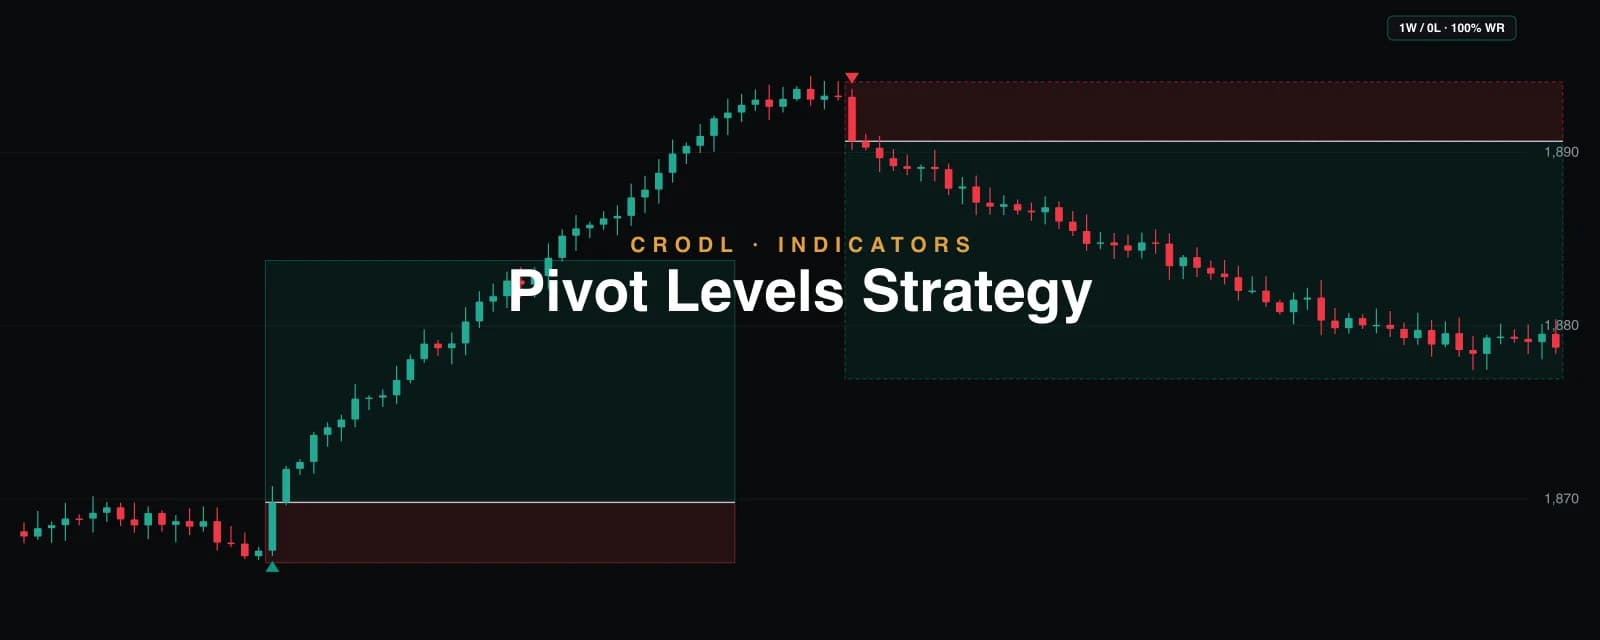
Pivot Levels Strategy: The Breakout Arrows, Traded at 1:4
How Crodl's Pivot Levels Strategy trades the Pivot Levels breakout arrows one-per-side — entry at the arrow close, stop beyond the producing candle, target at 4R — drawing every trade's risk/reward zones with a win-rate scoreboard on the chart.
Indicators
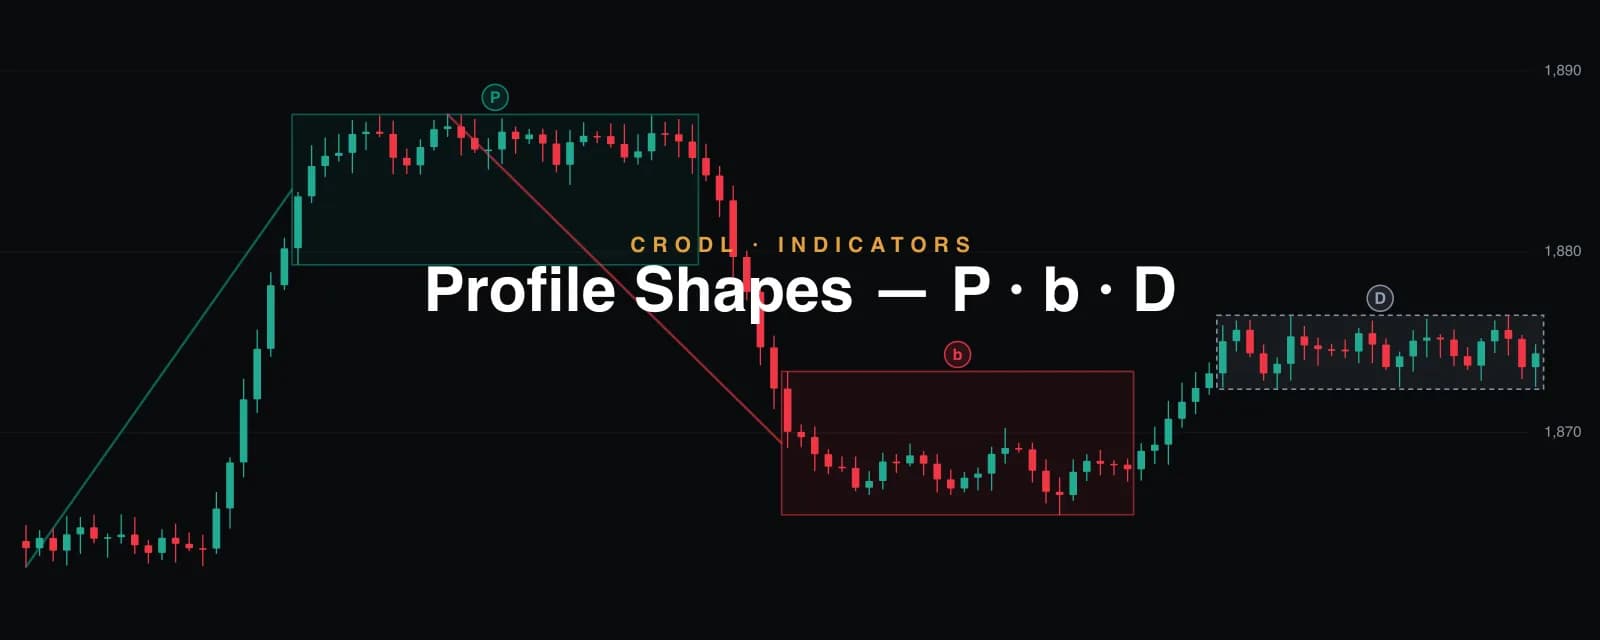
Profile Shapes: P, b and D Structure Boxes, Drawn For You
How Crodl's Profile Shapes (PBD) indicator auto-detects consolidations and draws them as P, b or D structure boxes — the pole that built each box included — plus an alternate mode that classifies per-period volume profiles.
Indicators
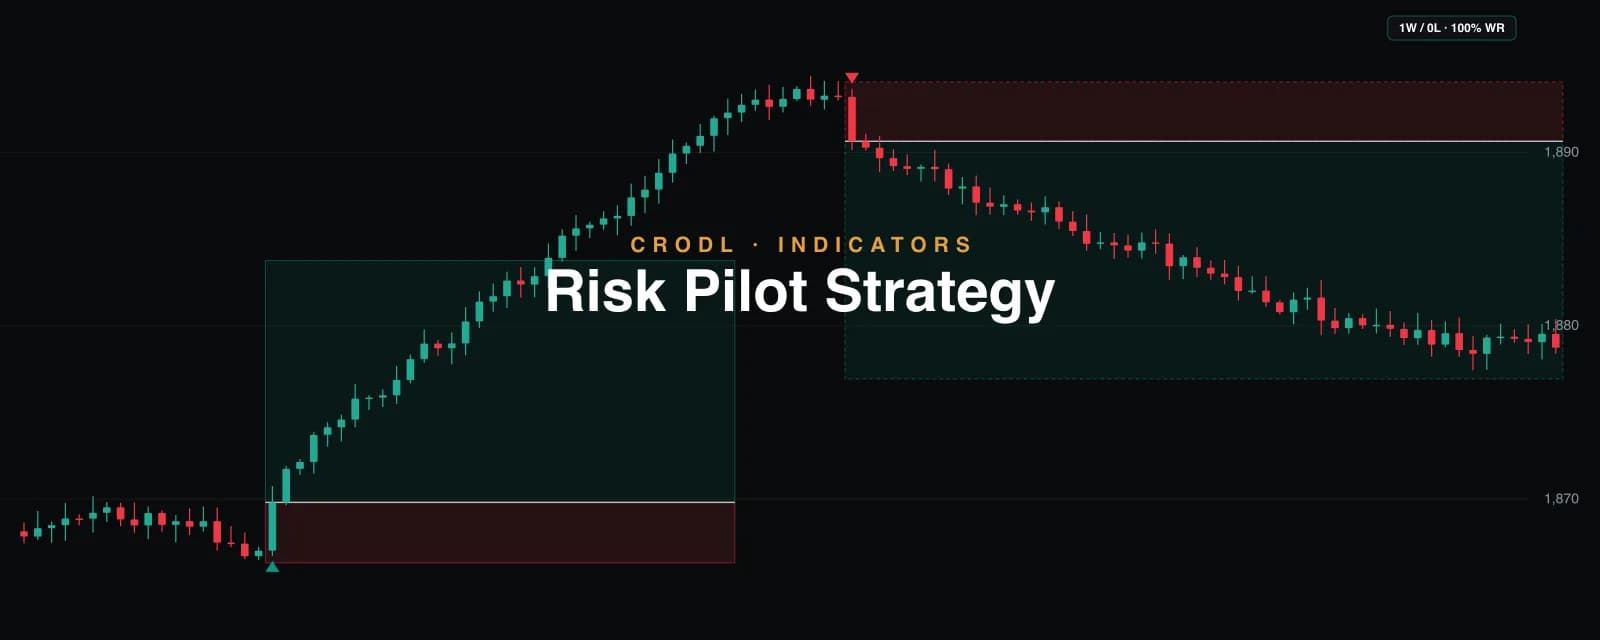
Risk Pilot Strategy: The Signals, Traded at 1:4
How Crodl's Risk Pilot Strategy trades UT-Bot ATR-trail crosses mechanically: entry at the signal close, stop beyond the producing candle, 4R target, scoreboard on the chart.
Indicators
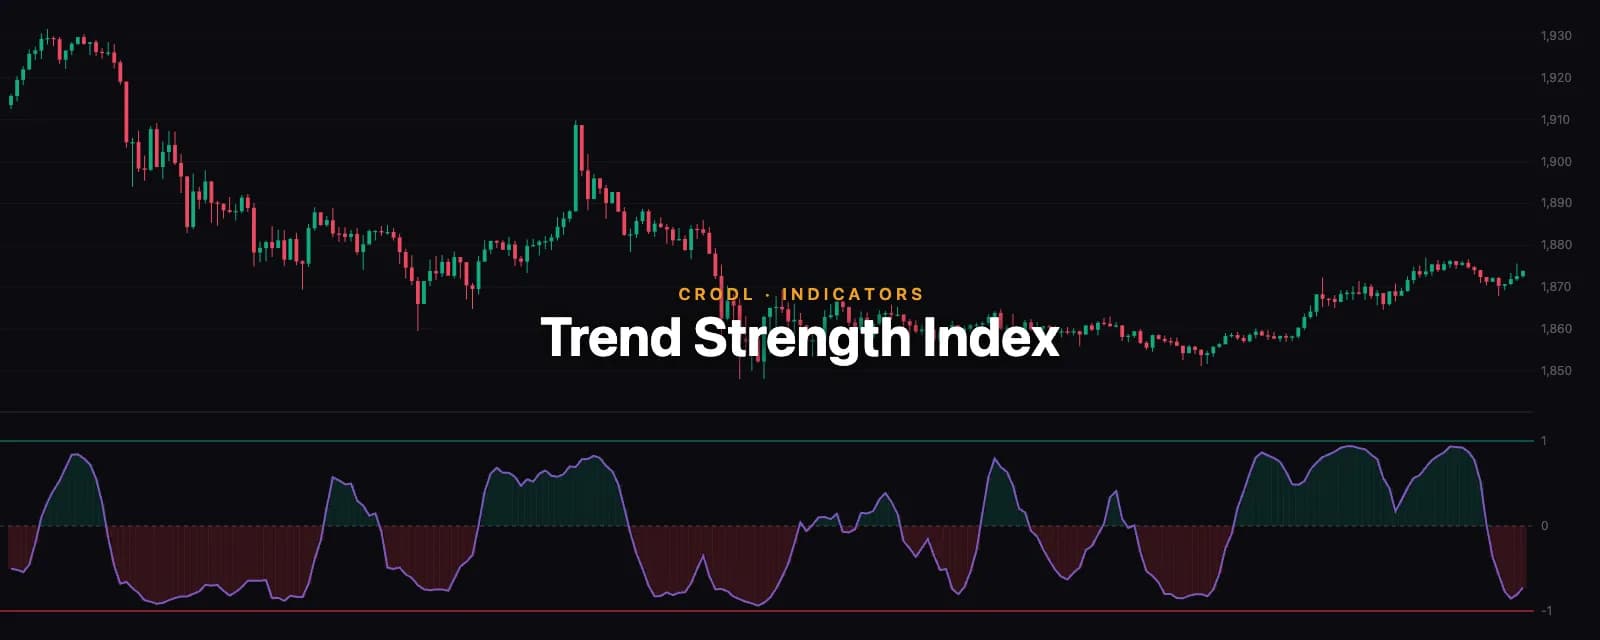
Trend Strength Index: Price-Time Correlation as a Trend Meter
How Crodl's Trend Strength Index measures the rolling Pearson correlation of price against time — +1 for a perfectly linear uptrend, −1 for a linear downtrend — with ±1 bands and zero-anchored fills.
Indicators
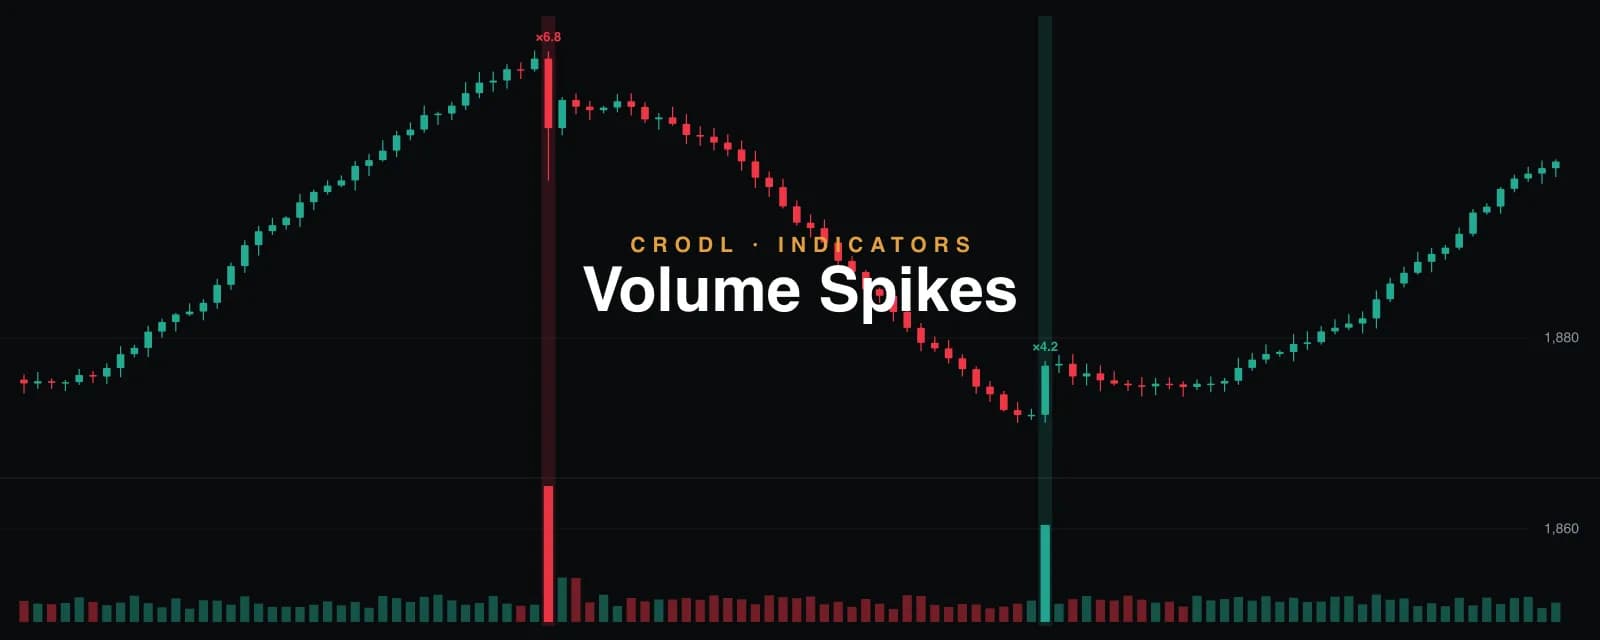
Volume Spikes: Highlight the Candle When Volume Erupts
How Crodl's Volume Spikes indicator flags every candle whose volume towers over the recent bars — a translucent column, border, or body highlight with the ×-multiple, straight on the price chart.
Indicators
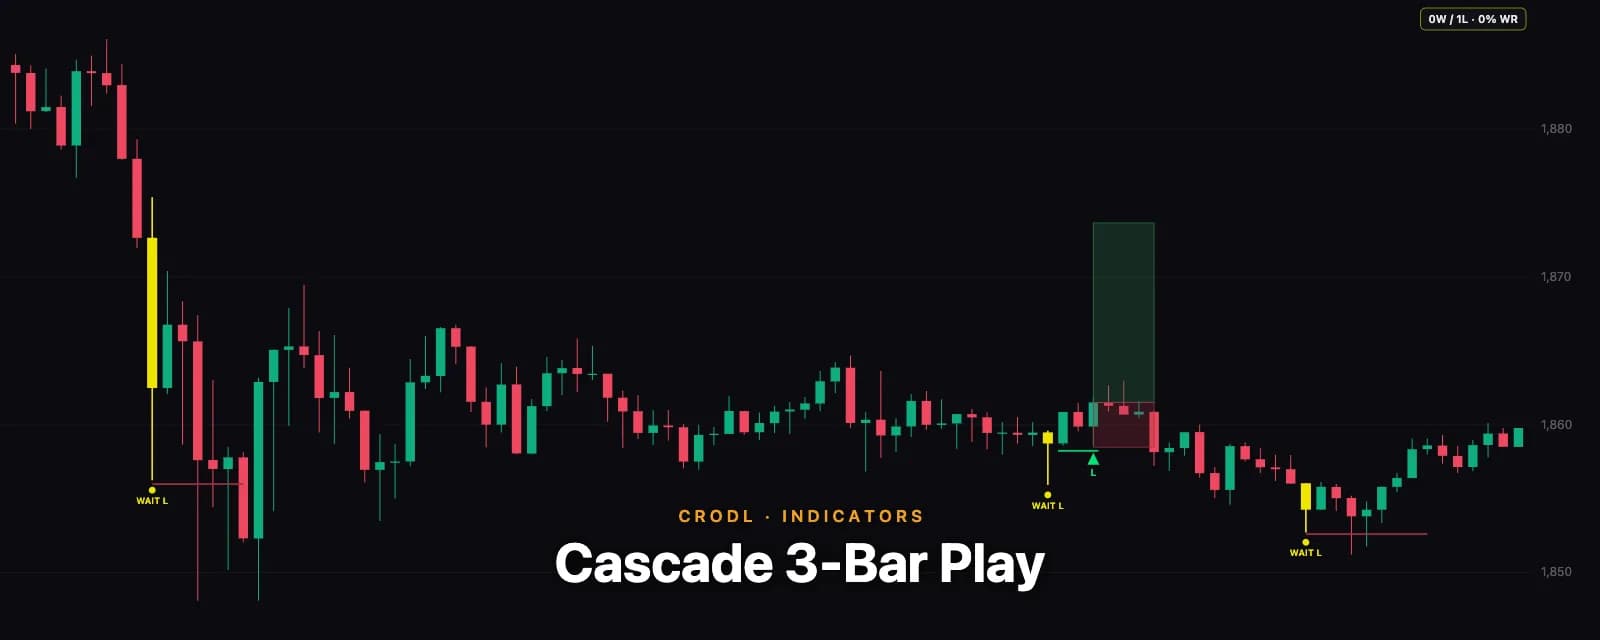
Cascade 3-Bar Play: Fading Stop Runs on Pattern Confirmation
How Crodl's Cascade 3-Bar Play study combines the stop-cascade trigger with a full three-bar play entry — the cascade sets the direction, the play times the entry, and the stop anchors to the play's impulse bar.
Indicators
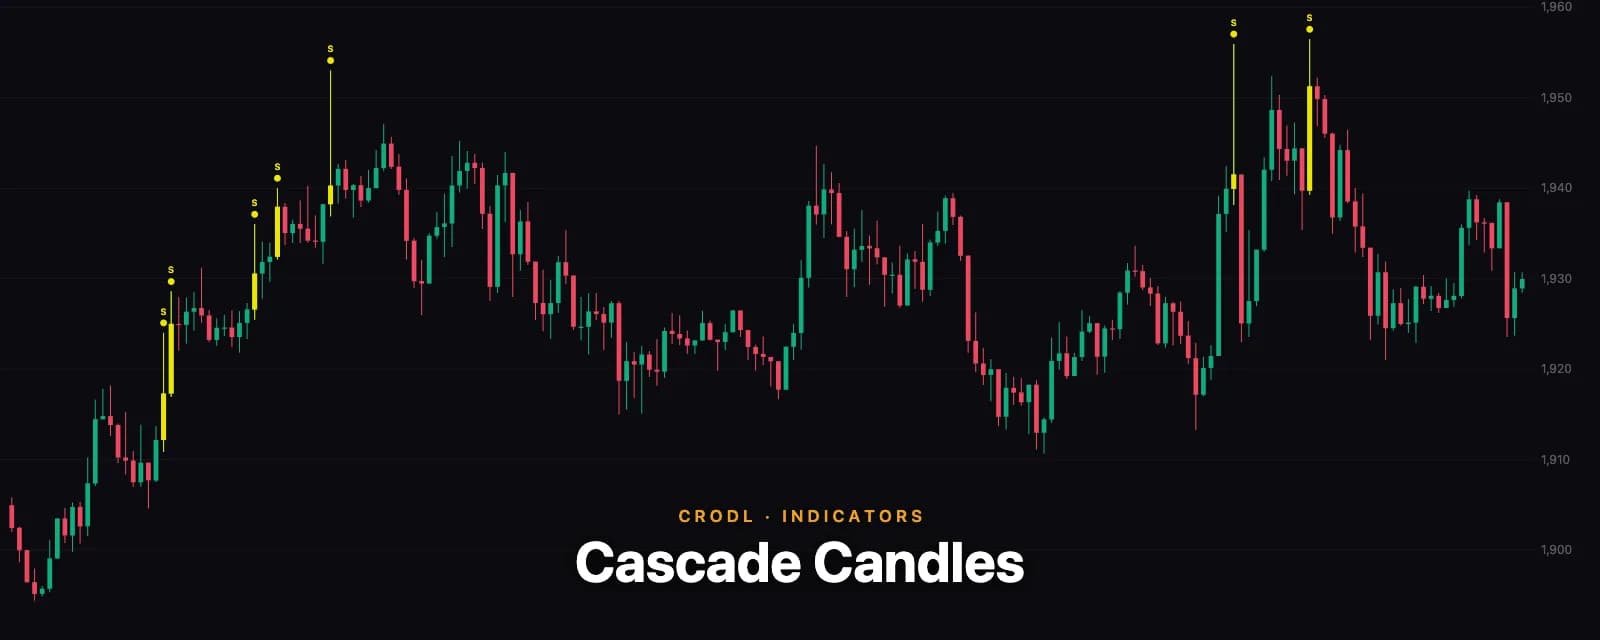
Cascade Candles: The Pure Stop-Cascade Detector
How Crodl's Cascade Candles study marks every closed candle that sweeps a prior extreme on outsized range and volume with a rejection proxy — no entries, no zones, just the cascade candles themselves.
Indicators
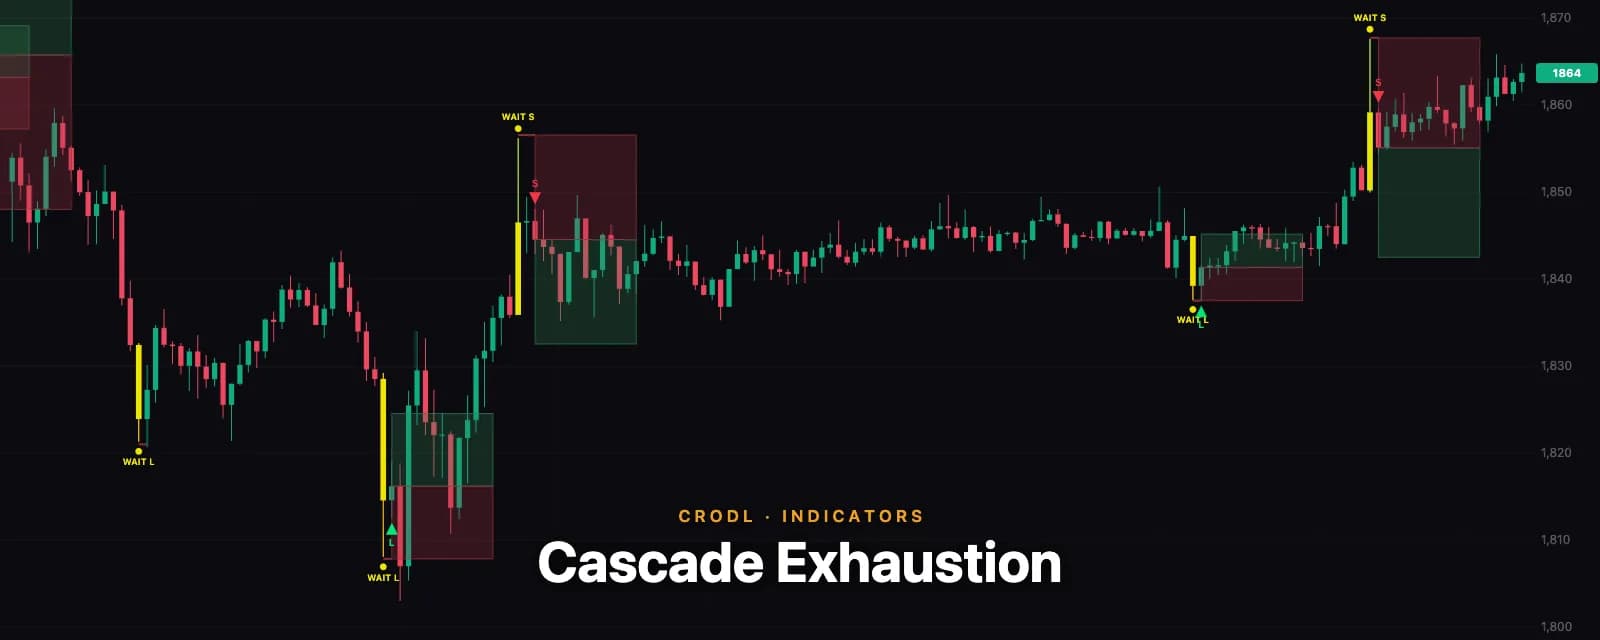
Cascade Exhaustion: Fading Stop Runs with a Directional-Close Entry
How Crodl's Cascade Exhaustion study spots stop-cascade candles — a sweep of the prior extreme on outsized range and volume — freezes a stop, and only enters on the first directional close, with fixed risk/reward zones.
Indicators
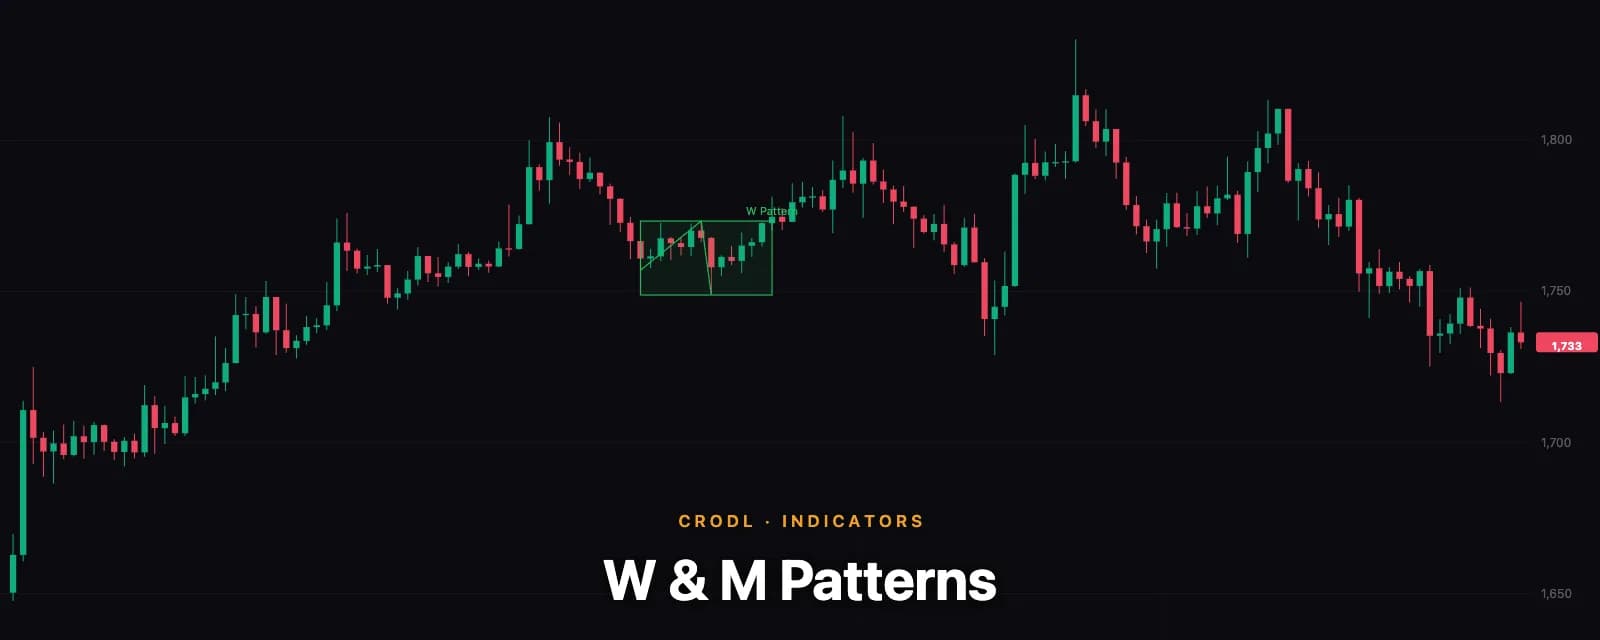
W & M Patterns: Automatic Sweep-Reversal Detection
How Crodl's W and M pattern detectors find the liquidity-sweep variant of double bottoms and tops — a wick through the first extreme that fails and reverses — and only draw them once the neckline break confirms.
Indicators
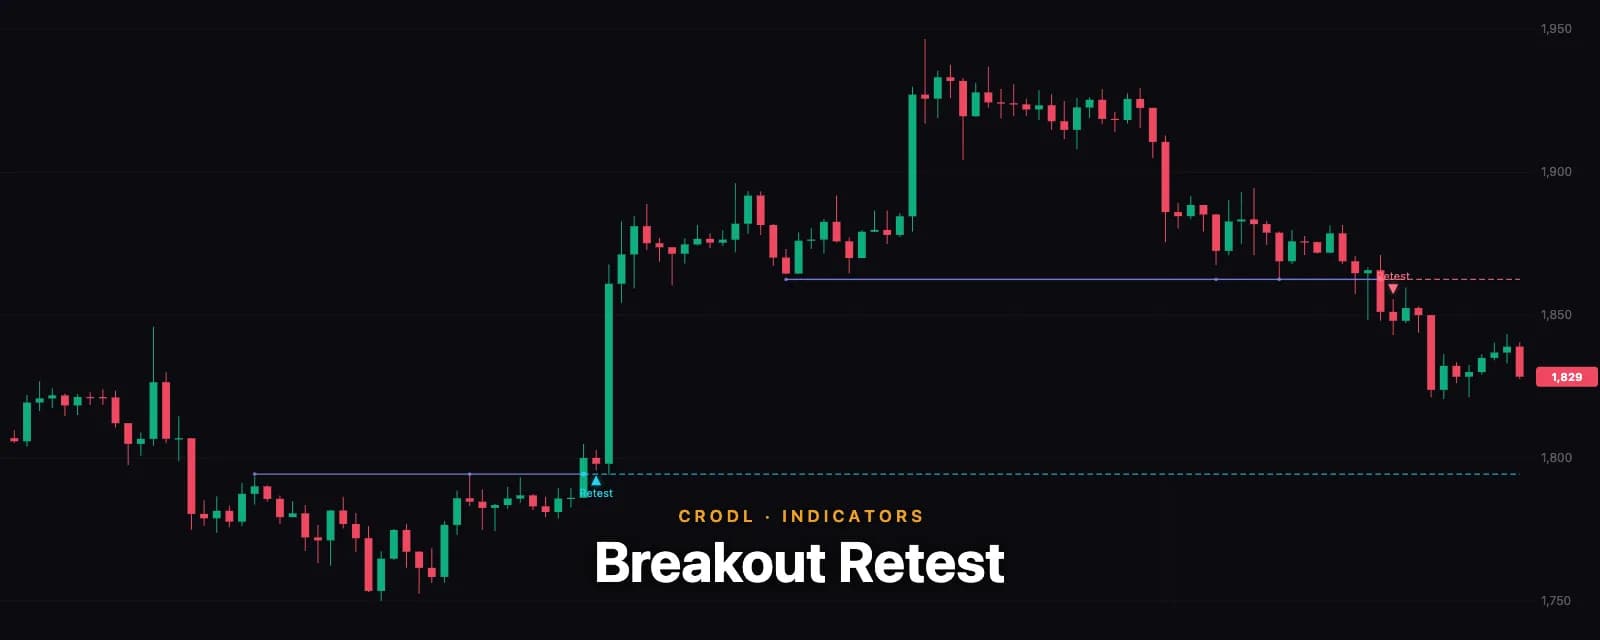
Breakout Retest: Automatic Level-Flip and Retest Detection
How Crodl's Breakout Retest study finds a horizontal level, marks the decisive close that breaks it, and flags the return-and-reject retest — the flipped support/resistance entry, drawn only once it confirms.
Indicators
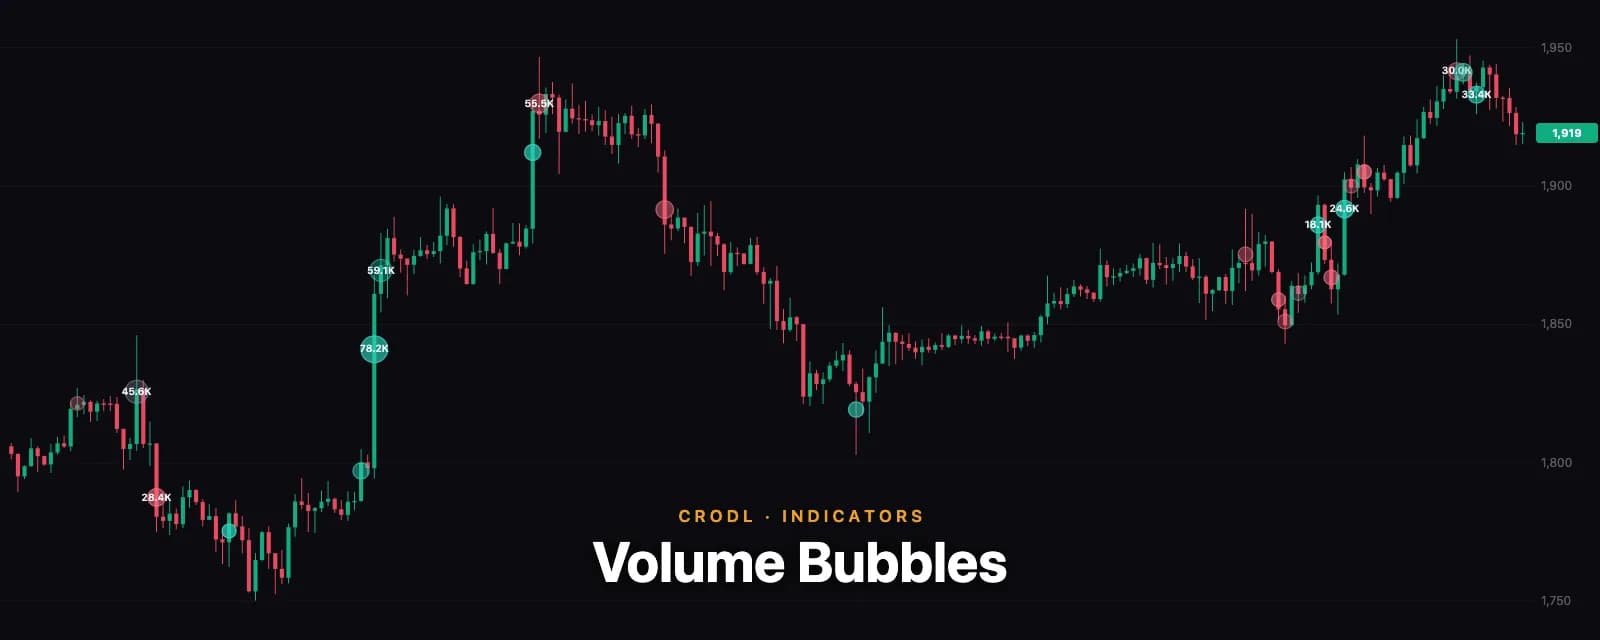
Volume Bubbles: Bookmap-Style Buy/Sell Volume on Your Candles
How Crodl's Volume Bubbles study spots unusually large prints with a rolling volume z-score and draws them as area-proportional bubbles coloured by estimated aggressor side — buys teal, sells rose.
Indicators
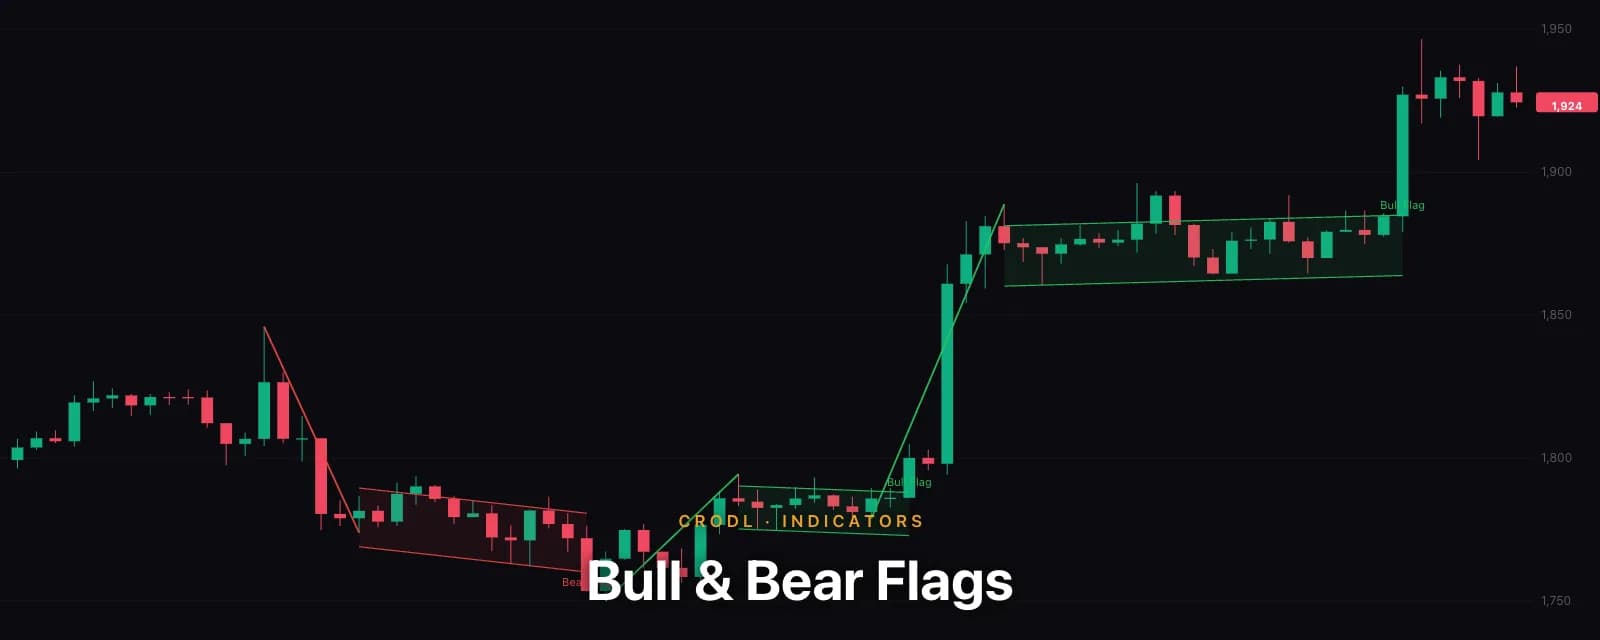
Bull Flag & Bear Flag: Automatic Continuation-Pattern Detection
How Crodl's Bull Flag and Bear Flag detectors find the flagpole, measure the consolidation channel, and confirm the breakout — continuation patterns drawn mechanically, only after they complete.
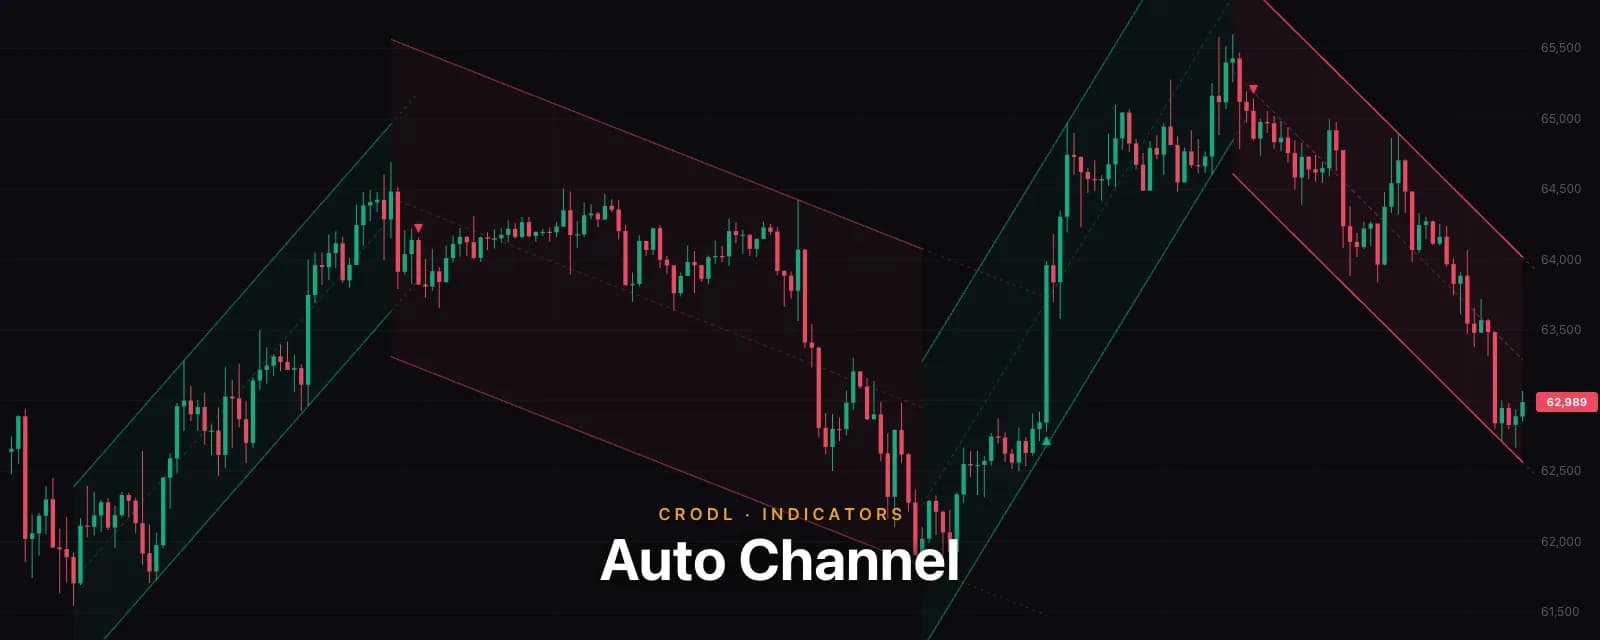
Indicators
Auto Channel: Parallel Trend Channels That Draw Themselves
The Auto Channel indicator segments price into trend legs with an ATR zigzag and pins a parallel channel to each one — anchored like a hand drawing, with a break marker when the trend ends.
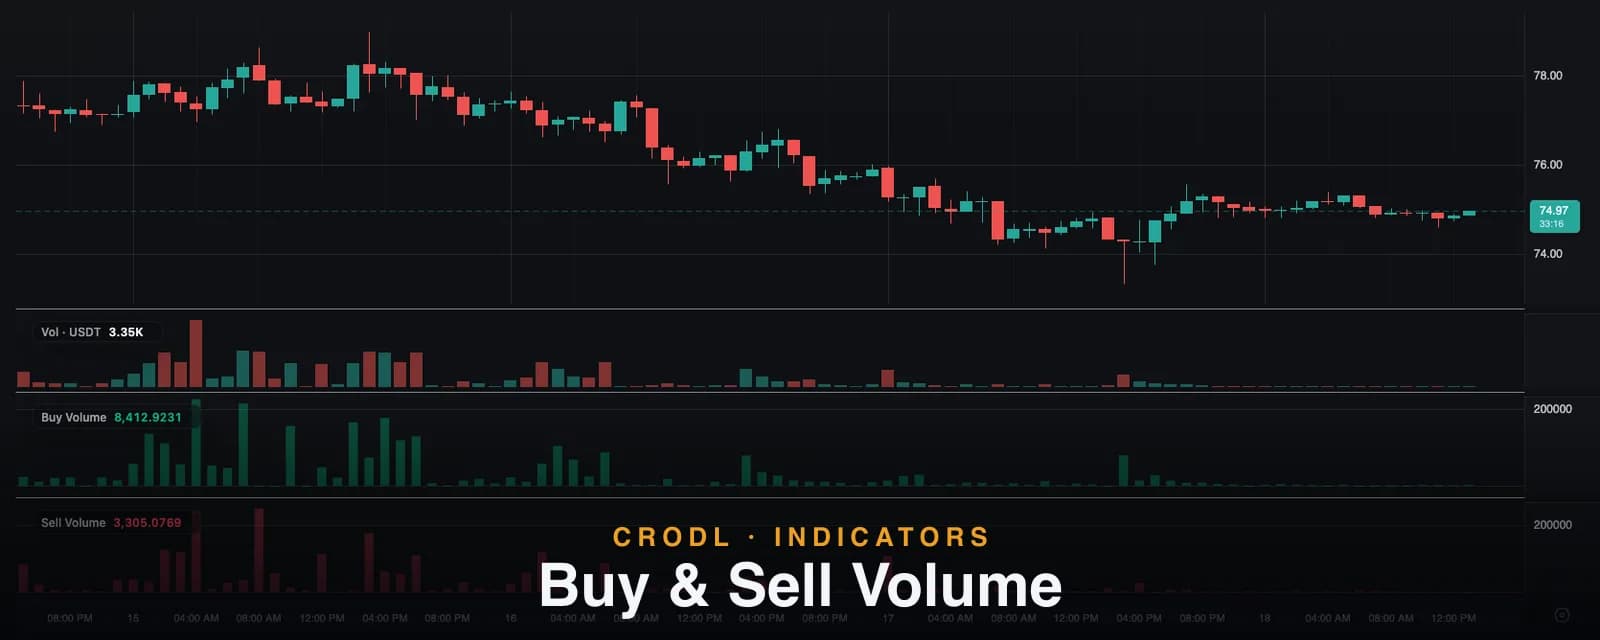
Indicators
Buy Volume and Sell Volume: Splitting the Bar Into Its Two Sides
The Buy Volume and Sell Volume indicators estimate each candle's buying and selling volume from its shape. How the weighted split works and how to read each side alone.
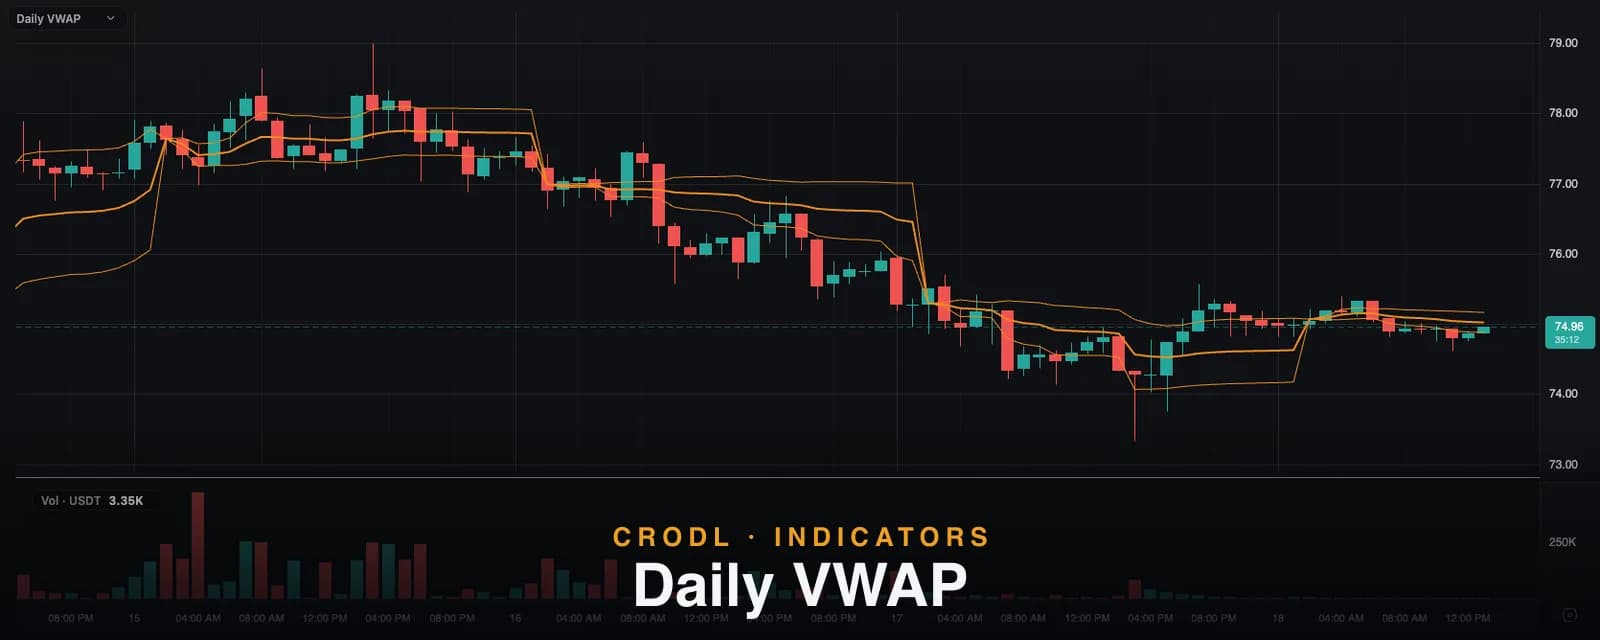
Indicators
Daily VWAP: The Session's Fair-Value Line, Zero Configuration
The Daily VWAP indicator re-anchors on every daily candle and runs to end of day — the intraday fair-value line institutions benchmark against, with ±σ bands built in.
Indicators
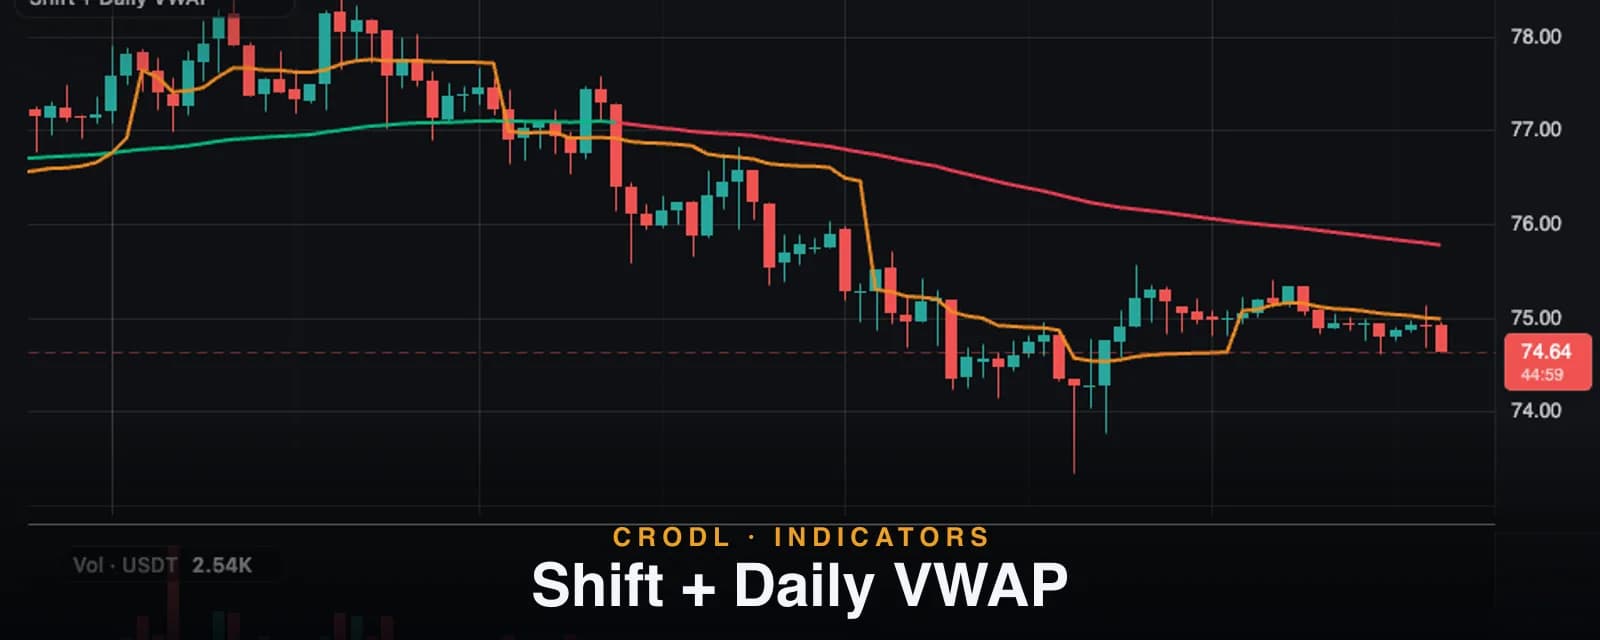
Shift + Daily VWAP: The Two-Line Bias Read
One trend-colored EMA, one daily-anchored VWAP, nothing else. How the Shift + Daily VWAP indicator compresses intraday bias into two lines and how to trade their agreement.
Indicators
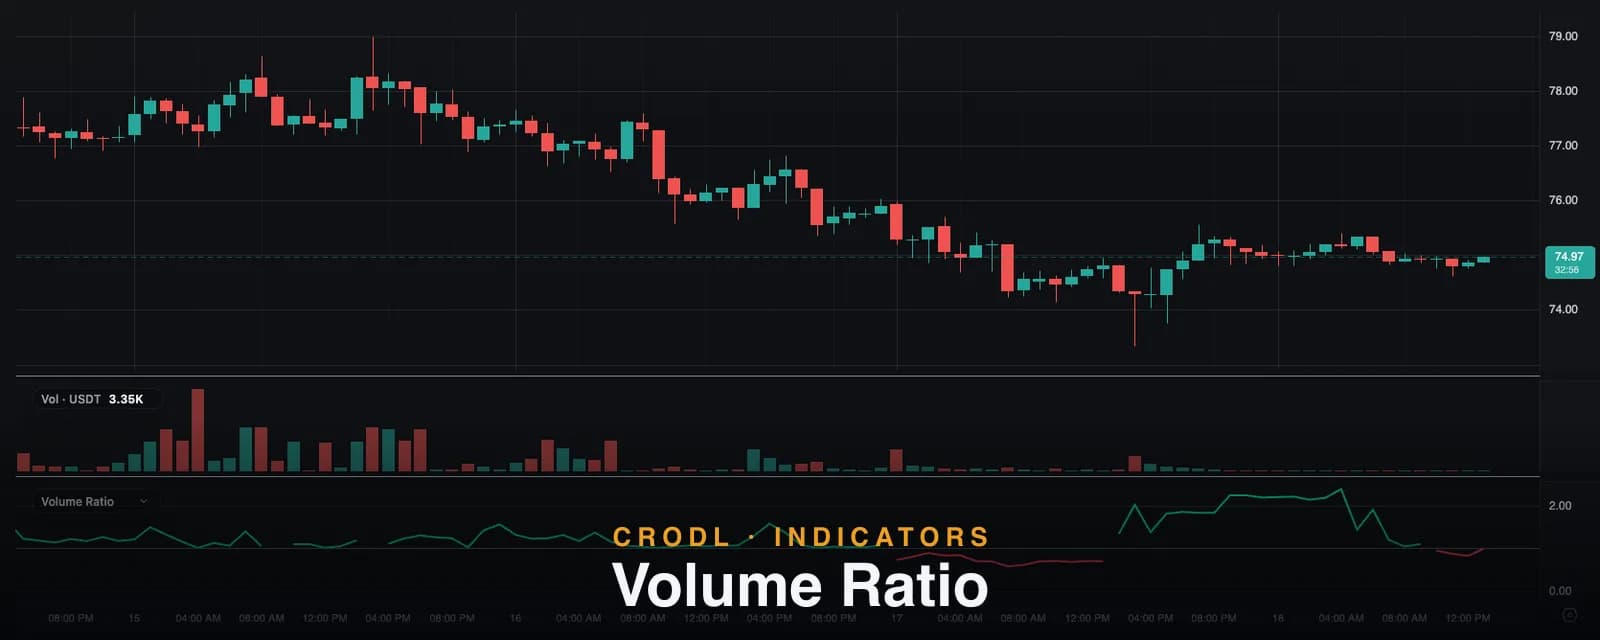
Volume Ratio: One Line for the Buy/Sell Balance
The Volume Ratio indicator divides smoothed buy volume by smoothed sell volume — above 1 buyers rule the window, below 1 sellers do. How it works and how to trade it.
Drawing Tools
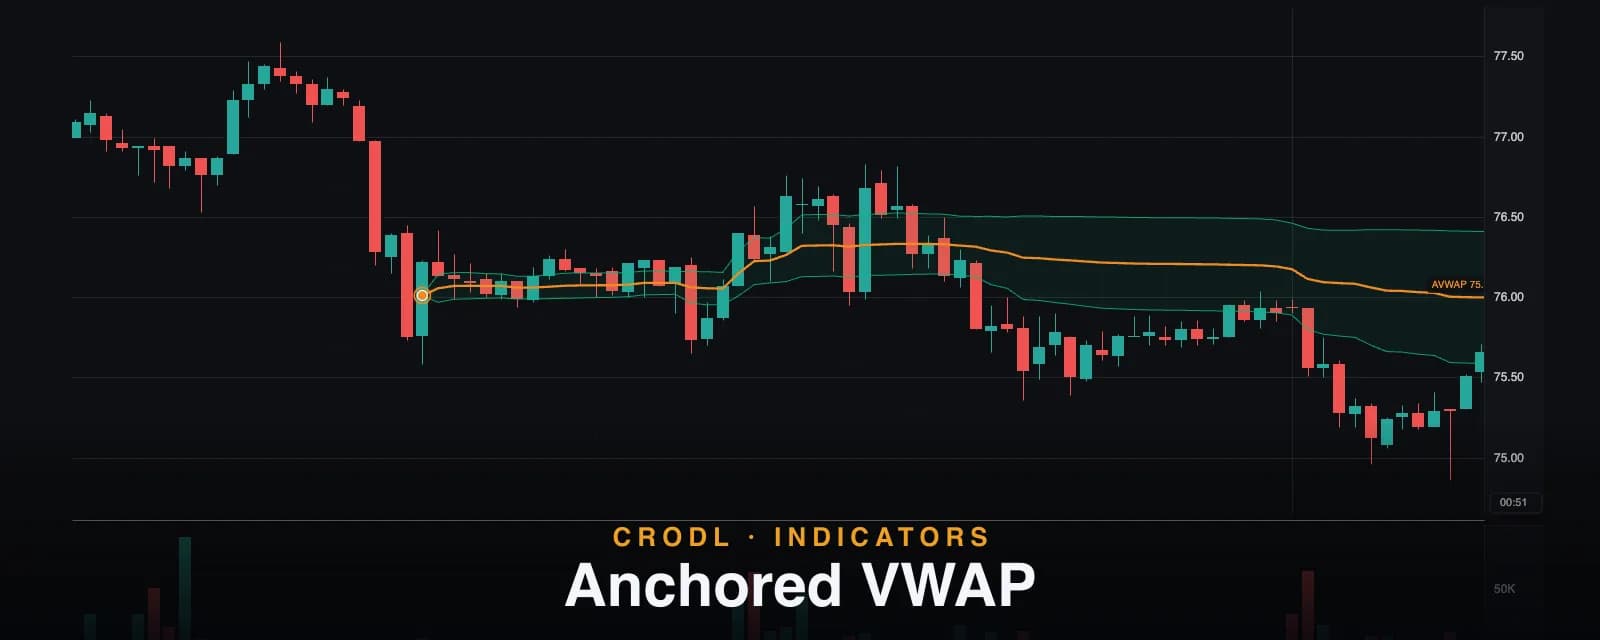
Anchored VWAP: The Average Price Paid Since the Moment That Mattered
Anchored VWAP is a one-click drawing tool on the Crodl chart: click any candle to anchor a volume-weighted average price line with optional ±1σ and ±2σ bands.
Indicators
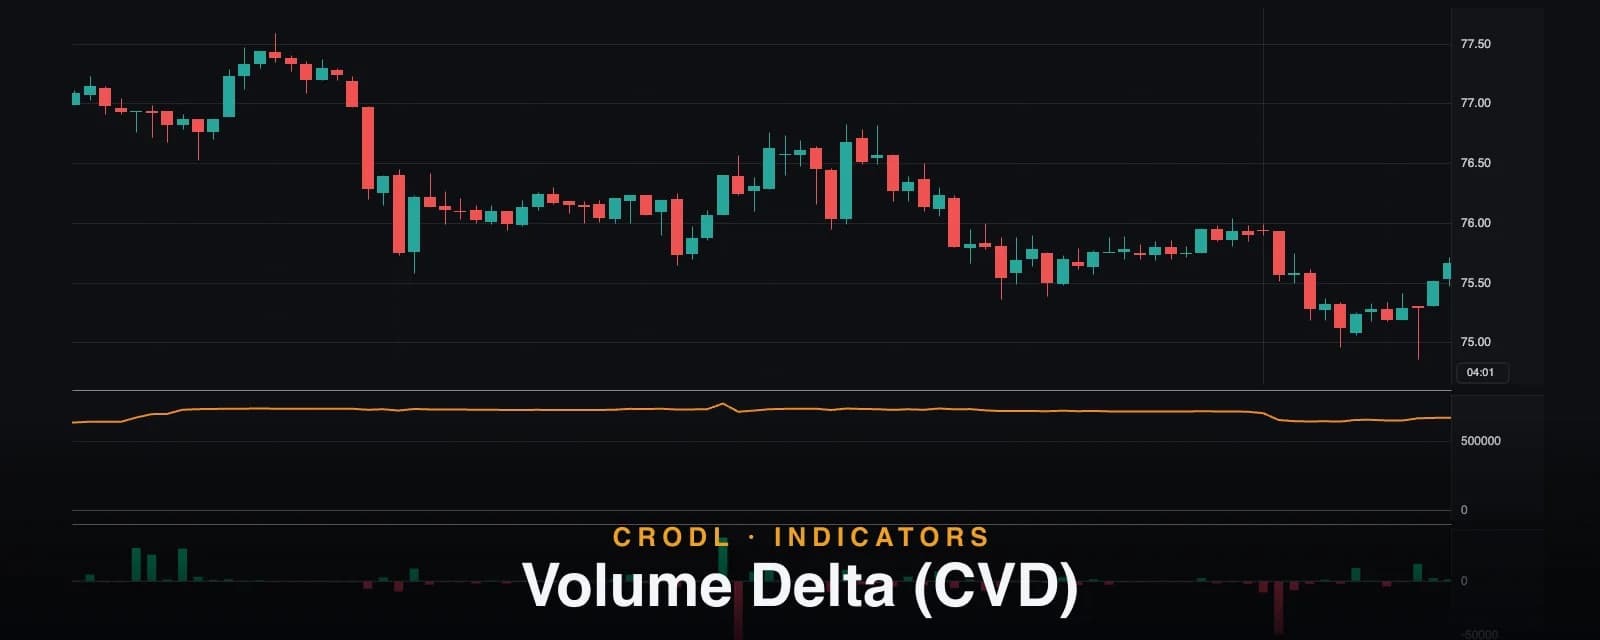
Volume Delta and CVD: Reading Who Was in Control of Every Candle
Volume Delta splits each candle's volume into buying and selling pressure; CVD keeps the running total. How the weighted model works and how to trade it.
Indicators
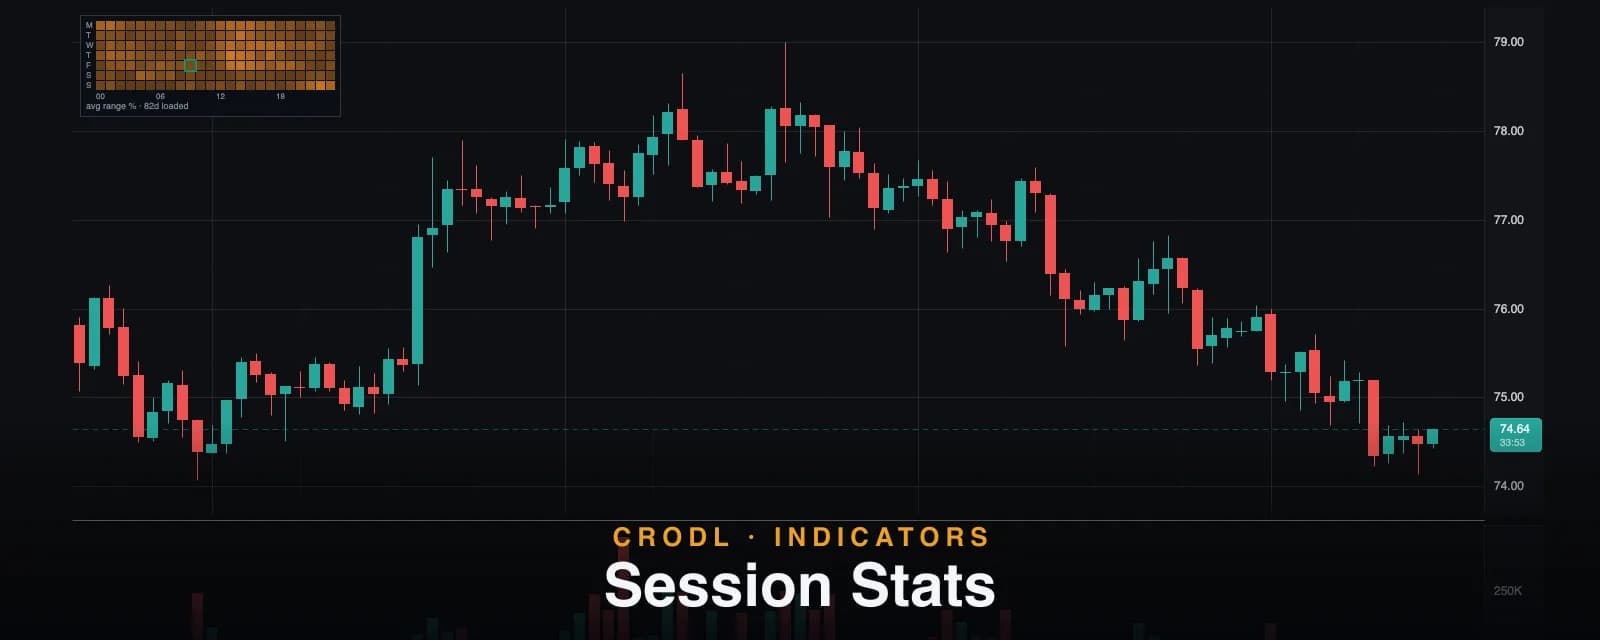
Session Stats: A Heatmap of When Your Market Actually Moves
A volatility heatmap by UTC hour and weekday, built from the candles on your chart — how the buckets are averaged, what hollow cells mean, and how to pick your hours.
Indicators
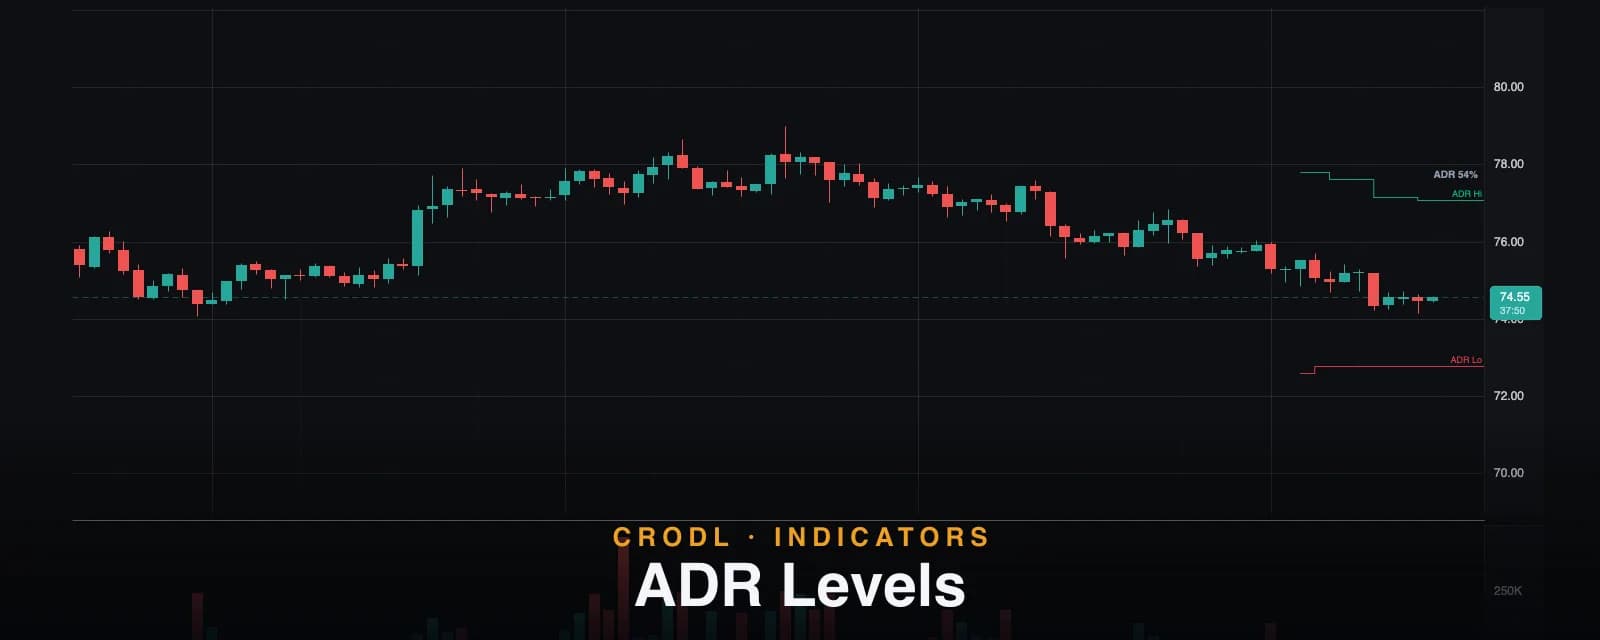
ADR Levels: The Average Daily Range as an Intraday Exhaustion Map
Average Daily Range exhaustion levels computed from your chart's own history — dynamic low+ADR and high−ADR caps, the ADR-used readout, and how day traders trade them.
Indicators
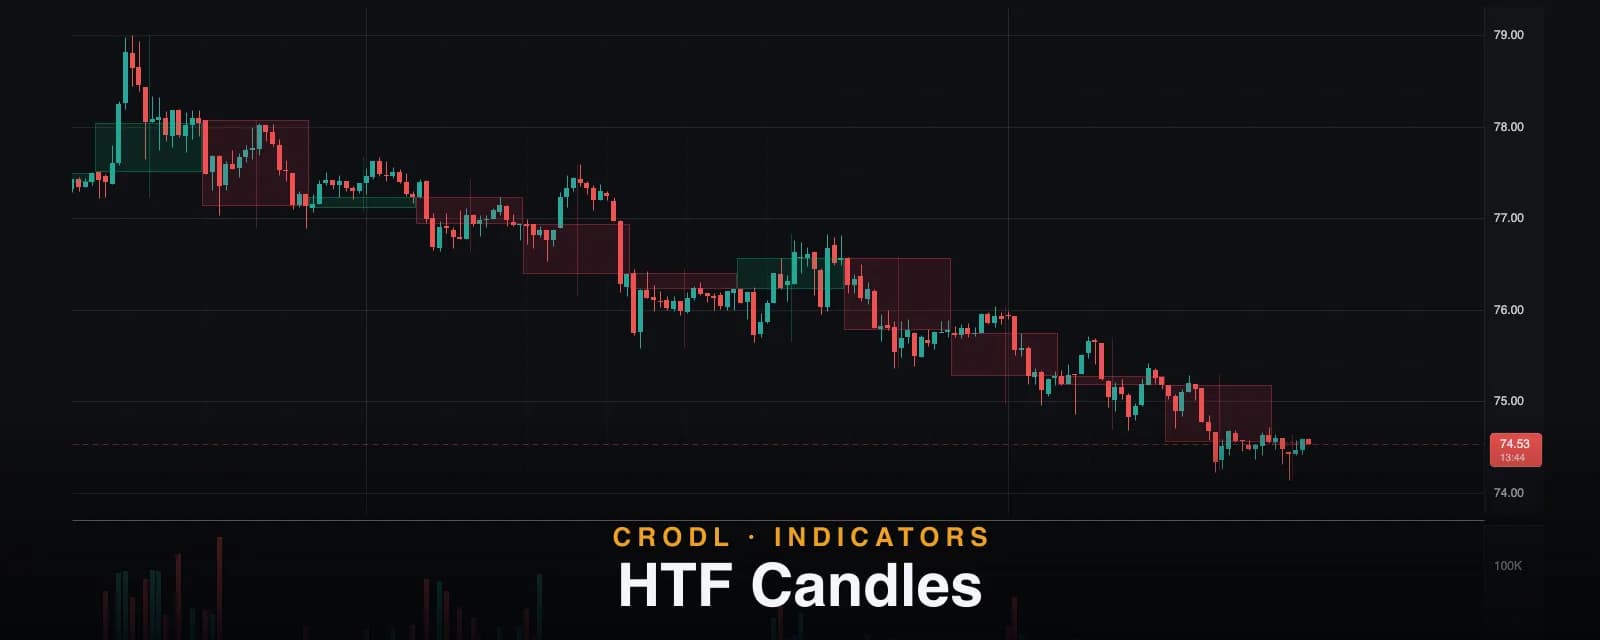
HTF Candles: See the 4-Hour Chart Without Leaving the 15-Minute
HTF Candles draws translucent higher-timeframe ghost candles behind your chart — auto-mapped or fixed from 3m to 1W, with dashed still-forming periods.
Indicators
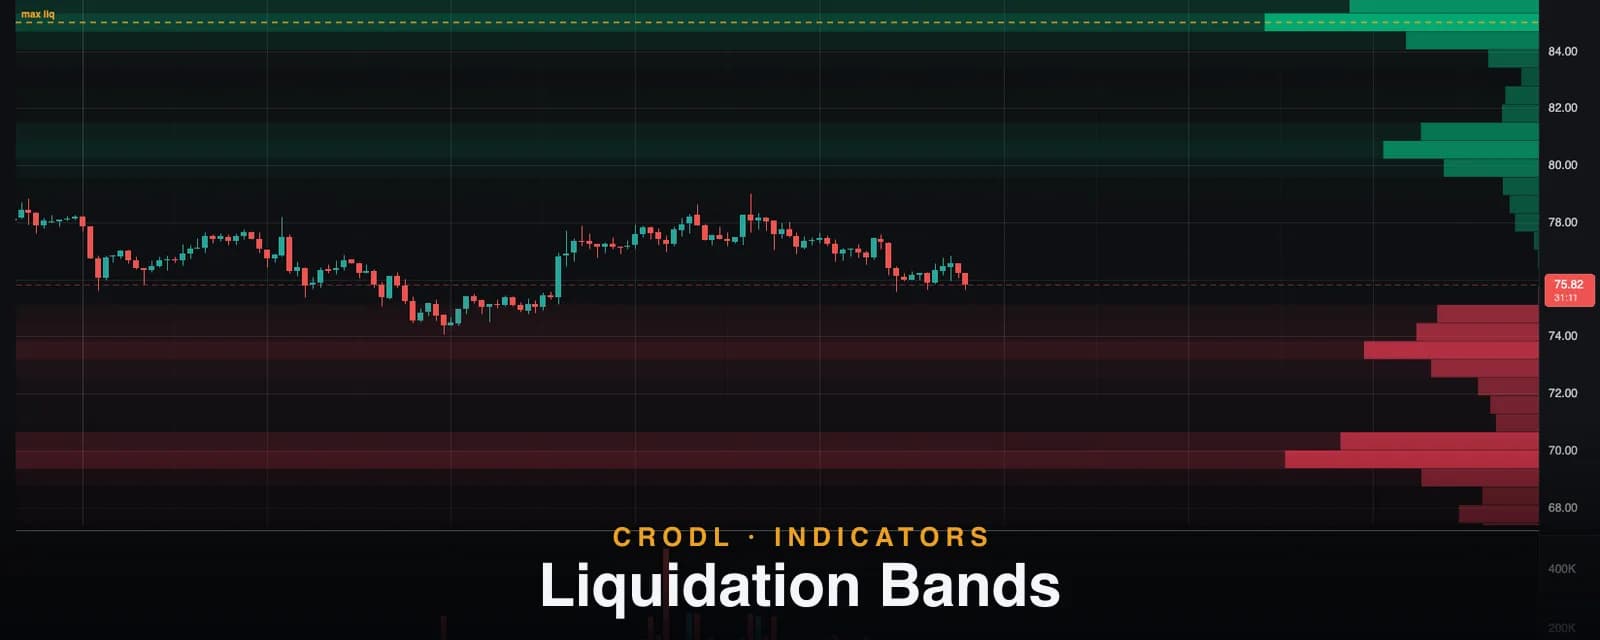
Liquidation Bands: A Heatmap of Where Leverage Dies
A heatmap-style view of estimated liquidation density at every price level — how the bands are built, why they burn off when swept, and how to trade the map.
Indicators
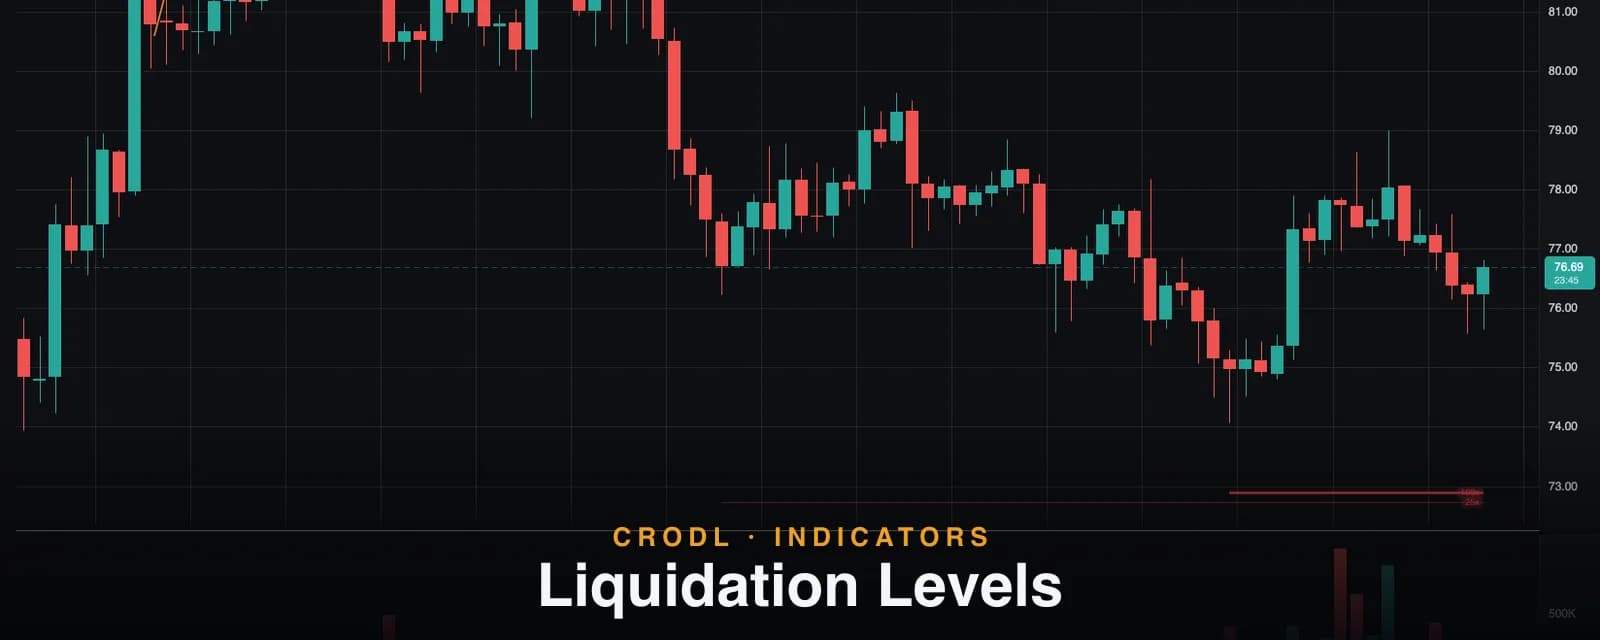
Liquidation Levels: How to Read Liquidation Magnets on a Crypto Chart
Leveraged positions cluster at obvious swing points, and their liquidation prices become magnets. How Crodl estimates those zones, reads the 10x-100x tiers, and trades them.
Indicators
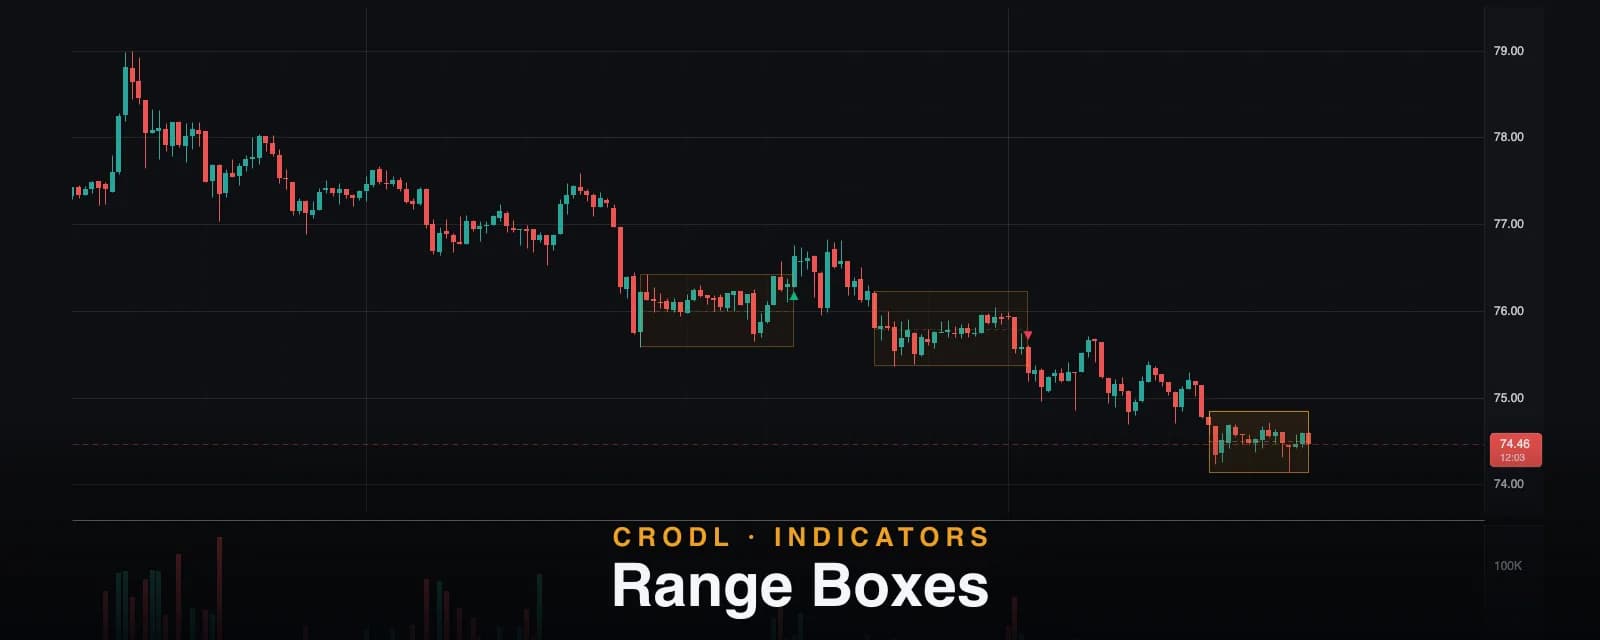
Range Boxes: Automatic Consolidation Detection That Doesn't Repaint
Automatic consolidation-range boxes for crypto charts — how a range confirms inside an ATR band, why the box edges freeze, and how closing-bar breakouts fire.
Indicators
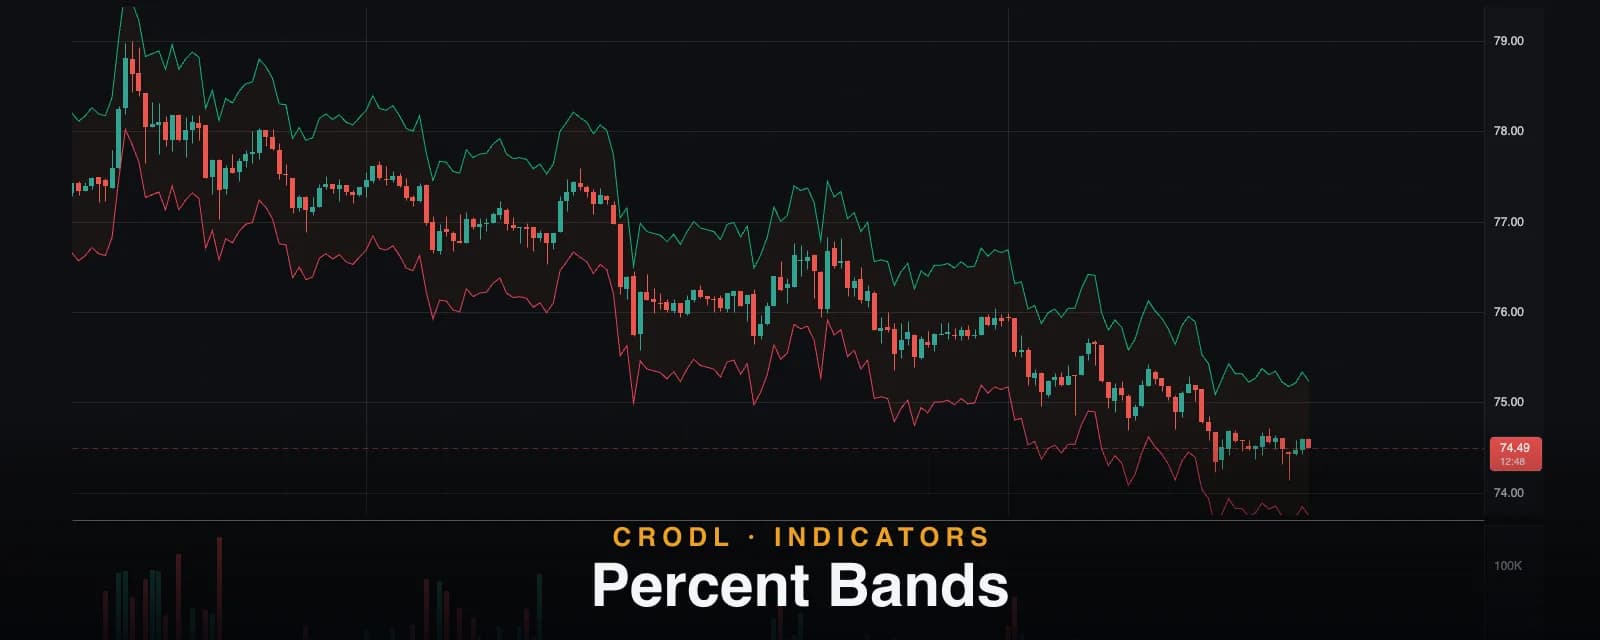
Percent Bands: A Fixed-Percentage Ruler for Every Chart
Percent Bands wraps price or an SMA basis in a fixed ±% envelope — a simple ruler for sizing moves, framing targets, and running classic envelope reversion.
Indicators
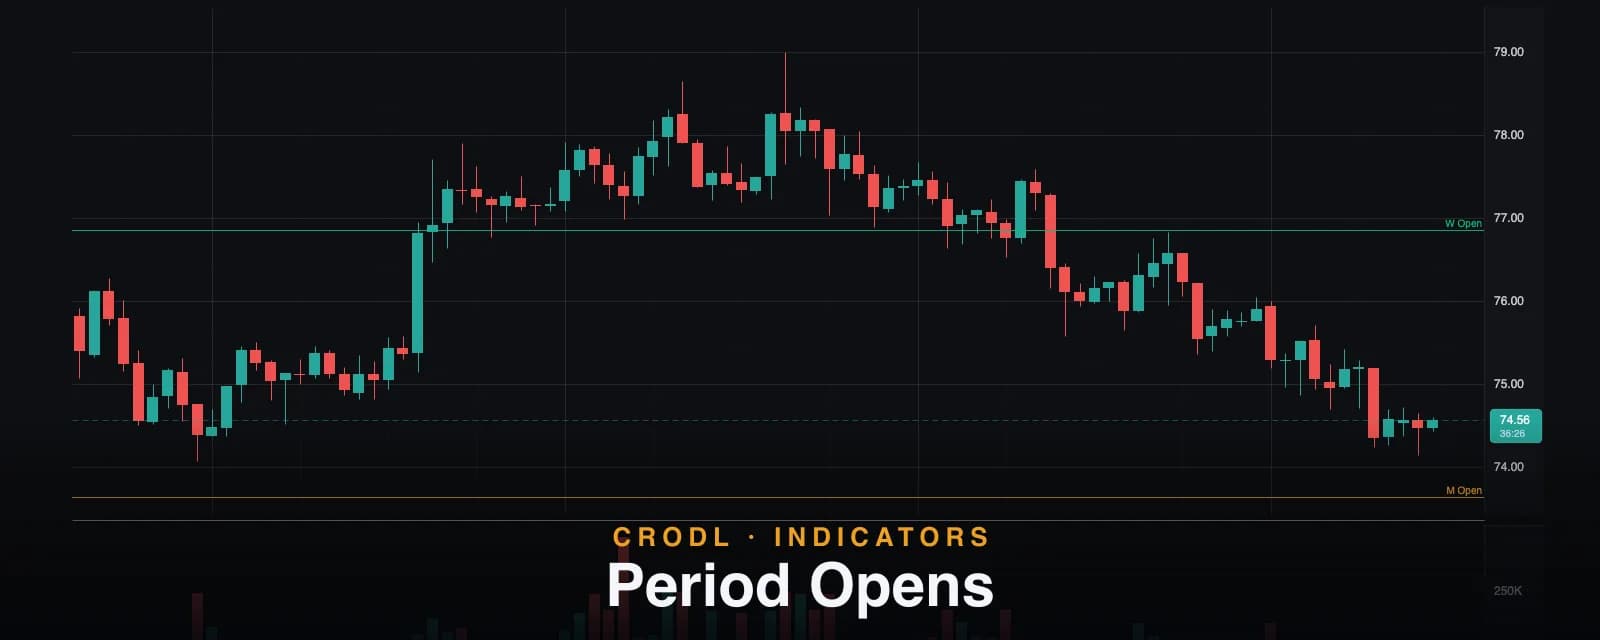
Period Opens: Weekly, Monthly, Quarterly and Yearly Open Lines
Weekly, monthly, quarterly and yearly open lines in pure UTC — how each period is bucketed, what the dashed ≈ levels mean, and how traders frame bias around the opens.
Indicators
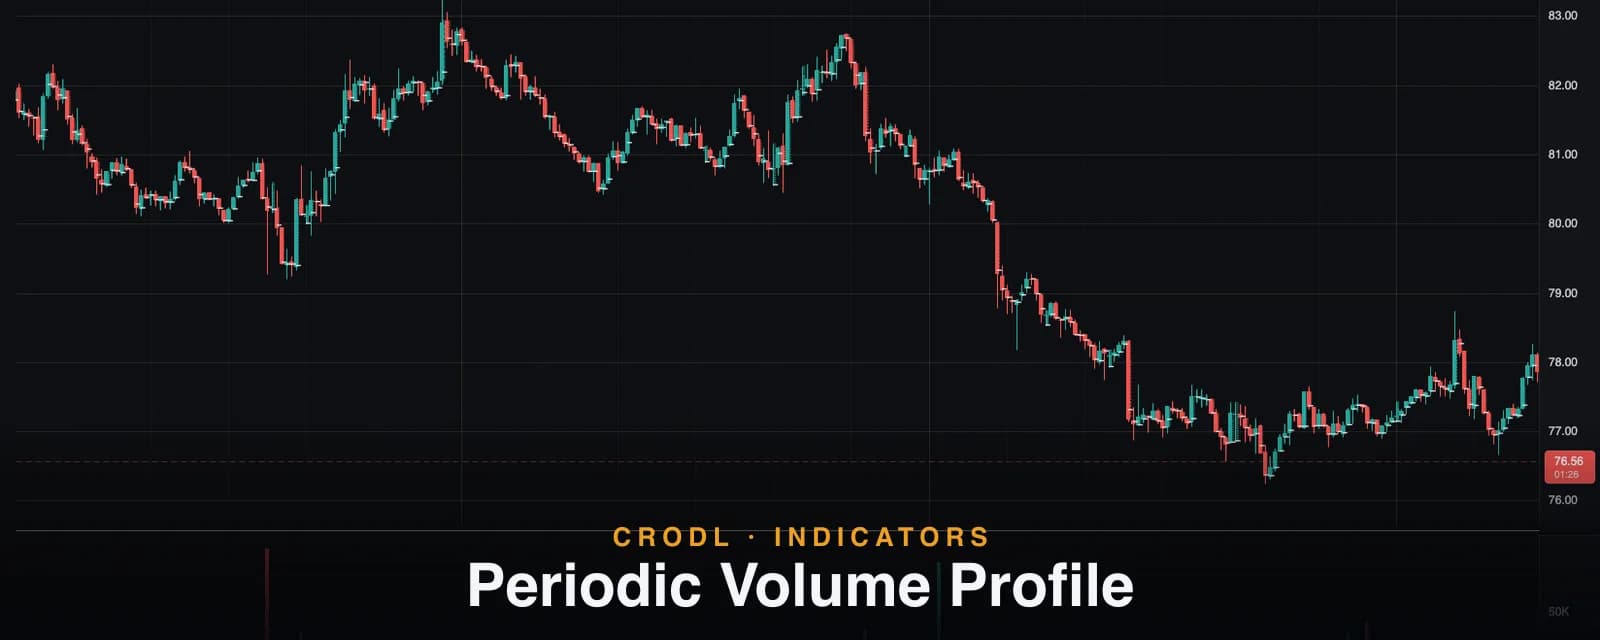
Periodic Volume Profile
Put a volume profile on every candle or session: Crodl's Periodic Volume Profile draws per-period POC and value area levels from a body-weighted estimate.
Indicators
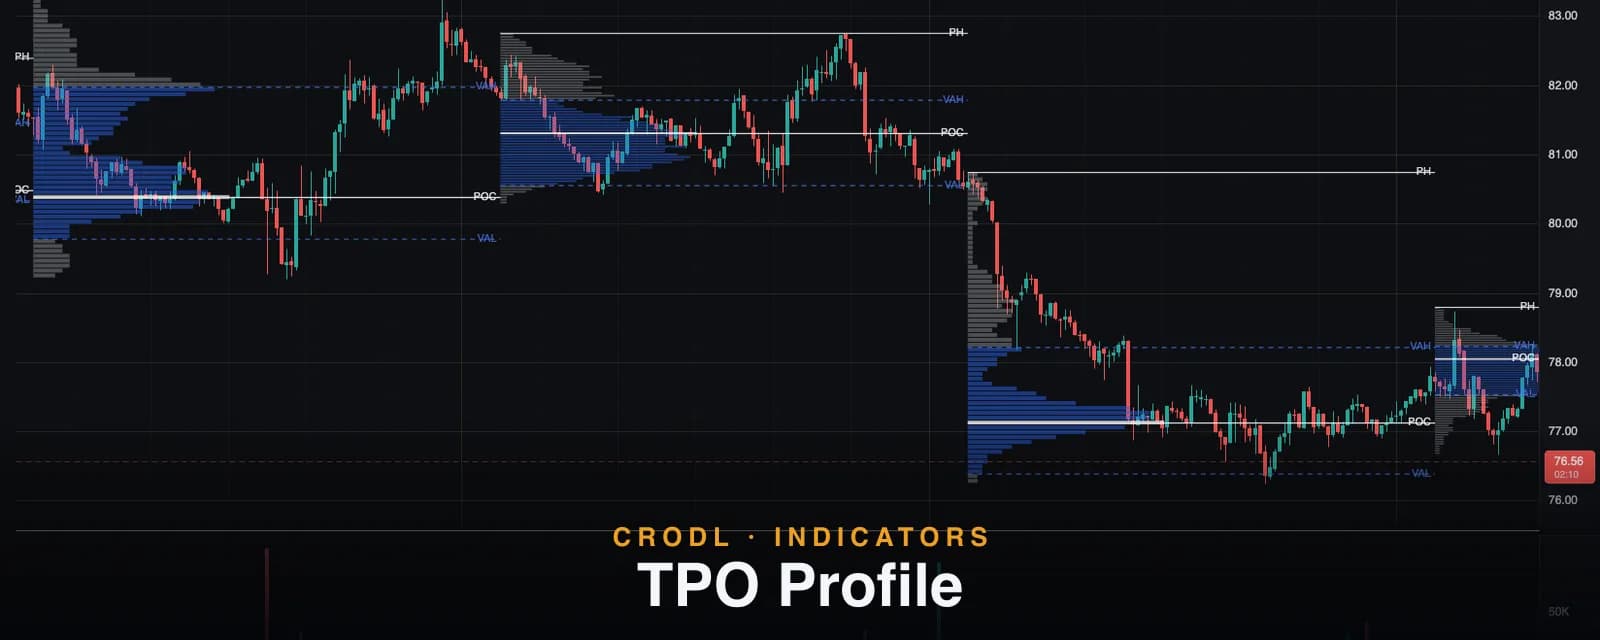
TPO Profile
Read crypto markets like a floor trader: Crodl's TPO Profile builds daily, weekly, or monthly time-at-price profiles with POC, VAH, and VAL on any chart.
Indicators
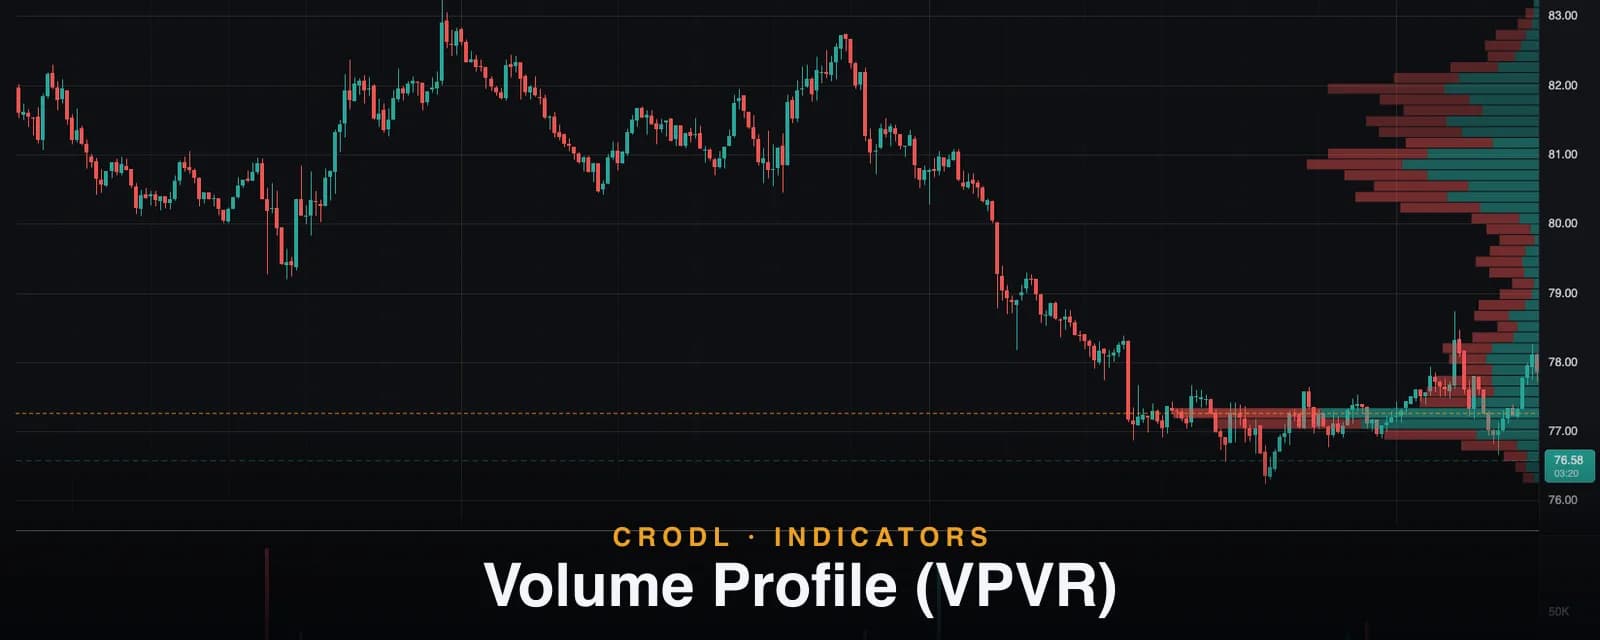
Volume Profile (VPVR)
See where crypto volume actually traded: Crodl's visible-range Volume Profile maps POC, value area, and up/down volume live as you pan and zoom the chart.
Indicators
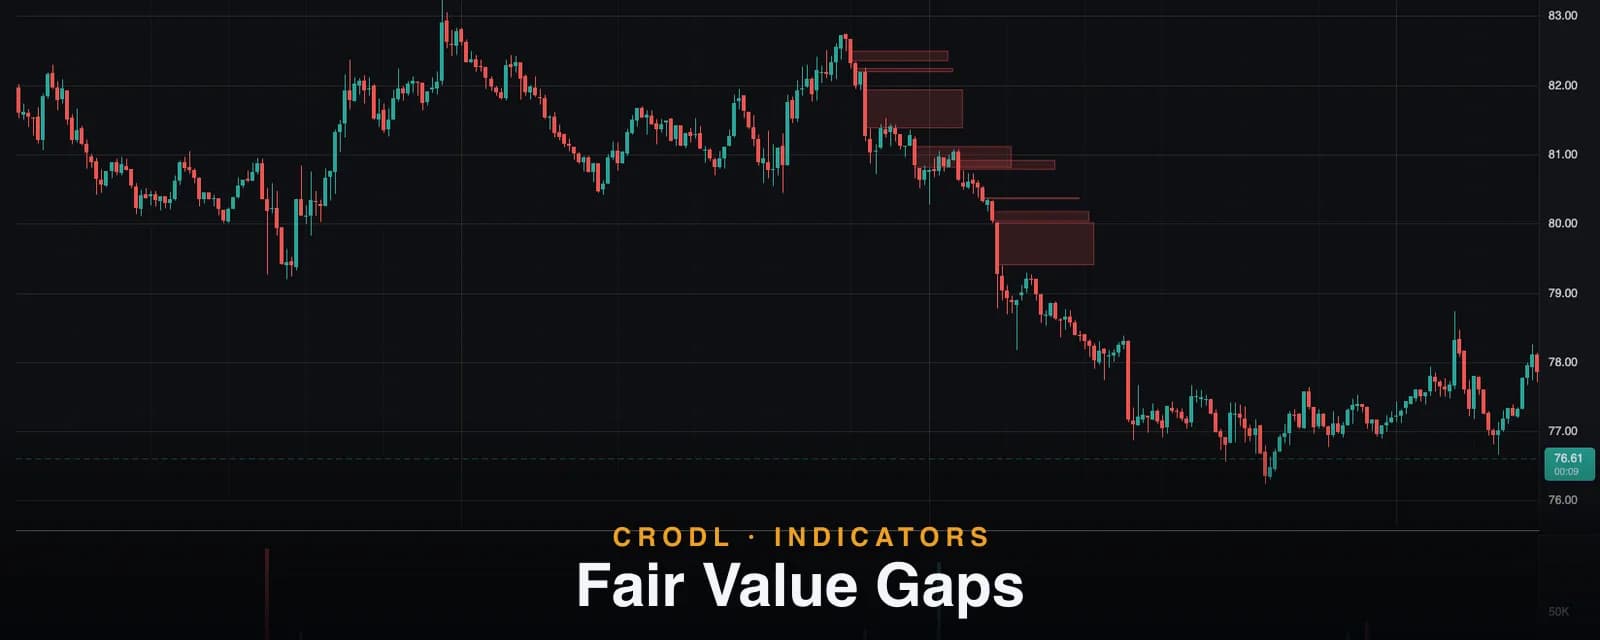
Fair Value Gaps
Fair Value Gaps mark three-candle imbalances that price tends to revisit. See how Crodl detects them, how Close vs Wick fill works, and how to trade iFVG inversions.
Indicators
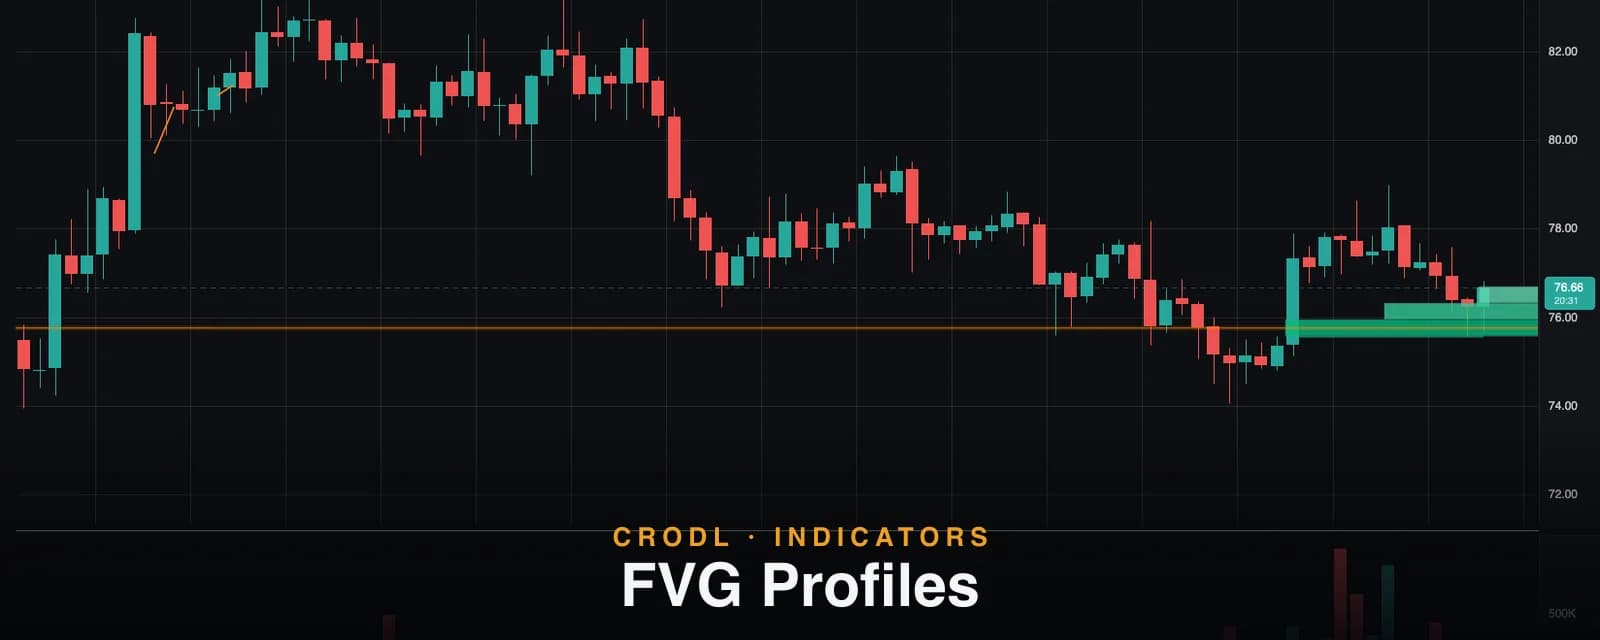
FVG Profiles
FVG Profiles filters fair value gaps by time-of-day significance, decays them by traded volume, and maps the liquidity still left inside as a KDE histogram.
Indicators
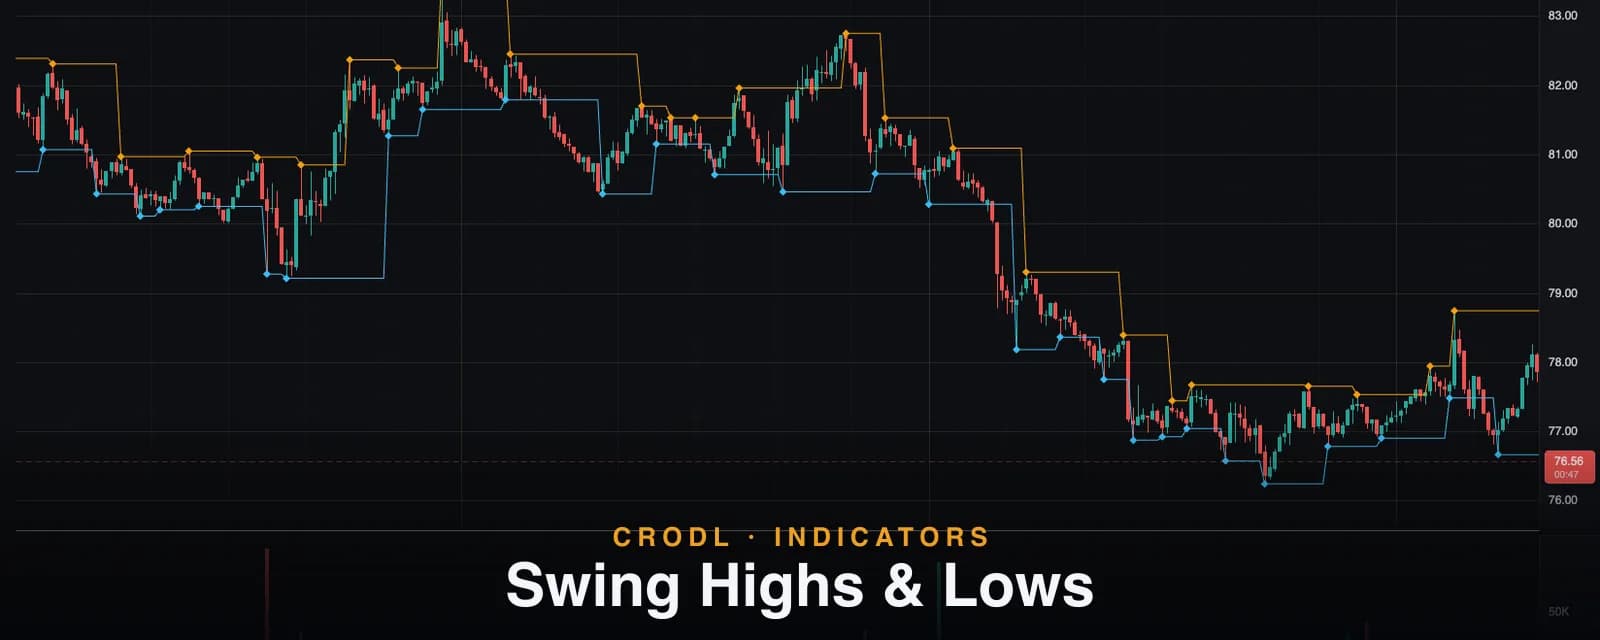
Swing Highs & Lows
Map market structure automatically: Crodl's Swing HL study marks confirmed swing highs and lows and tracks the last pivot levels for entries and stops.
Indicators
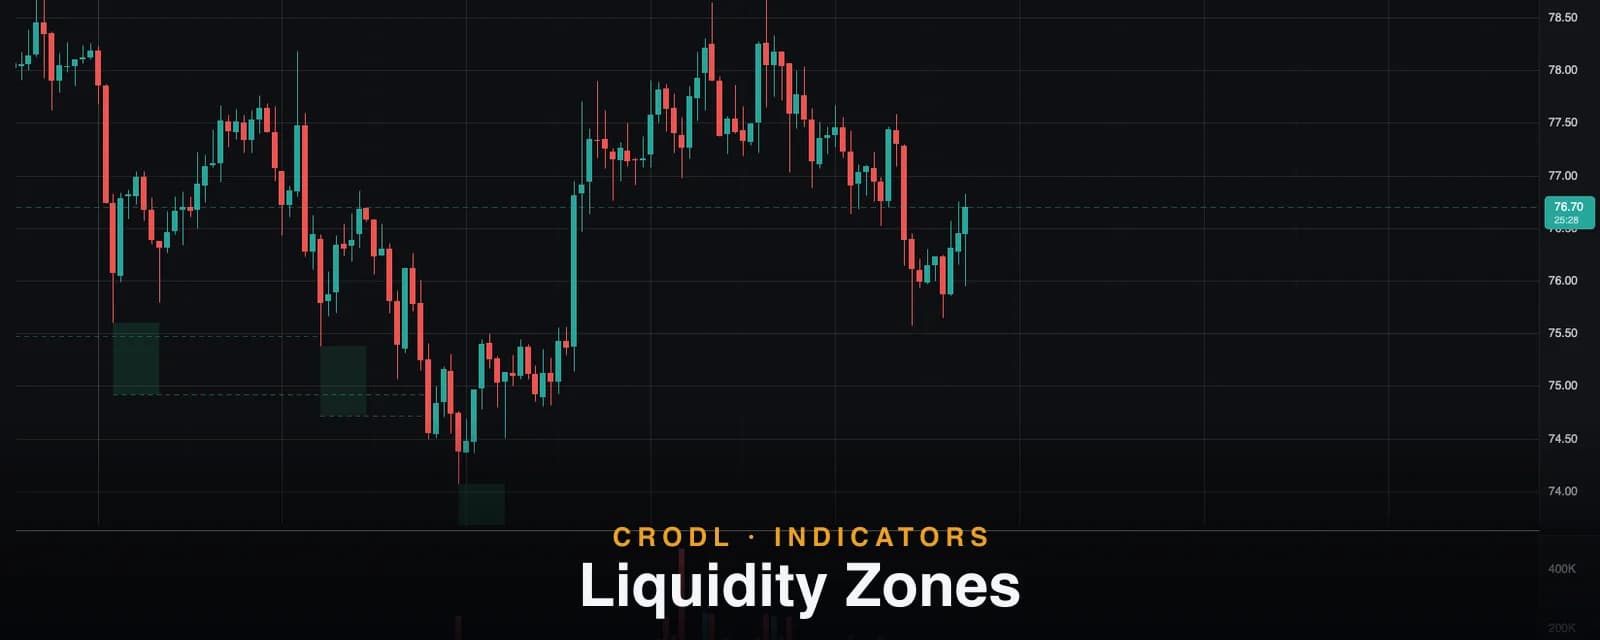
Liquidity Zones
Liquidity Zones marks high-volume swing pivots and projects the stop clusters resting above highs and below lows, tracking each level until price grabs it.
Indicators
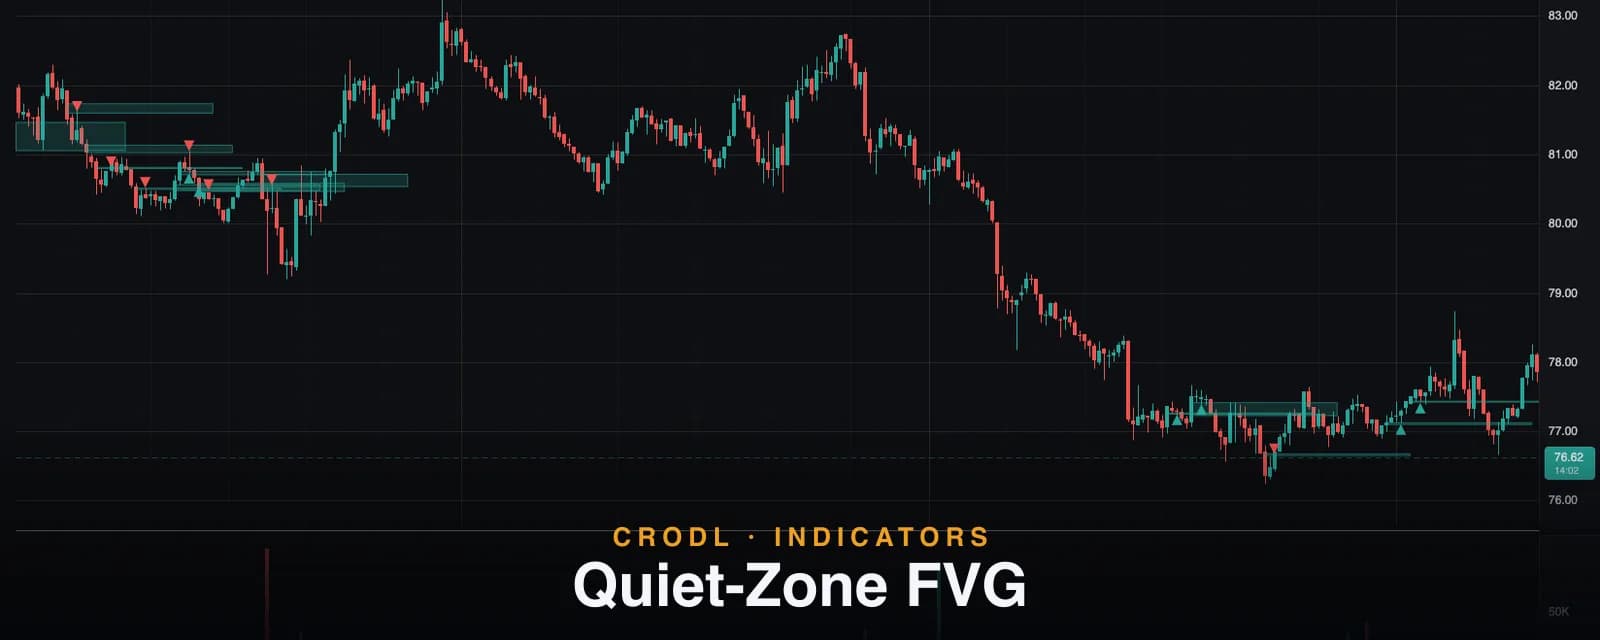
Quiet-Zone FVG
Quiet-Zone FVG surfaces fair value gaps whose first retest happens on unusually low volume — an experimental filter for the gaps most likely to hold as zones.
Indicators
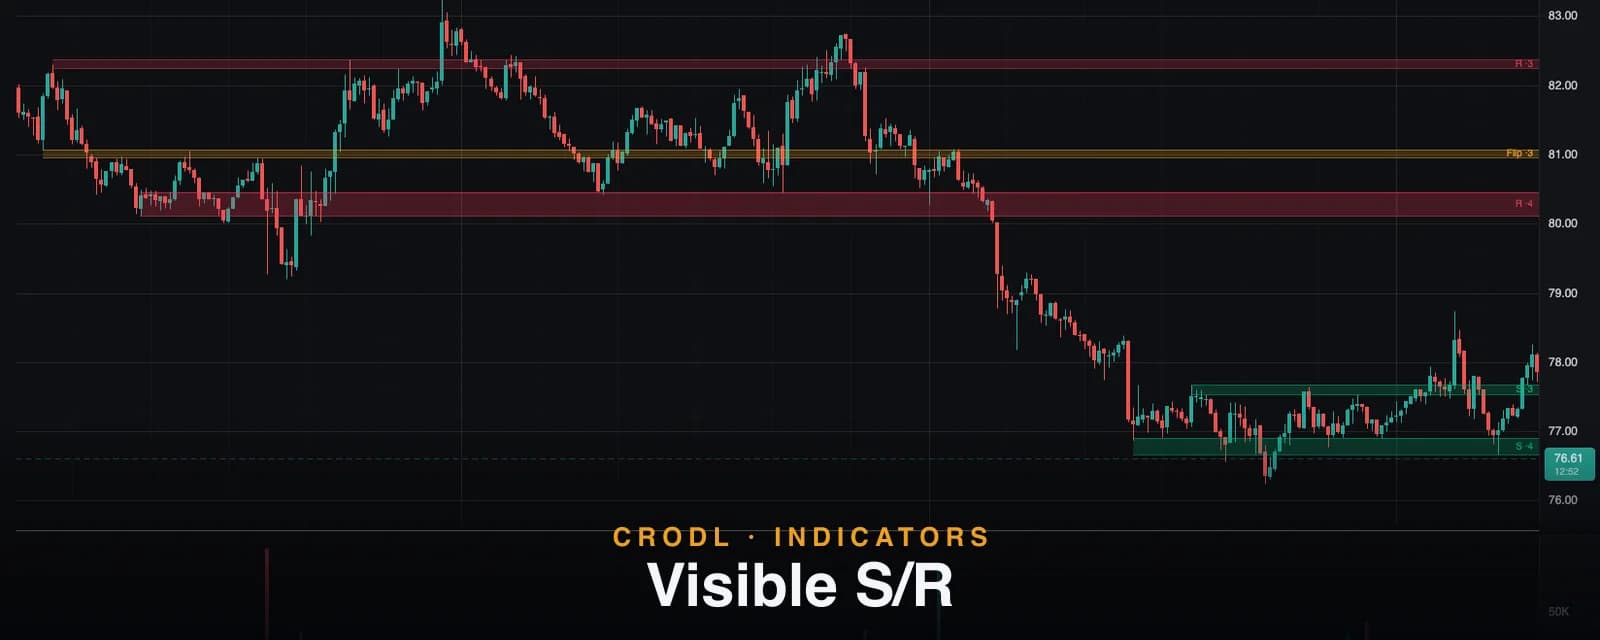
Visible S/R: Auto Support and Resistance Zones That Update as You Pan
How Crodl's Visible S/R indicator turns the swing pivots in your visible chart range into support, resistance and flip zones — recomputed live as you pan and zoom.
Indicators
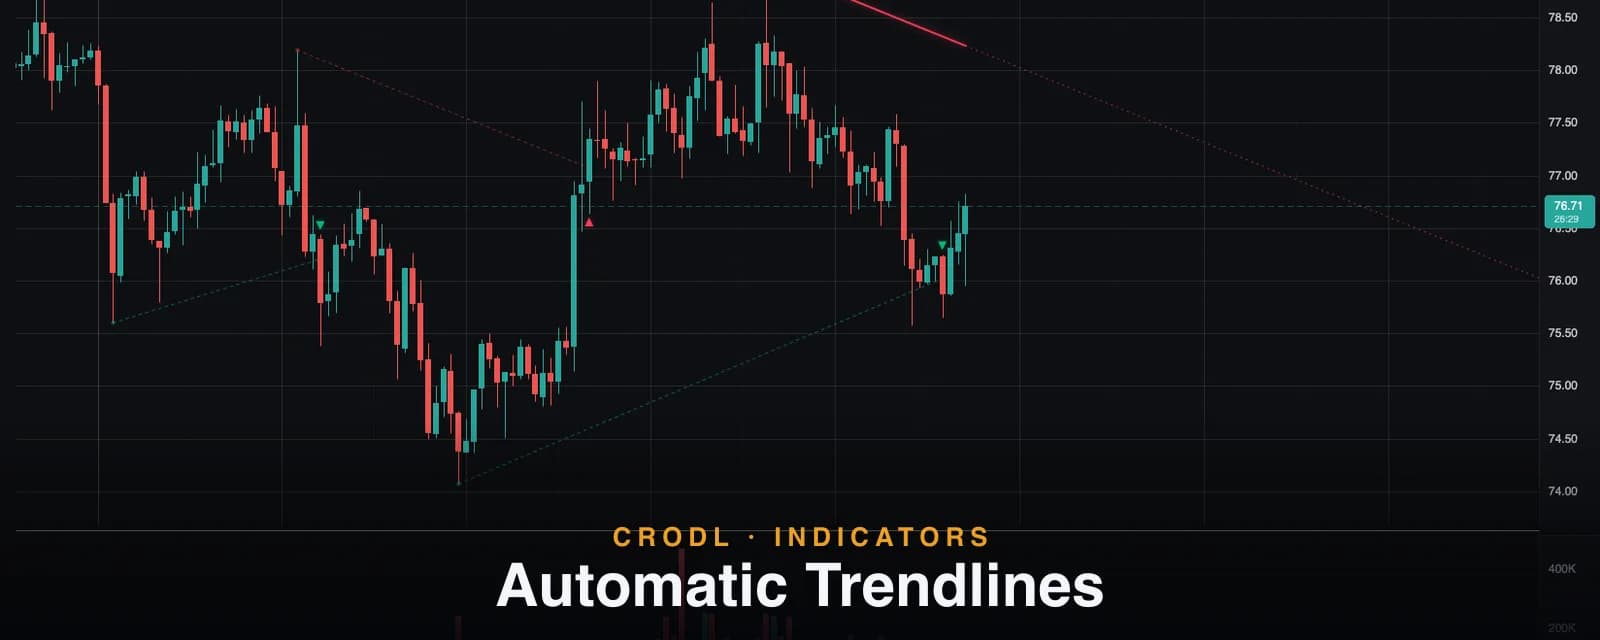
Automatic Trendlines: Swing-Pivot Trendlines with Breakout Markers
How Crodl's Trendlines indicator anchors sloped support and resistance to confirmed swing pivots, sets the slope from ATR or Stdev, and marks every breakout close.
Indicators
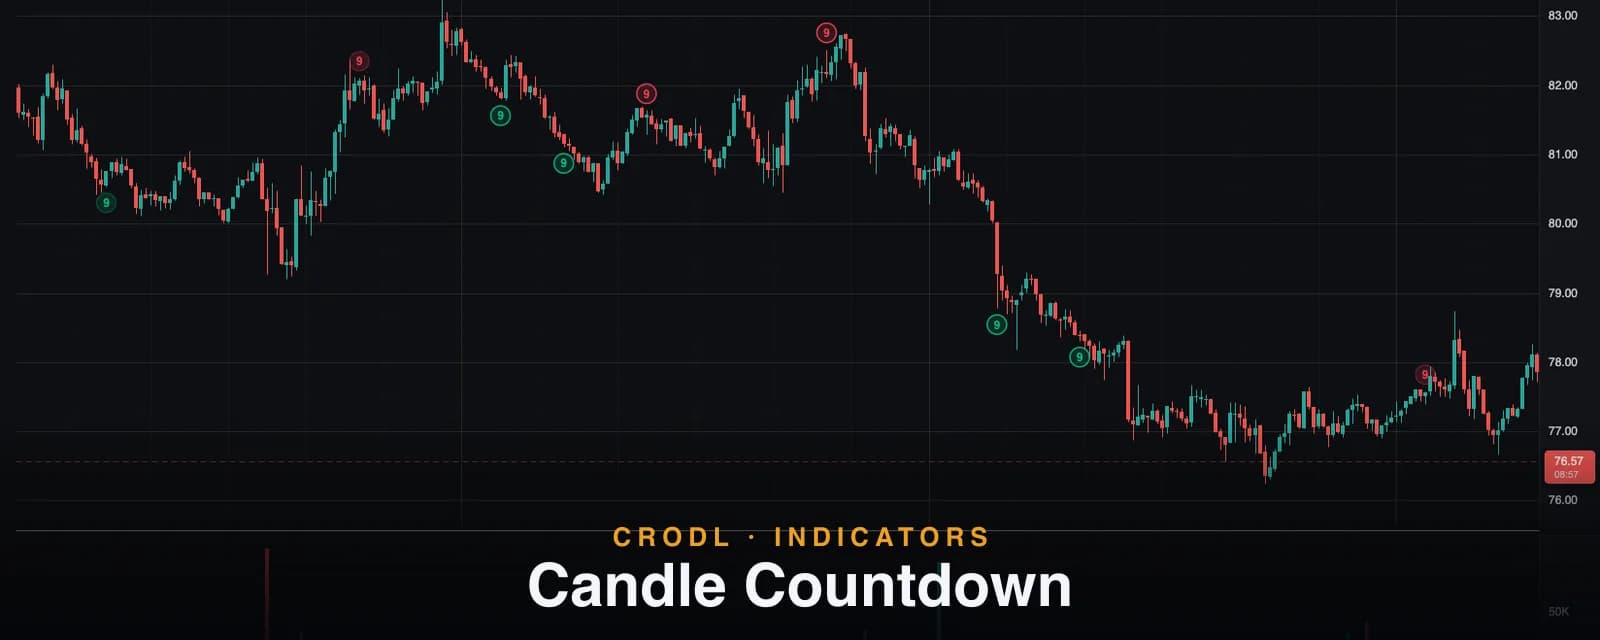
Candle Countdown: TD-Sequential-Style 9-Counts for Trend Exhaustion
How Crodl's Candle Countdown indicator counts TD-Sequential-style buy and sell setups from 1 to 9, flags perfected 9s, and helps you time exhaustion in trends.
Indicators
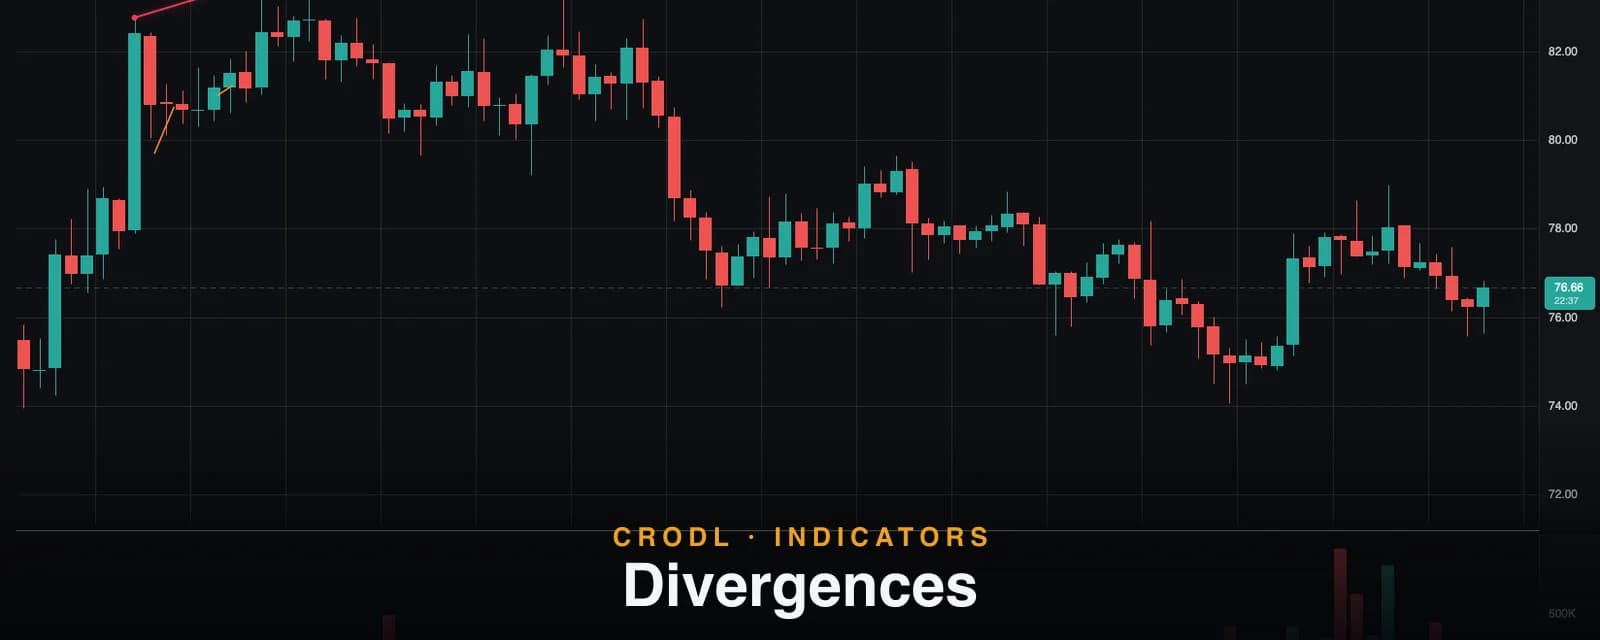
Divergences: Auto-Detected RSI, MACD and OBV Divergences on Your Chart
How Crodl's Divergences indicator finds regular and hidden RSI, MACD and OBV divergences between confirmed swing pivots and draws them pivot-to-pivot on price.
Indicators
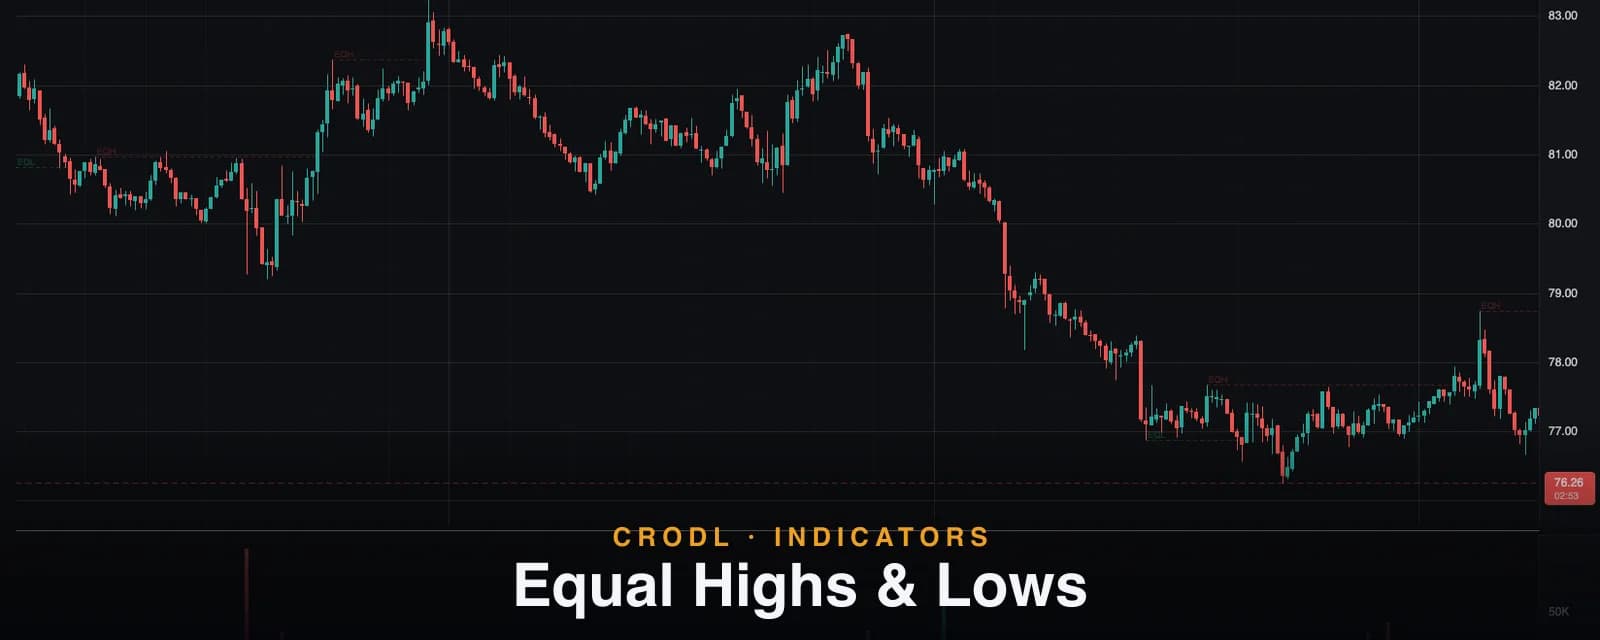
Equal Highs & Lows
Equal highs and lows mark clustered stop-loss liquidity. How Crodl groups swing pivots into EQH and EQL pools with an ATR tolerance, and flags sweeps versus purges.
Indicators
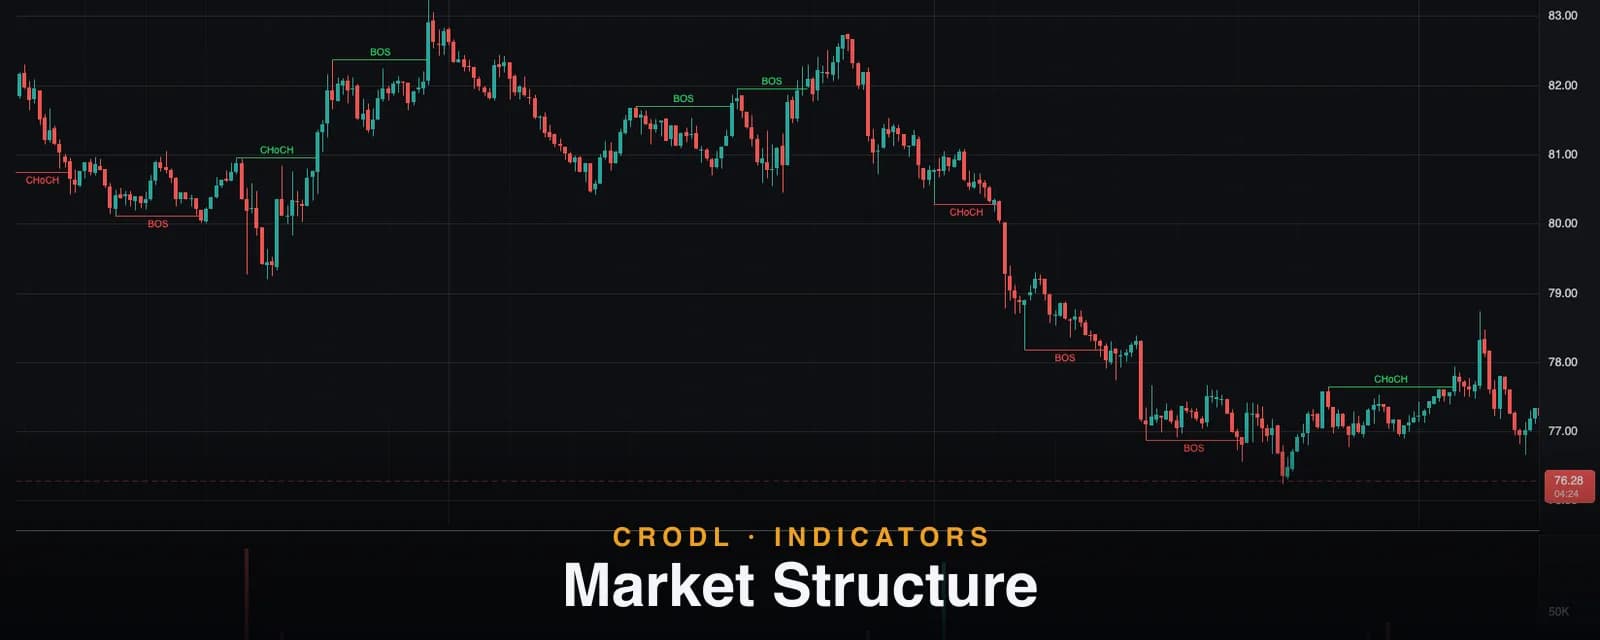
Market Structure
BOS and CHoCH tags drawn automatically from confirmed swing pivots. How Crodl's Market Structure indicator tracks trend objectively, and how traders trade the breaks.
Indicators
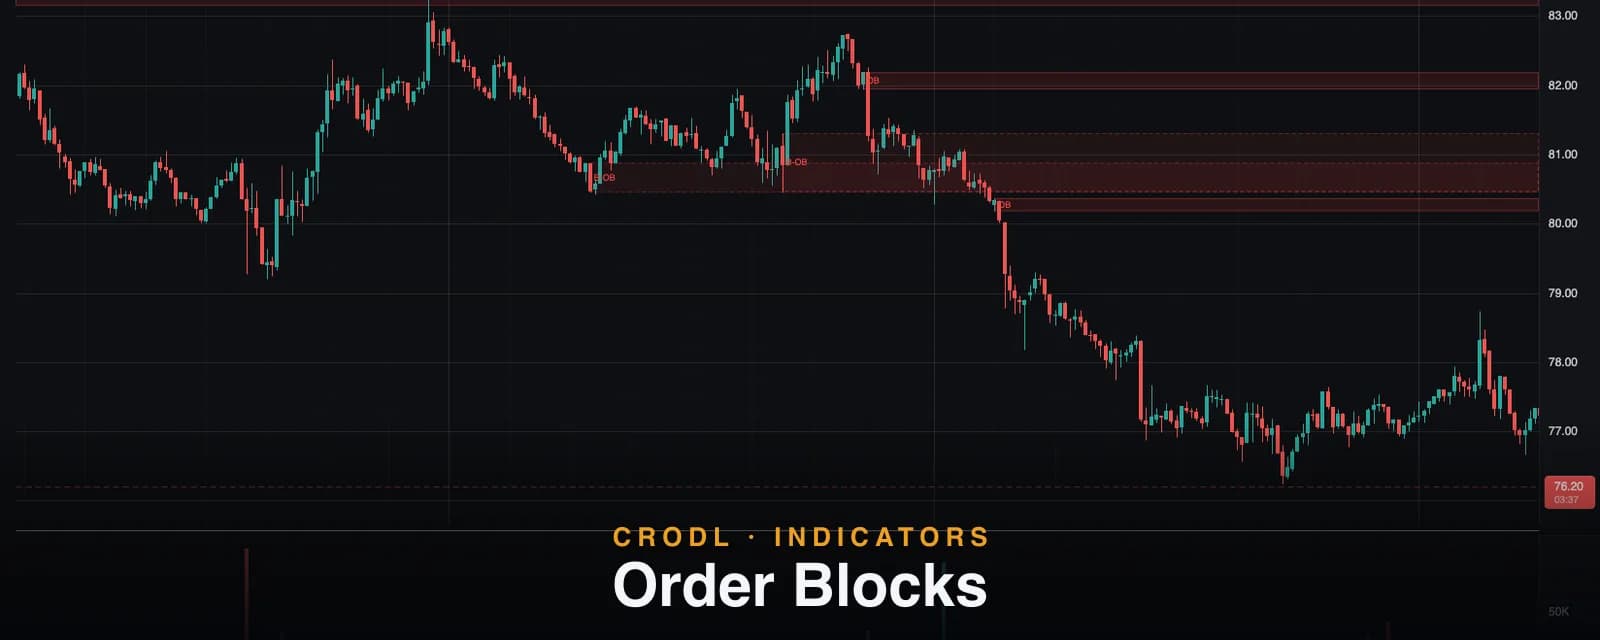
Order Blocks
The last opposite candle before a displacement move marks where size was filled. How Crodl detects order blocks with an ATR filter and flips broken zones into breakers.
Indicators
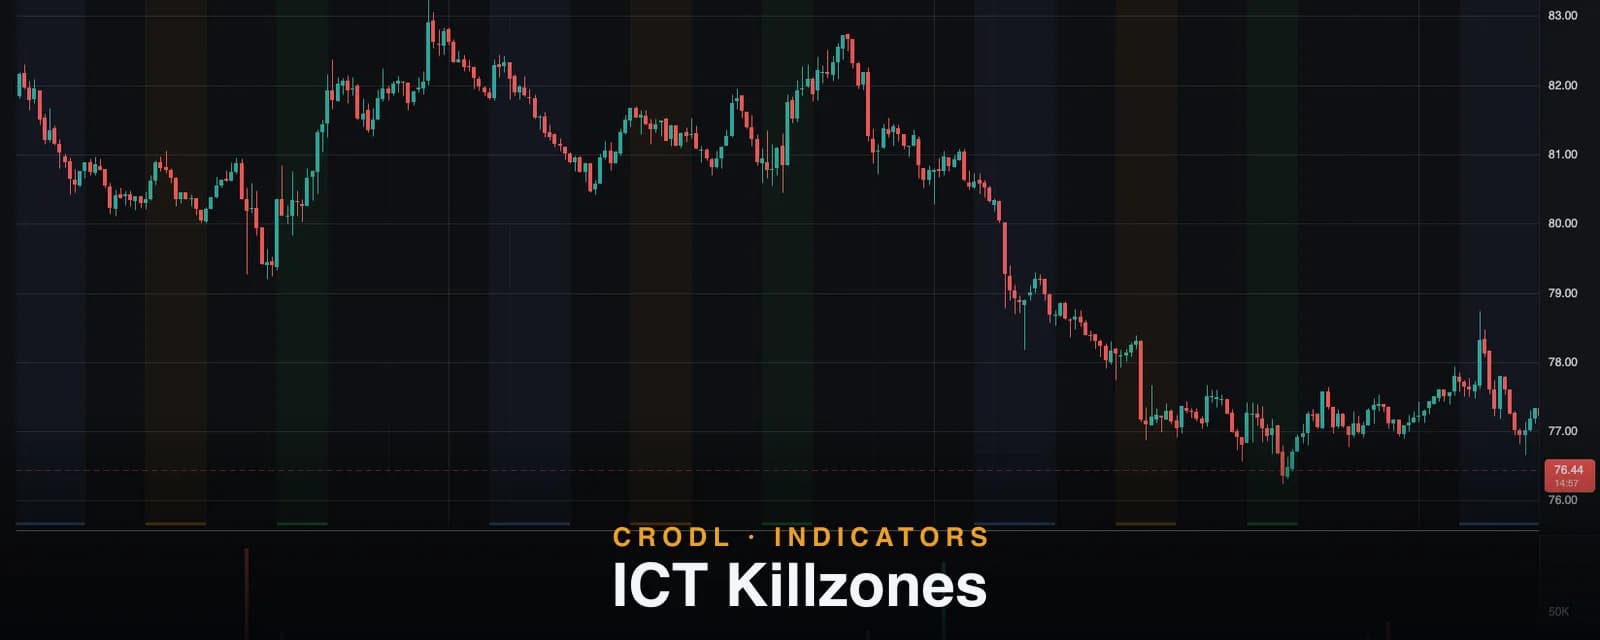
ICT Killzones
Asia, London and New York killzones drawn as session bands on any crypto chart. How Crodl computes ICT killzones in UTC and how to tune the windows to your market.
Indicators
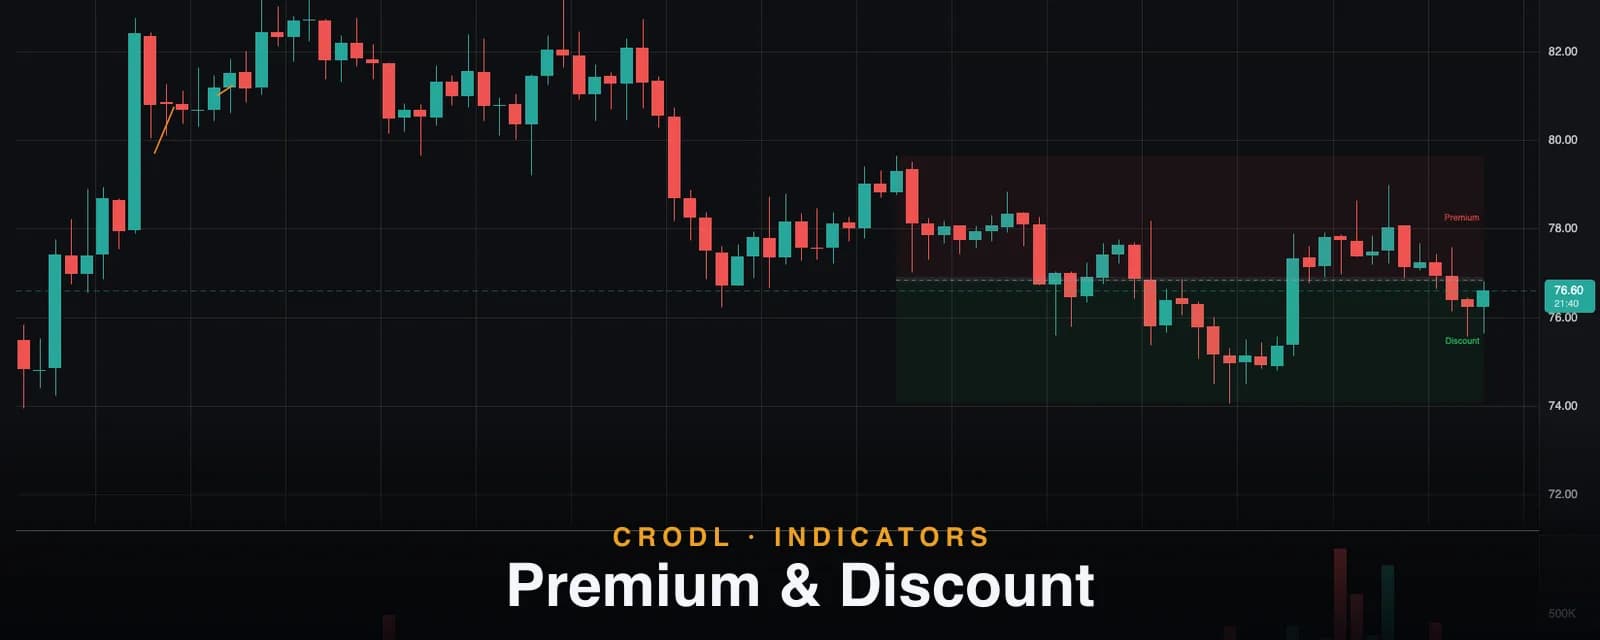
Premium & Discount
Premium and discount zones split the dealing range at equilibrium. How Crodl anchors the range to confirmed swing pivots and draws the 50% band and optional OTE zone.
Indicators
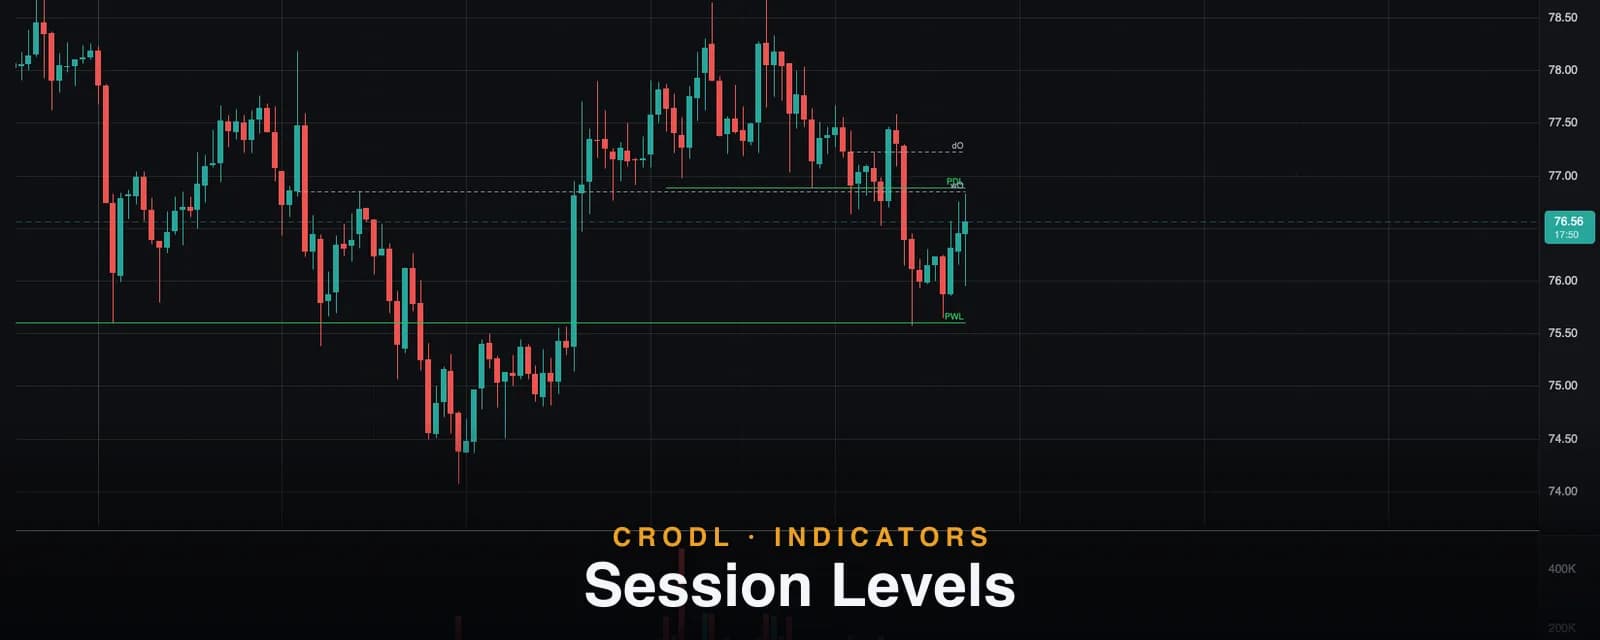
Session Levels
PDH, PDL, PWH, PWL, the opt-in PMH/PML and the day, week and month opens — the ICT daily-bias level set. How Crodl computes each level in UTC and how traders frame bias around them.
Indicators
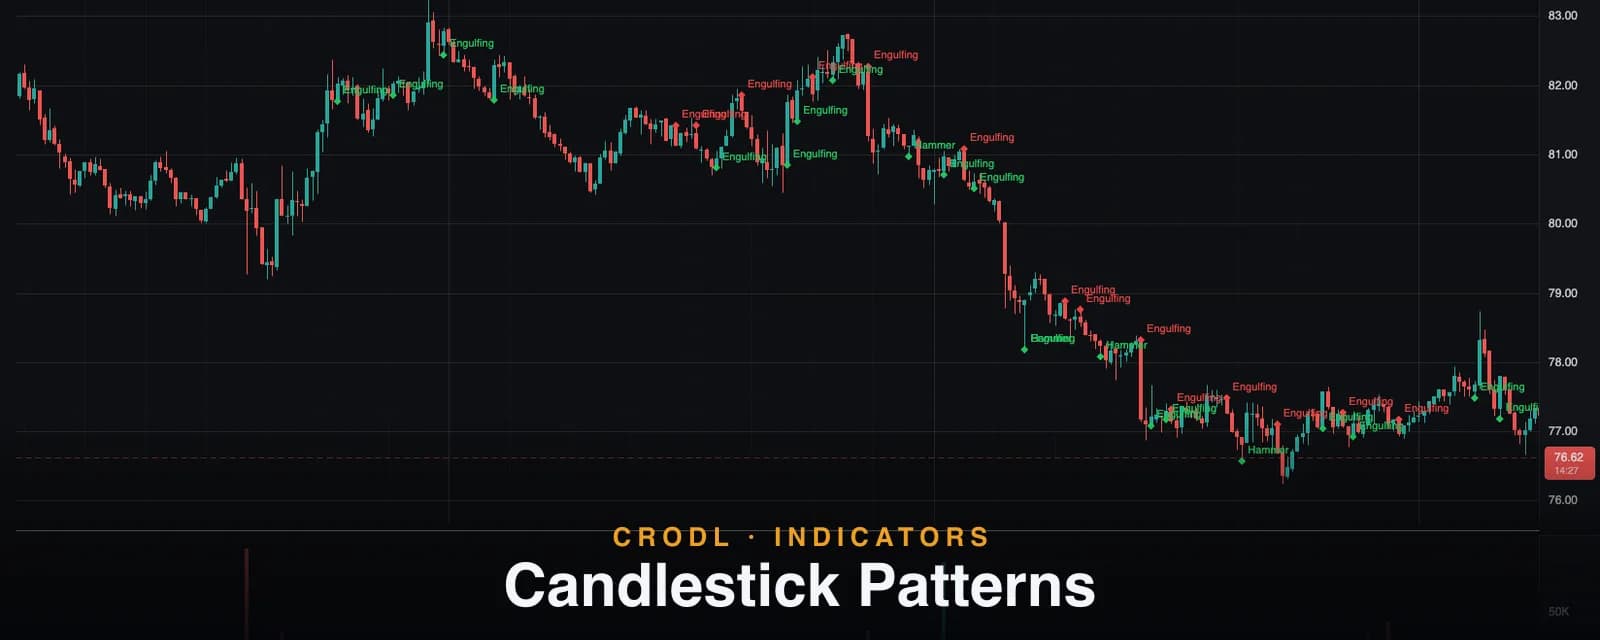
Candlestick Patterns: 46 Auto-Detected Formations on the Crodl Chart
Crodl's Candlestick Patterns study scans closed candles for 46 classic formations — doji, engulfing, morning star, three white soldiers and more — and marks each one.
Indicators
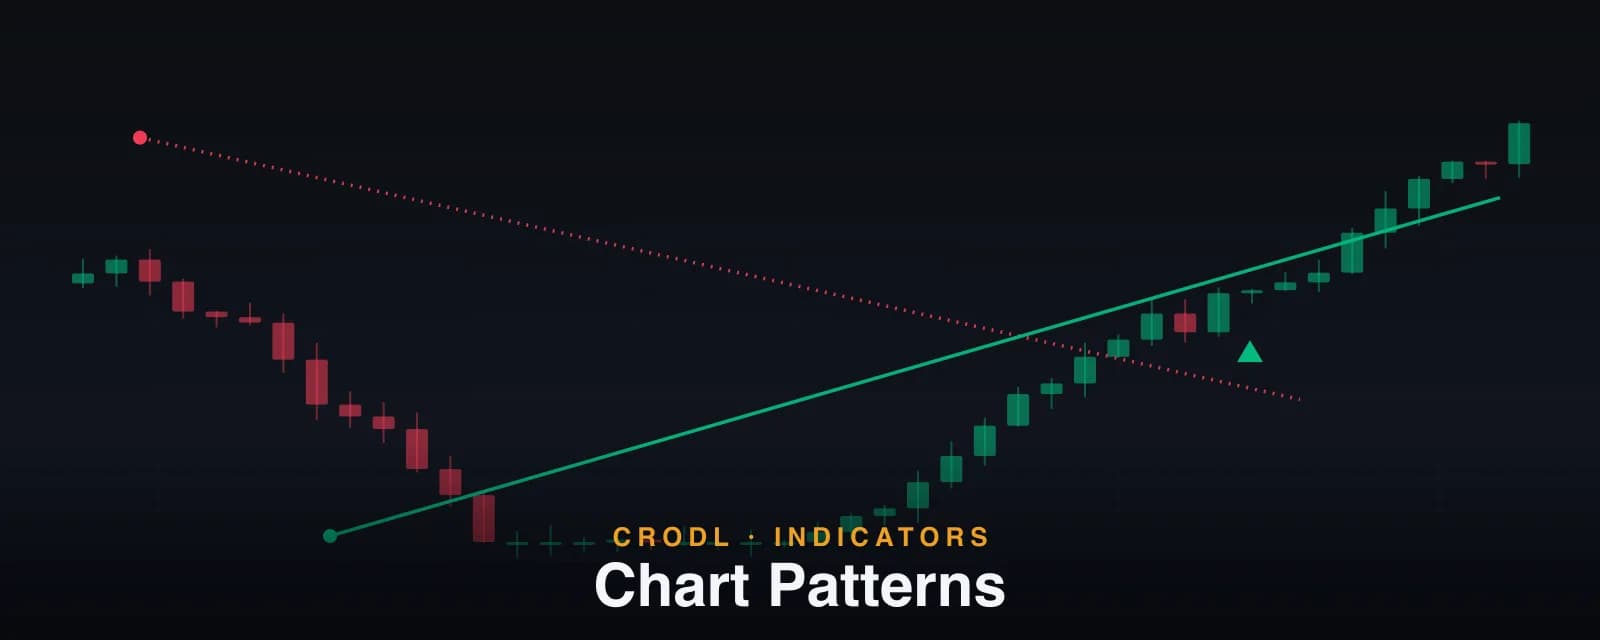
Chart Patterns: Automatic Double Top, Double Bottom and Rectangle Detection
How Crodl's Chart Patterns study finds double and triple tops and bottoms plus rectangles from swing pivots, with ATR-scaled tolerance and breakout confirmation.
Indicators
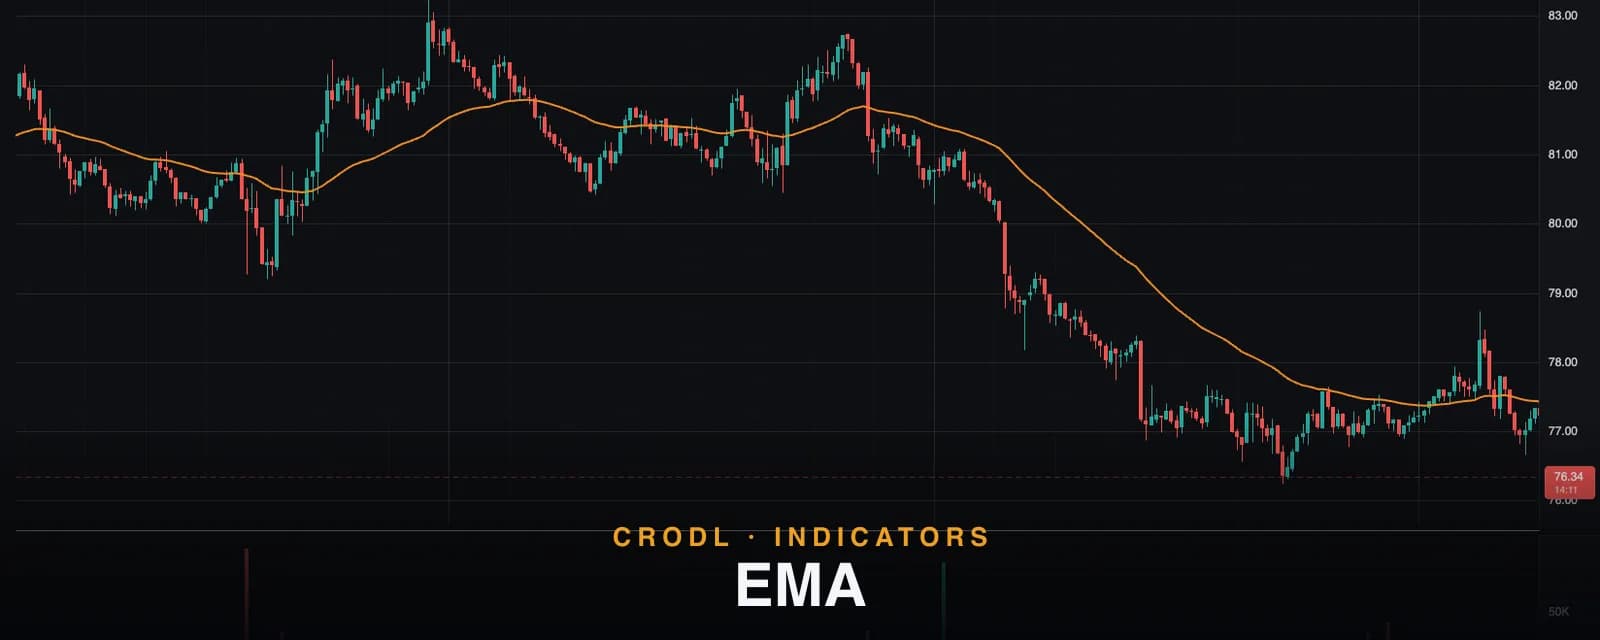
EMA
The exponential moving average is the most-watched trend line in crypto. How Crodl's EMA indicator works, its six smoothing modes, and how traders build multi-EMA stacks.
Indicators
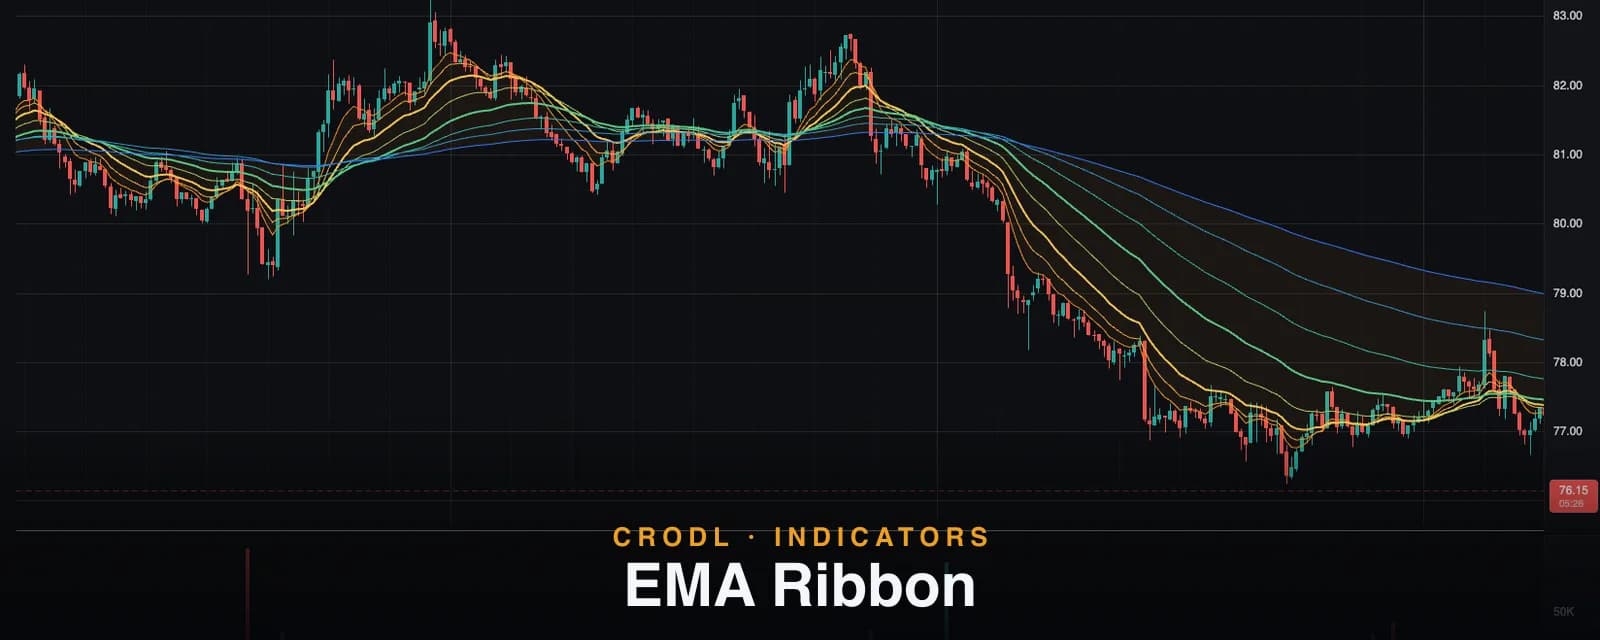
EMA Ribbon
Eight Fibonacci-spaced EMAs from 8 to 233 painted as one warm-to-cool ribbon. How Crodl's EMA Ribbon works and how traders read expansion, compression, and order.
Indicators
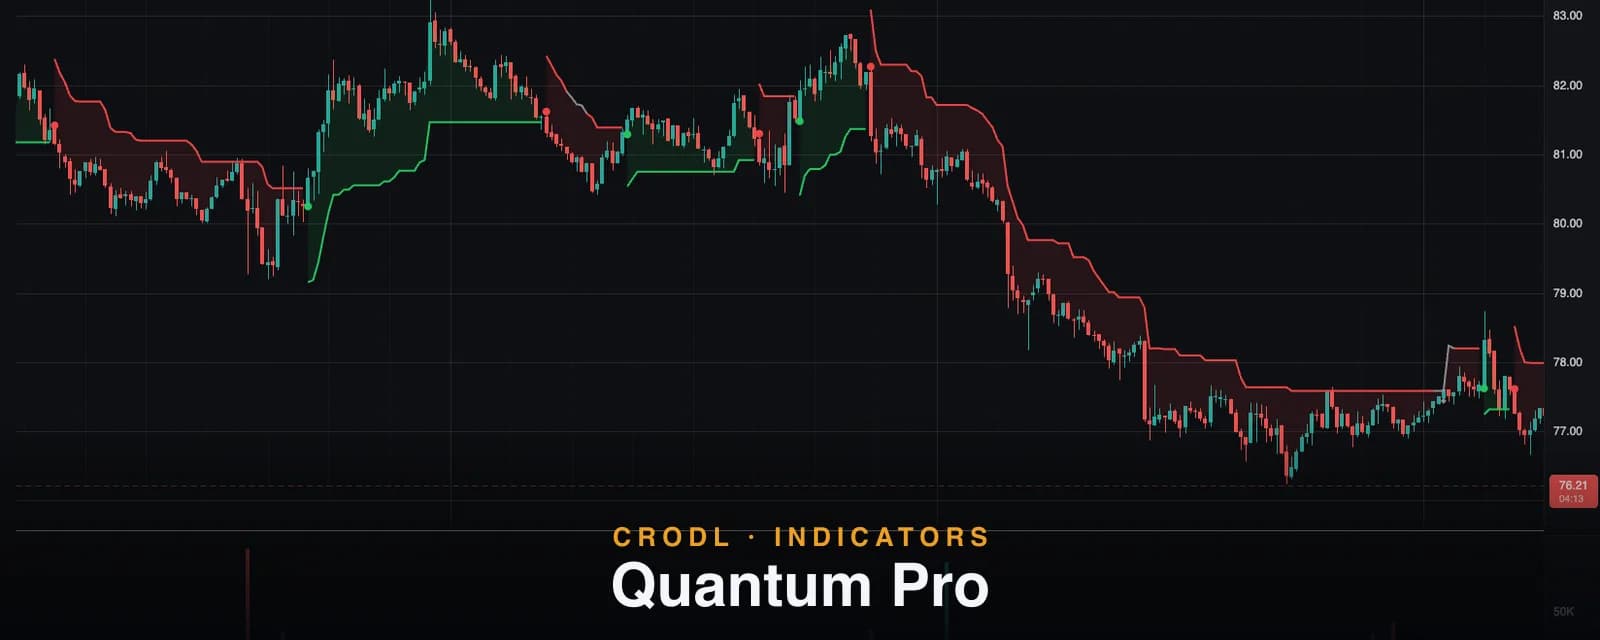
Quantum Pro
A CRODL original: an adaptive Supertrend-style band with a volatility-regime filter that blocks flips in chop. How Quantum Pro works and how to trade its signals.
Indicators
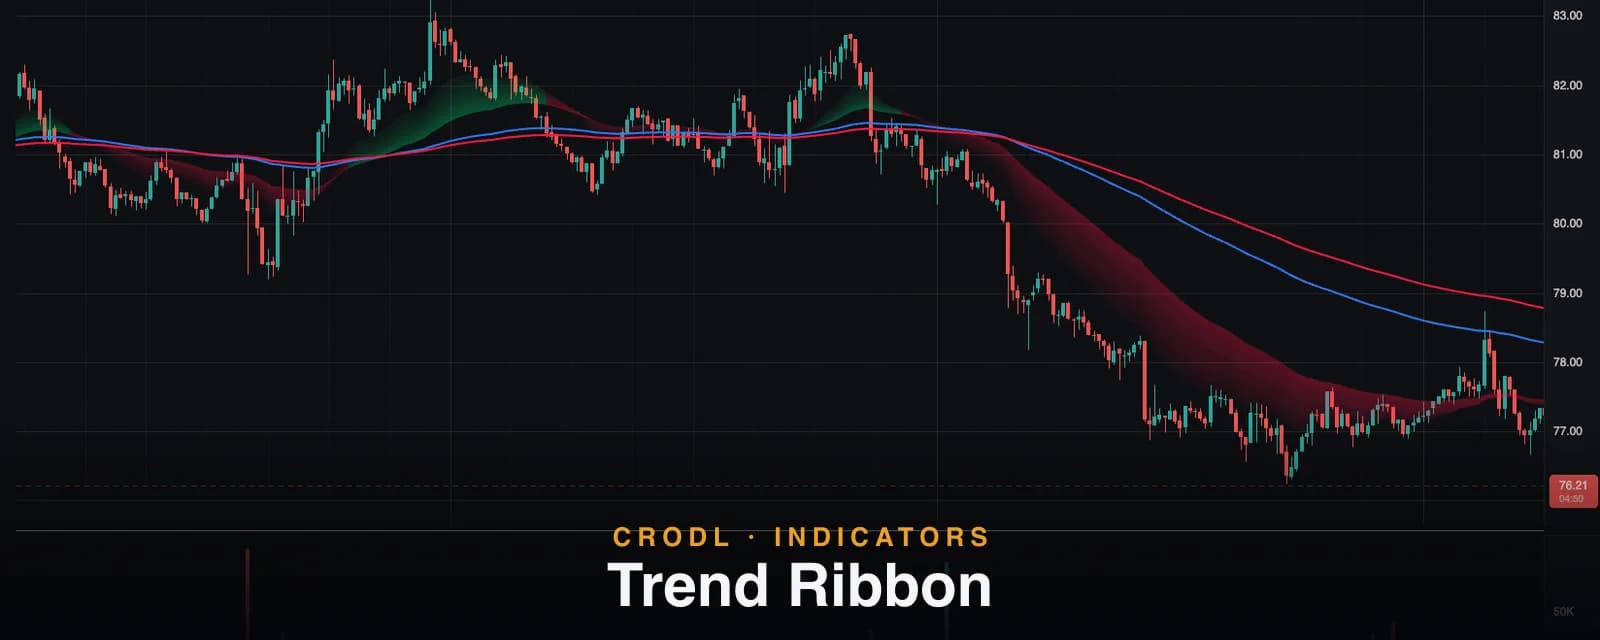
Trend Ribbon
Eight stacked EMAs from 20 to 55 that paint green only on full alignment, plus EMA 140/200 anchors. How Crodl's Trend Ribbon defines a trend and when to trust it.
Indicators
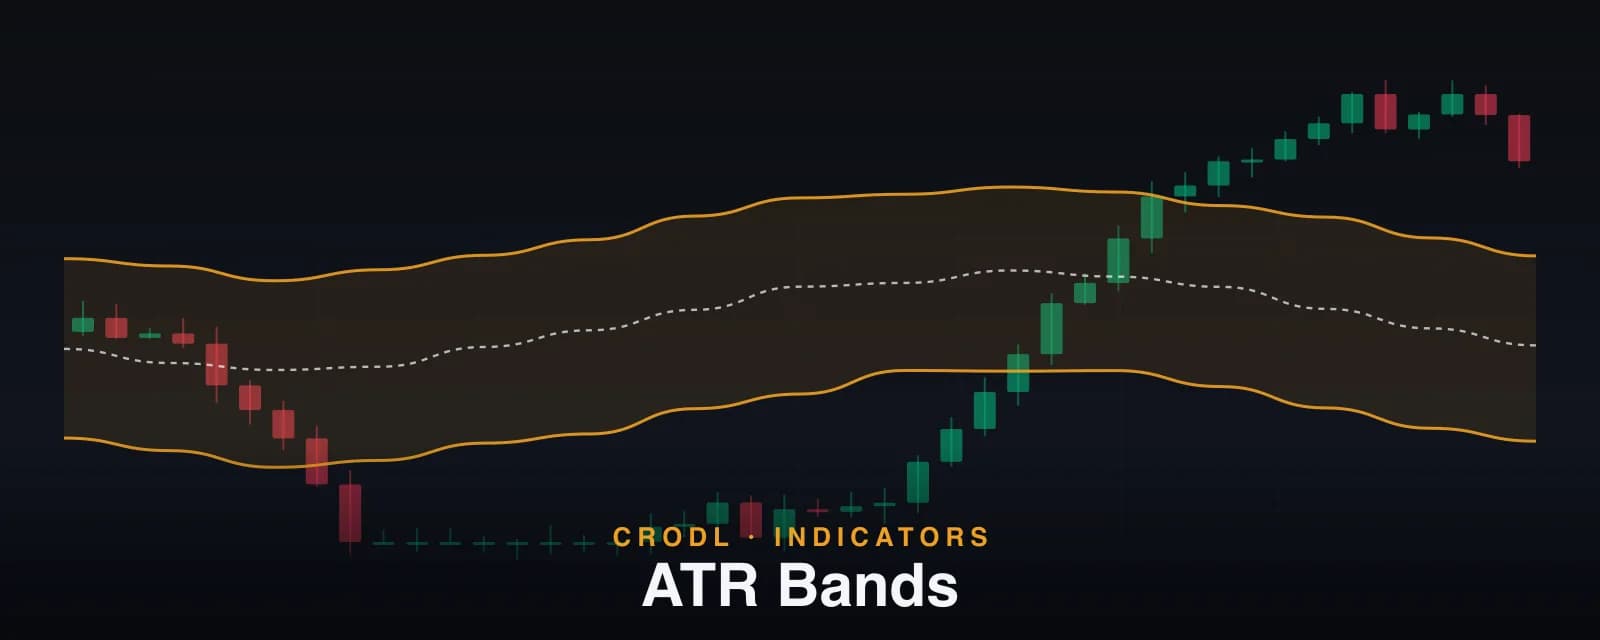
ATR Bands
ATR Bands wrap a double-smoothed EMA in Wilder ATR envelopes, with half, quarter, and phi tiers inside the 2.618 outer bands. How it works and how traders use it.
Indicators
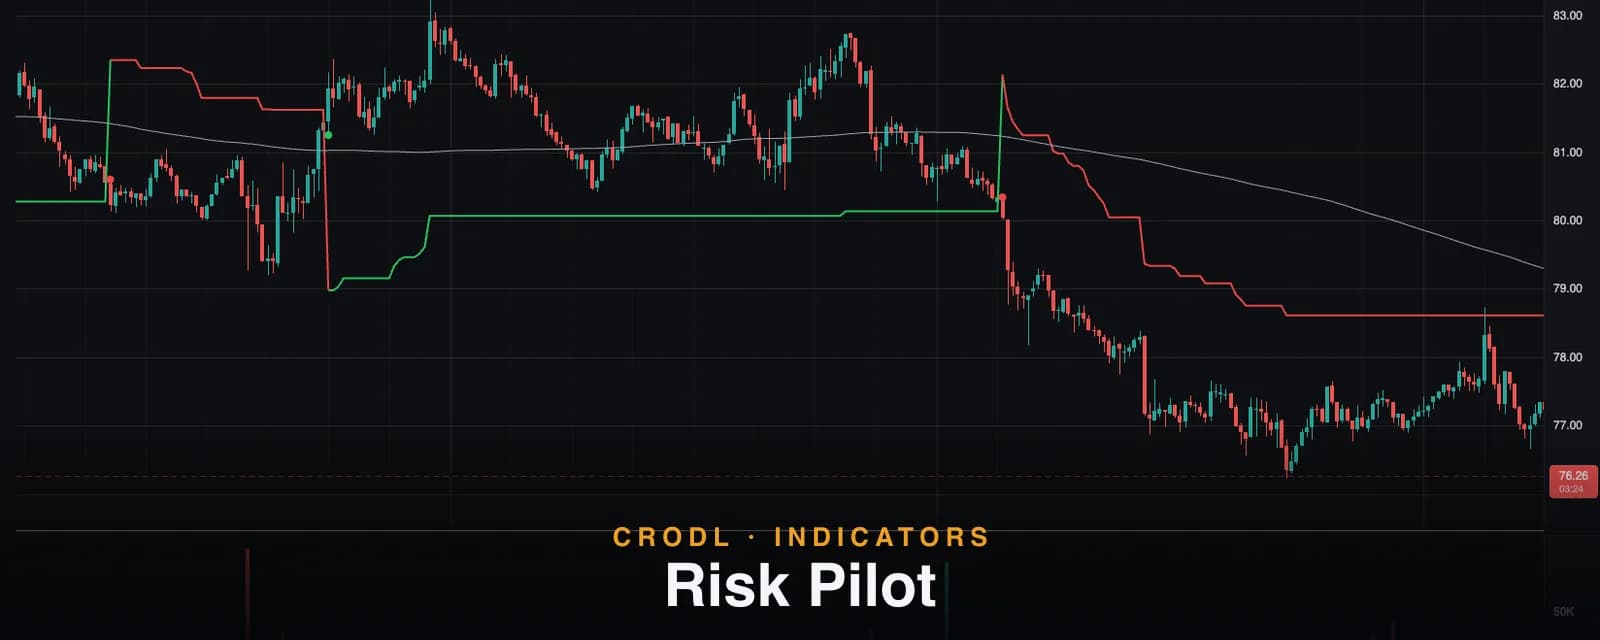
Risk Pilot
A CRODL original: UT-Bot-style ATR trailing stop crosses filtered by a trend SMA, with strict long/short alternation. How Risk Pilot works and how to trade it.
Indicators
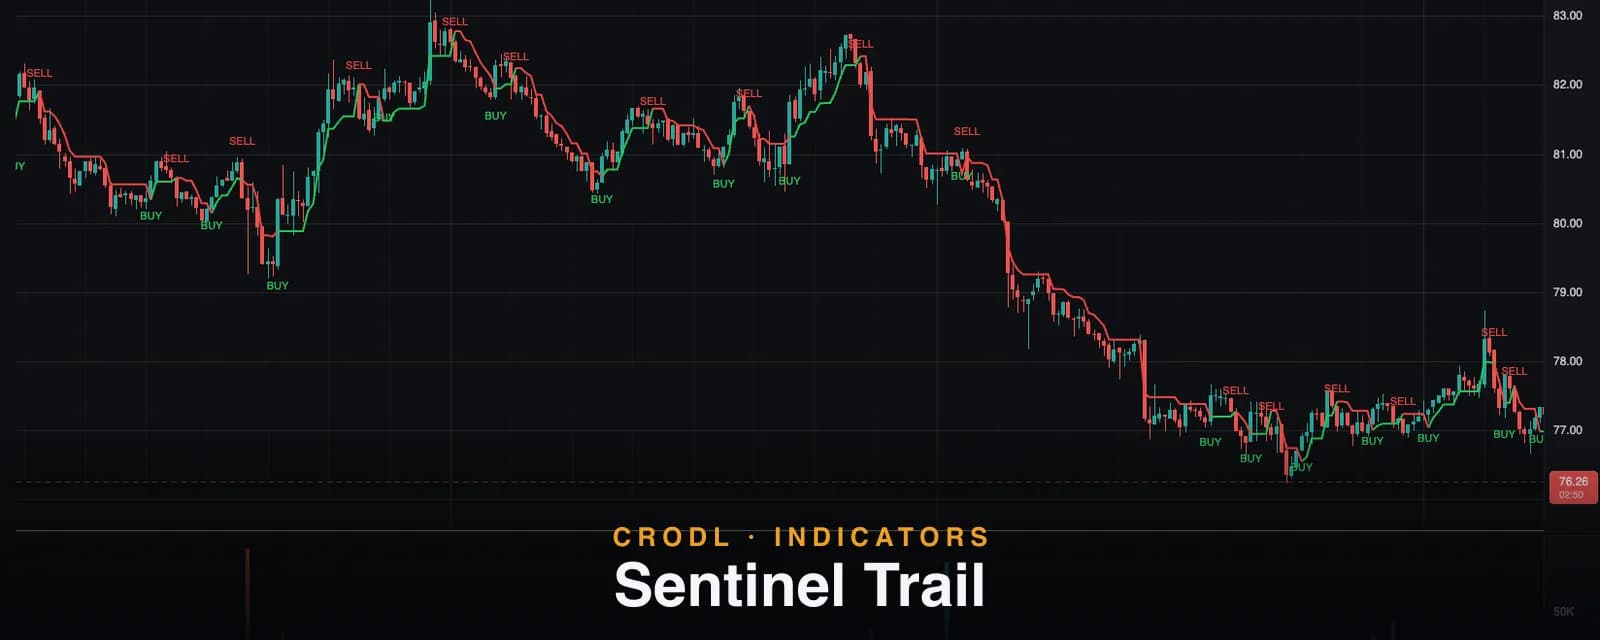
Sentinel Trail
A CRODL take on the classic UT Bot: an ATR trailing stop that ratchets behind price and flips with it, colored by regime. How Sentinel Trail works on the terminal.
Indicators
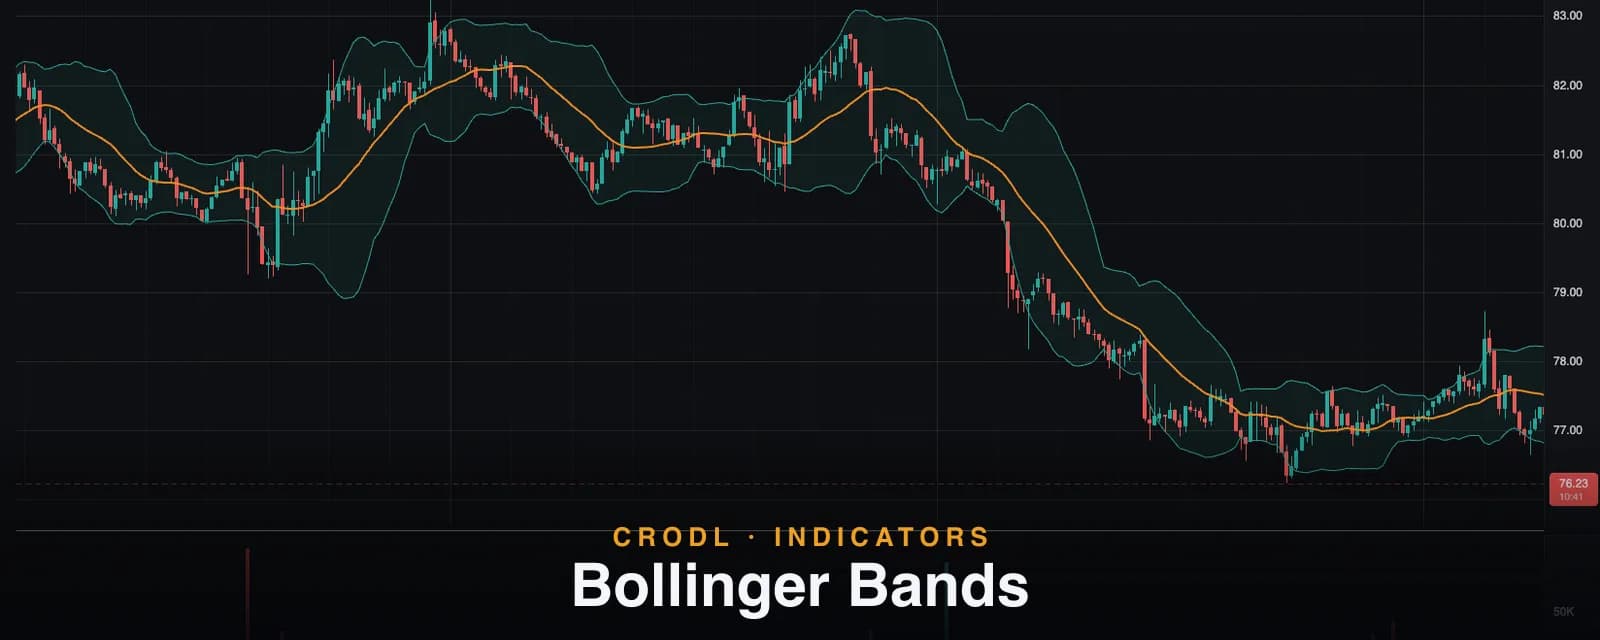
Bollinger Bands
Bollinger Bands wrap a 20-period SMA in bands two standard deviations wide, breathing with volatility. How the Crodl preset works and how traders actually read it.
Indicators
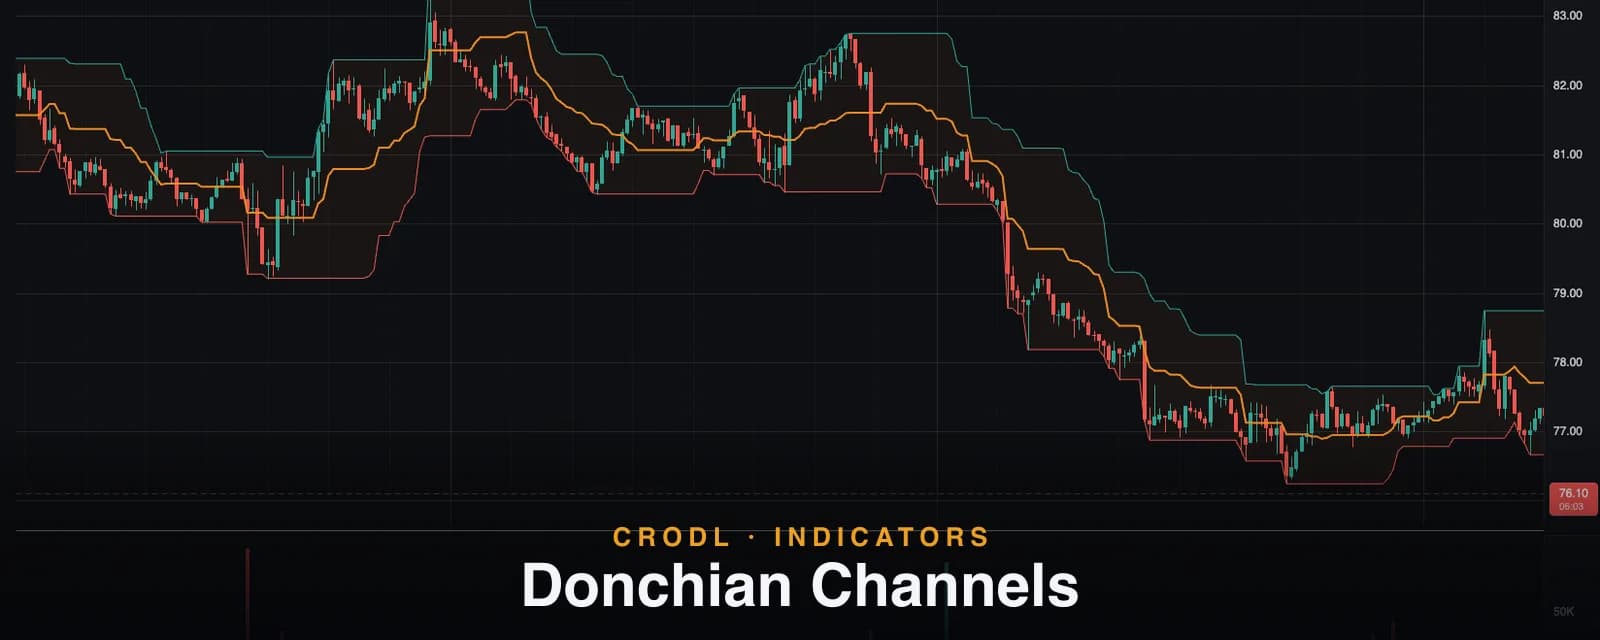
Donchian Channels
Donchian Channels track the highest high and lowest low of the last 20 bars — the classic turtle breakout channel. How the Crodl preset works and how traders use it.
Indicators
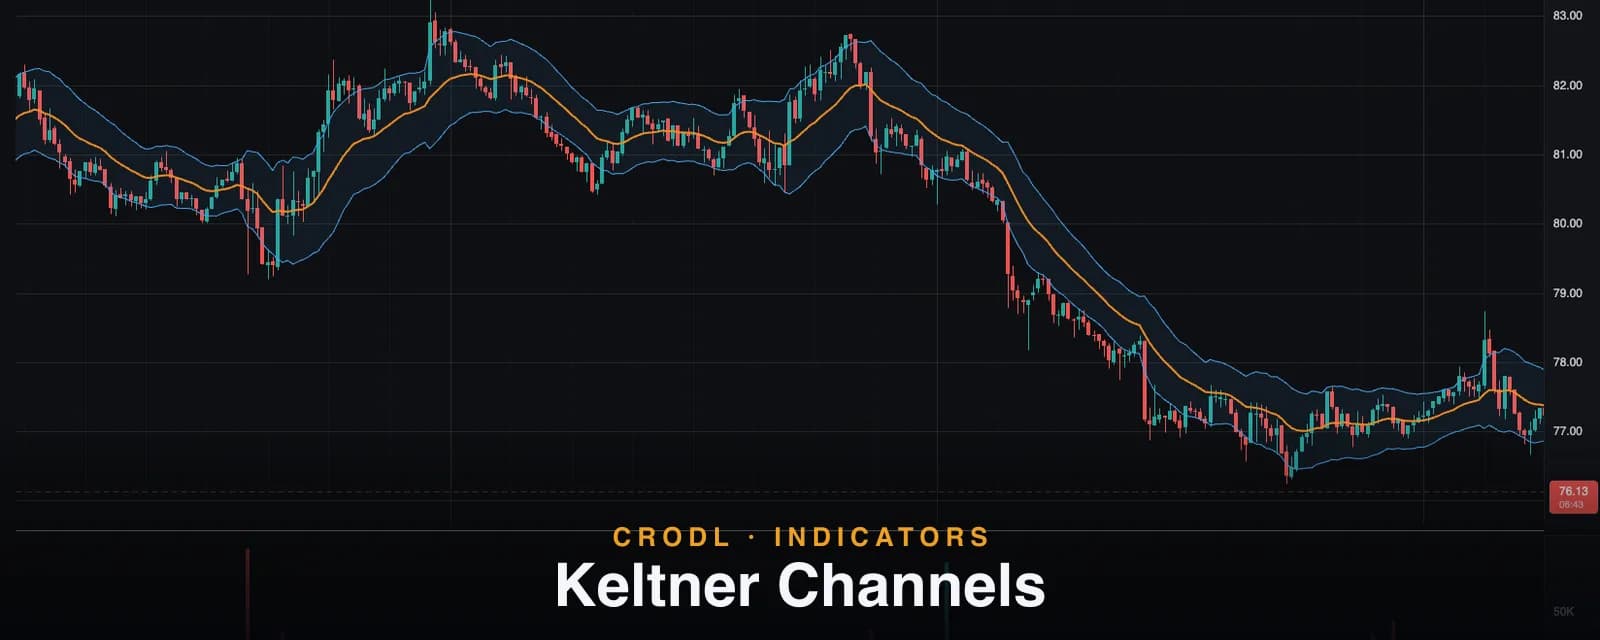
Keltner Channels
Keltner Channels wrap a 20-period EMA in ATR-based bands — a smoother volatility channel than Bollinger Bands. How the Crodl preset works and how traders use it.
Indicators
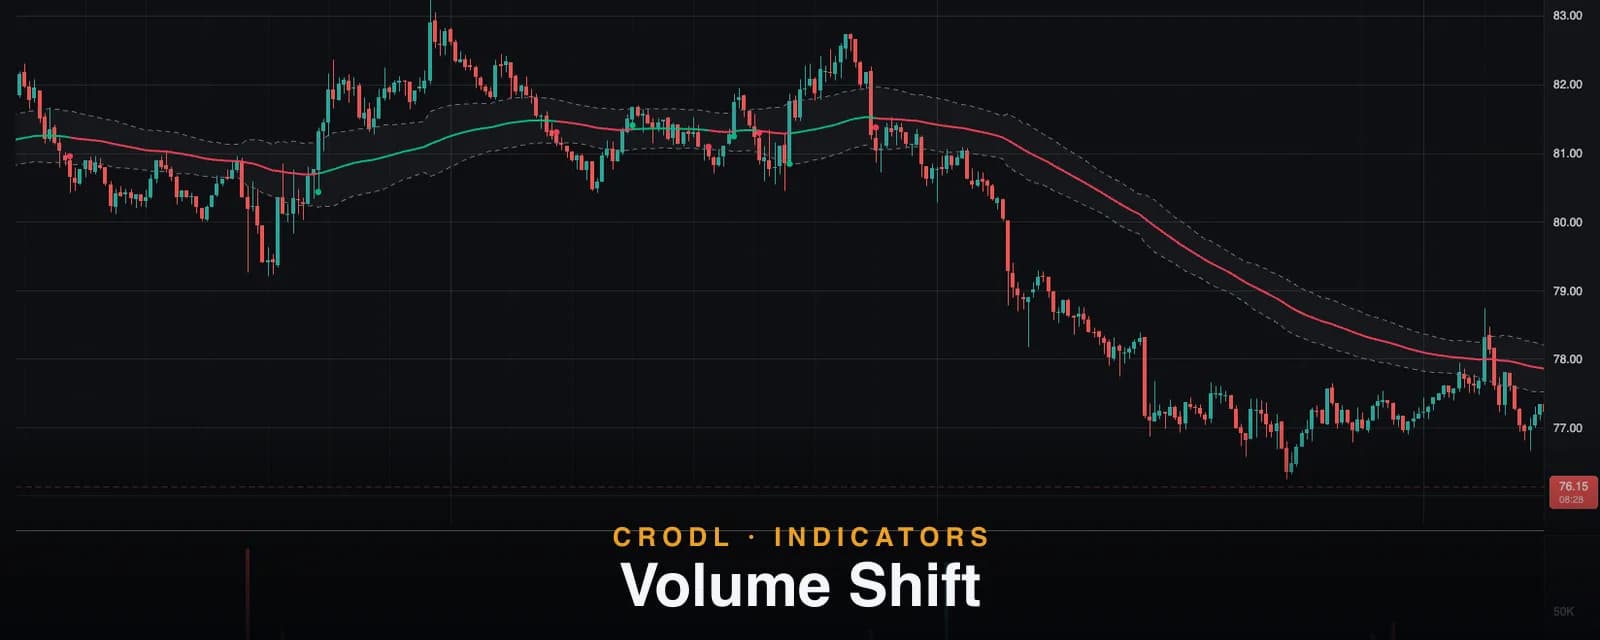
Volume Shift
How Crodl's Volume Shift indicator wraps an ATR deadband around a 100 EMA and flips trend only on a close beyond the opposite band — hysteresis that kills chop.
Indicators
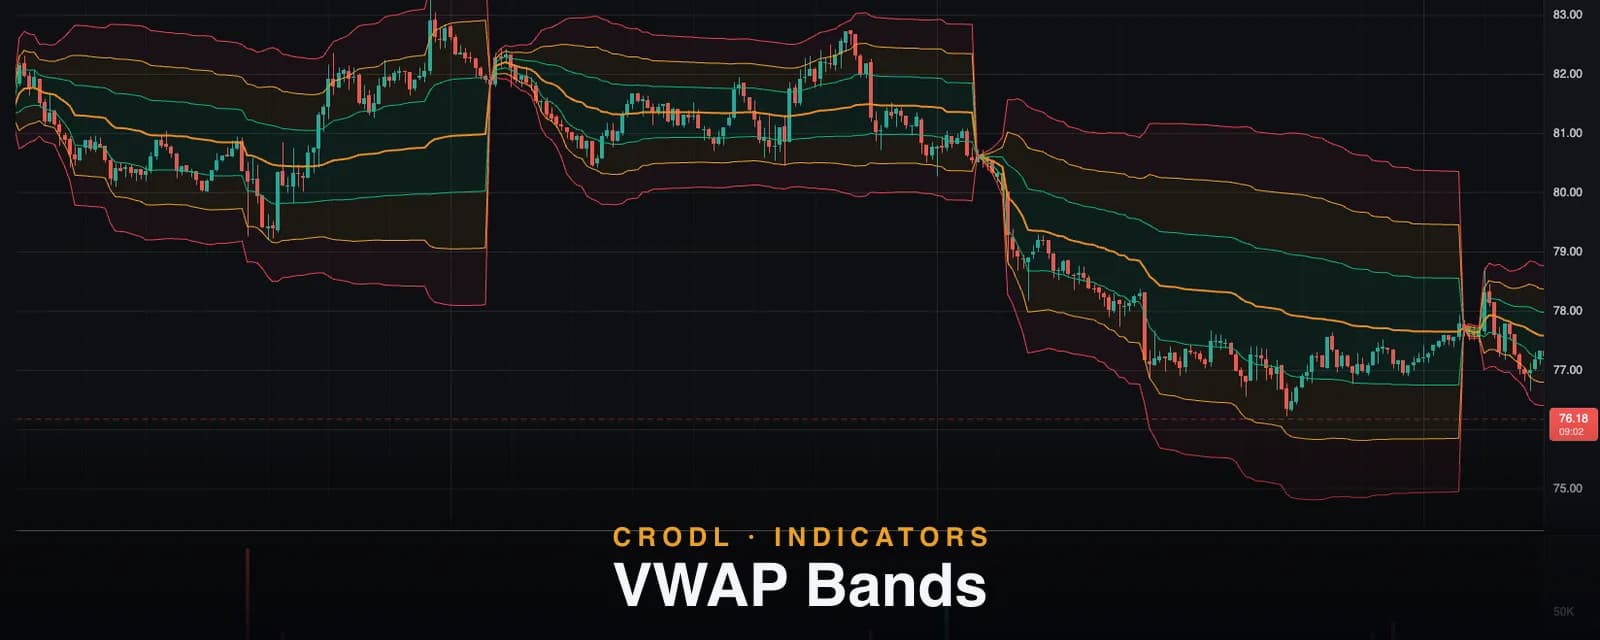
VWAP Bands
VWAP Bands surround anchored VWAP with one, two, and three standard-deviation rings and filled zones. How the Crodl preset computes them and how traders trade the levels.
Indicators
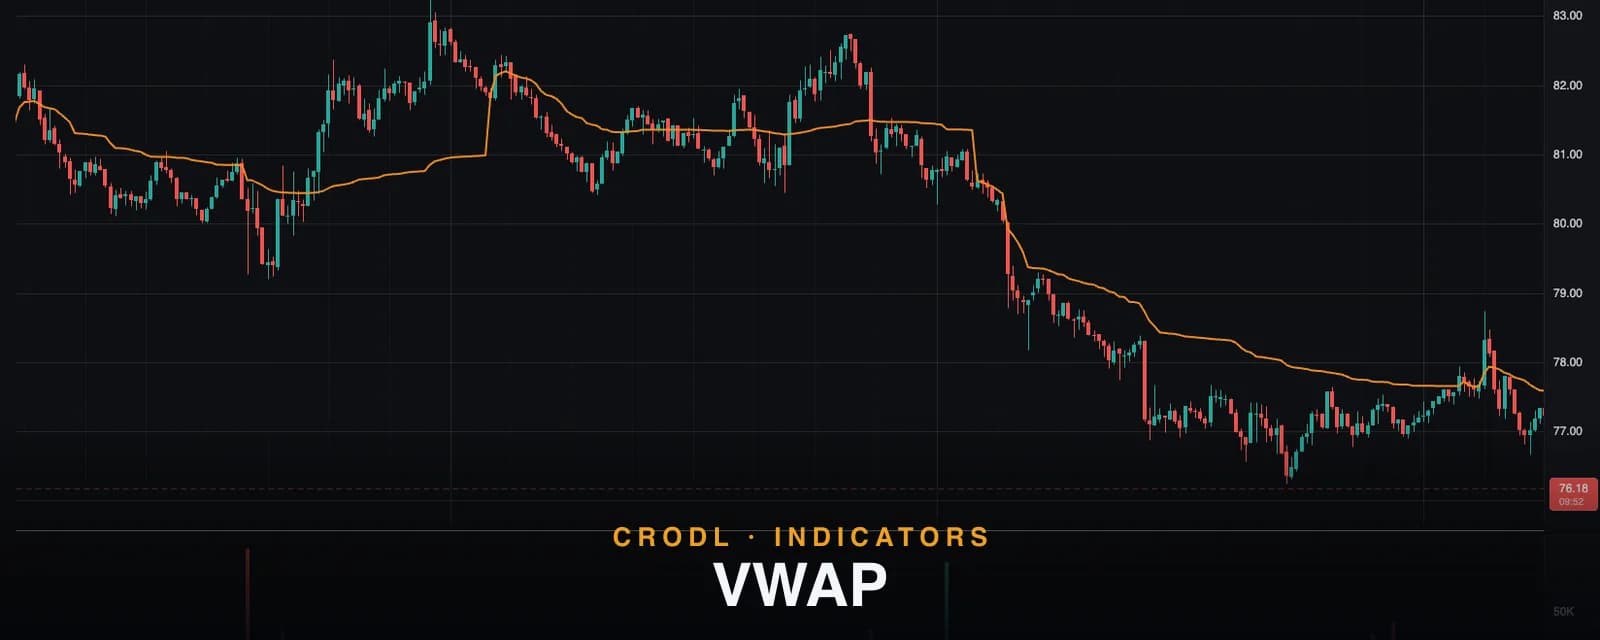
VWAP
VWAP is the volume-weighted average price — the market's anchored fair-value line. How Crodl's VWAP works, from daily to yearly anchors, and how traders use it.
Indicators
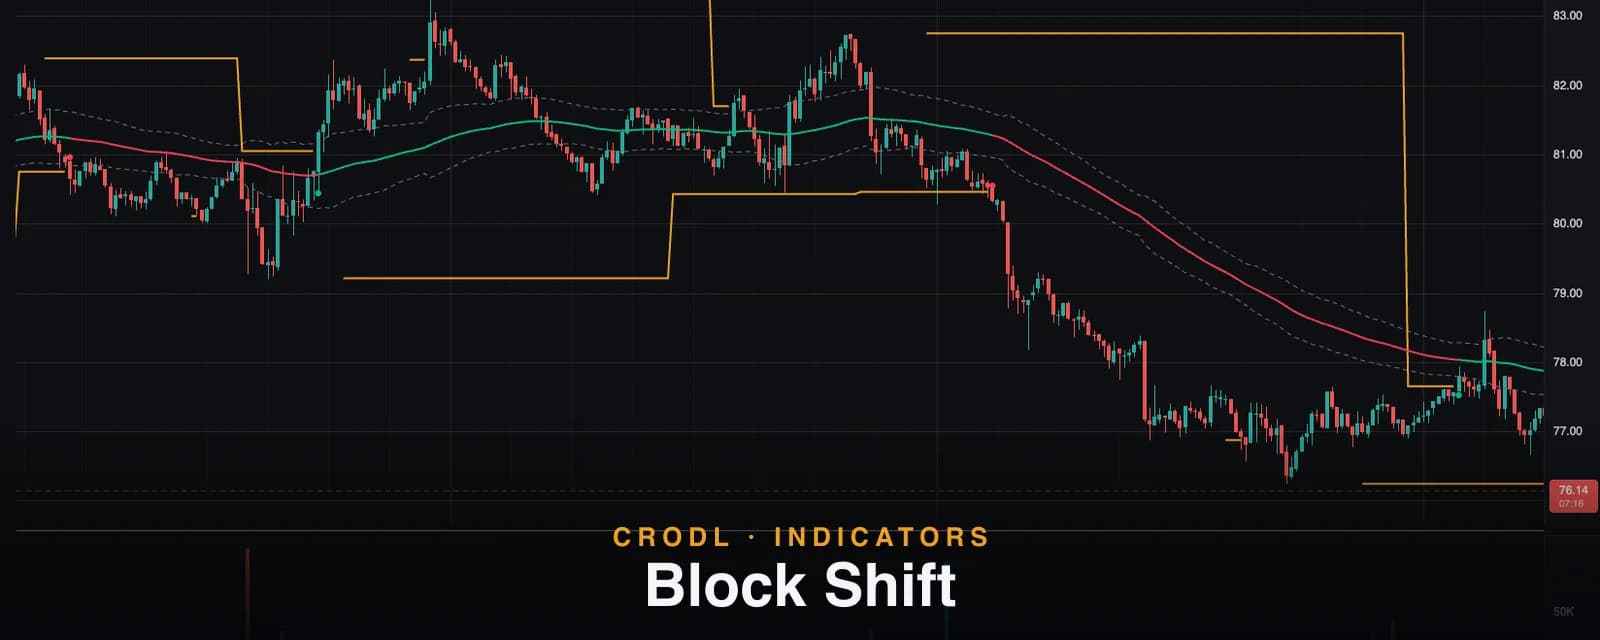
Block Shift
Crodl's Block Shift indicator flips trend only when a candle closes through the last confirmed swing block — structural breaks, drawn and consumed on the chart.
Indicators
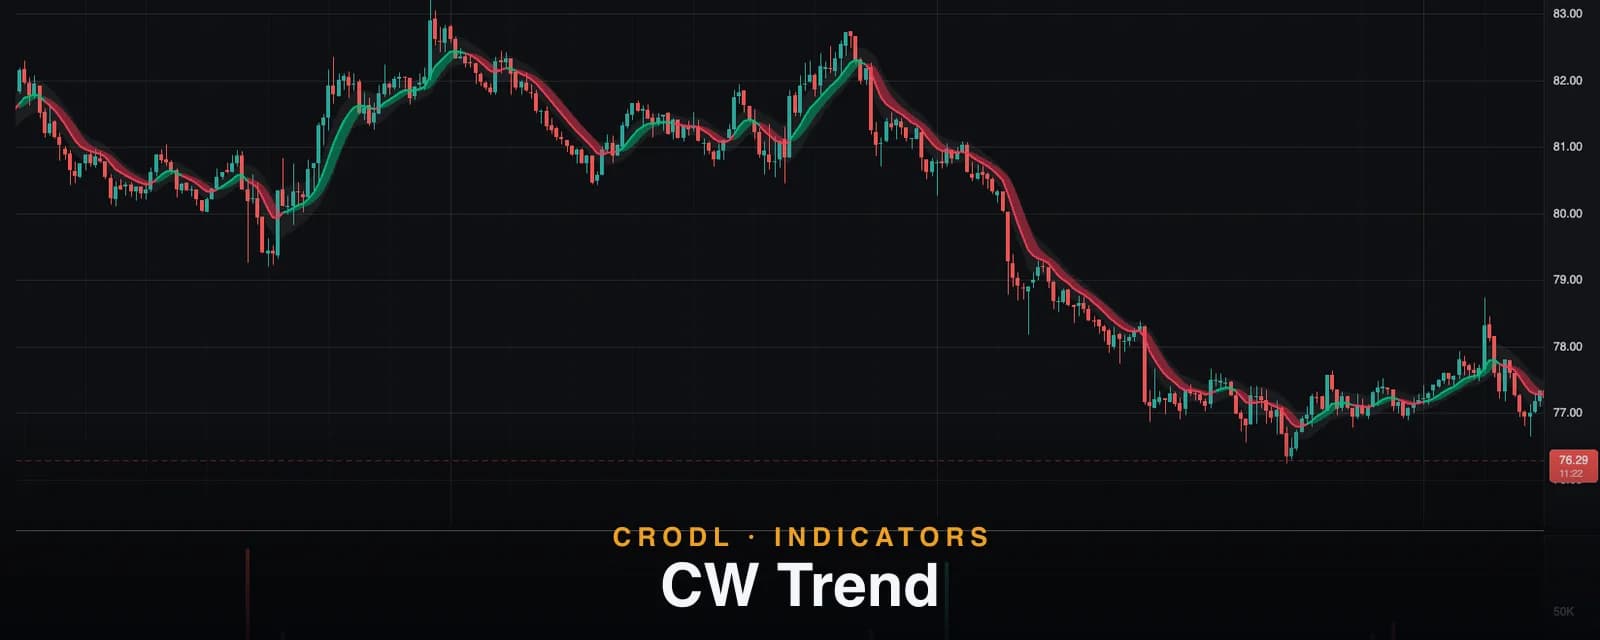
CW Trend
CW Trend smooths all four Heikin Ashi series with a selectable moving average and paints the smoothed body as a directional cloud. How Crodl's house trend tool works.
Indicators
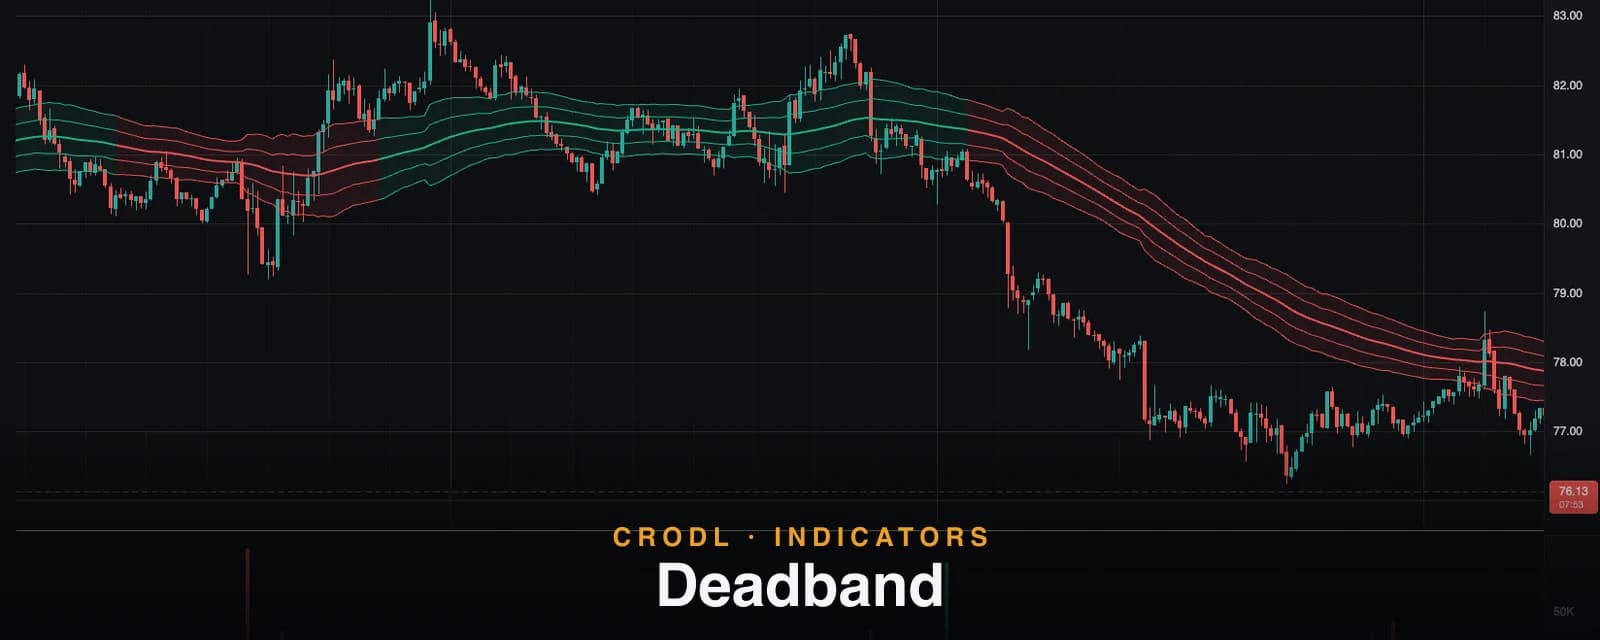
Deadband
Crodl's Deadband indicator colours an EMA 100/ATR channel only when its band state and the EMA 50/200 regime agree — a consensus trend filter with no signals to chase.
Indicators
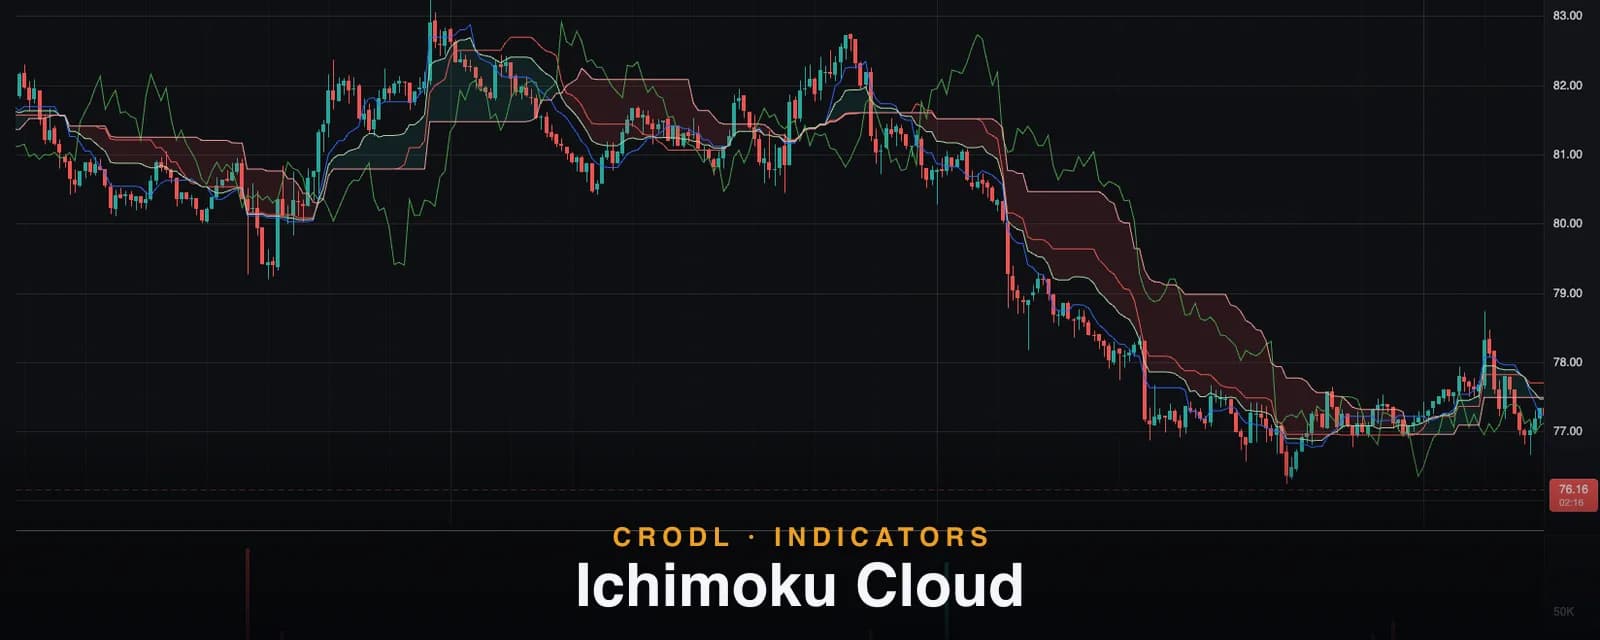
Ichimoku Cloud
How Crodl's Ichimoku Cloud preset computes Tenkan, Kijun, the Senkou spans, and the Chikou line — why its cloud is un-displaced, and how traders trade it.
Indicators
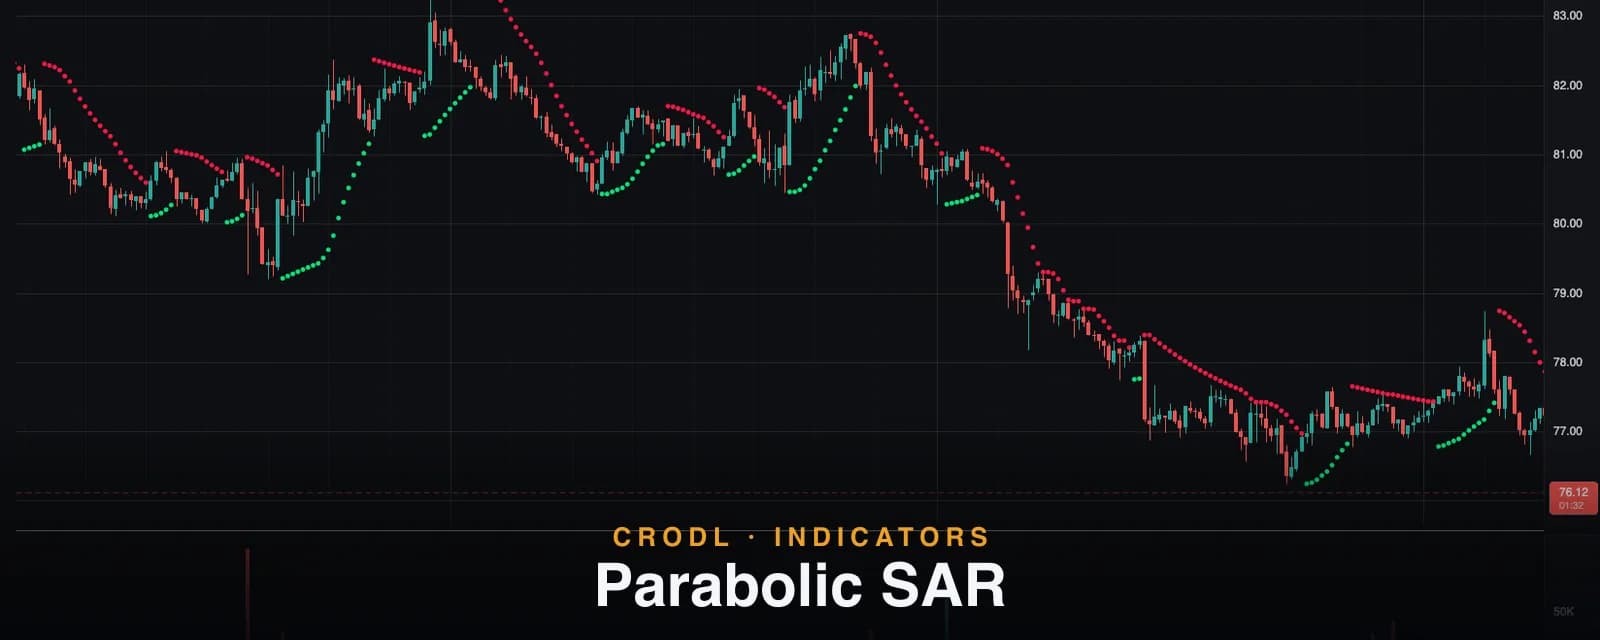
Parabolic SAR
Wilder's Parabolic SAR plots accelerating stop-and-reverse dots that trail price and flip on contact. How the SAR math works on the Crodl terminal and how to use it.
Indicators
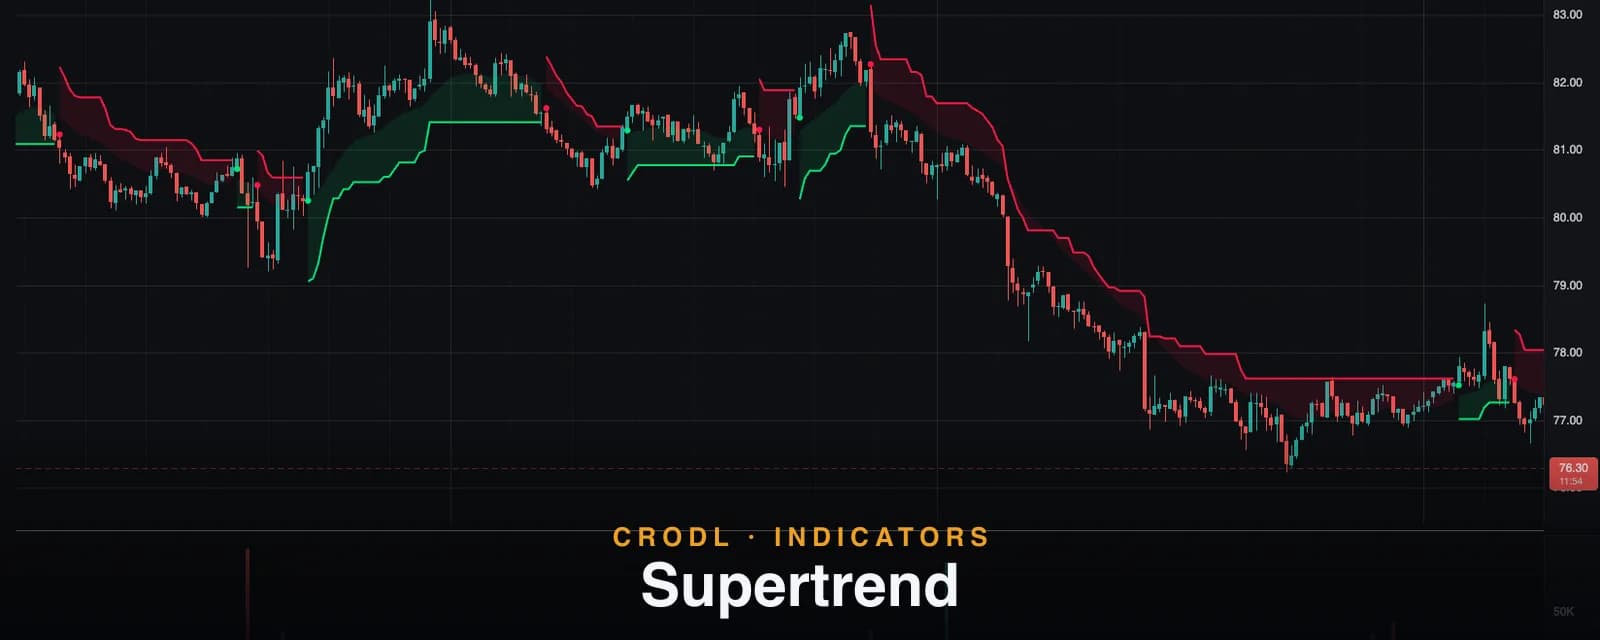
Supertrend
How the Supertrend indicator works on the Crodl terminal: the ATR trailing band math, factor and ATR-length defaults, flip markers and alerts, and how traders use it.
Indicators
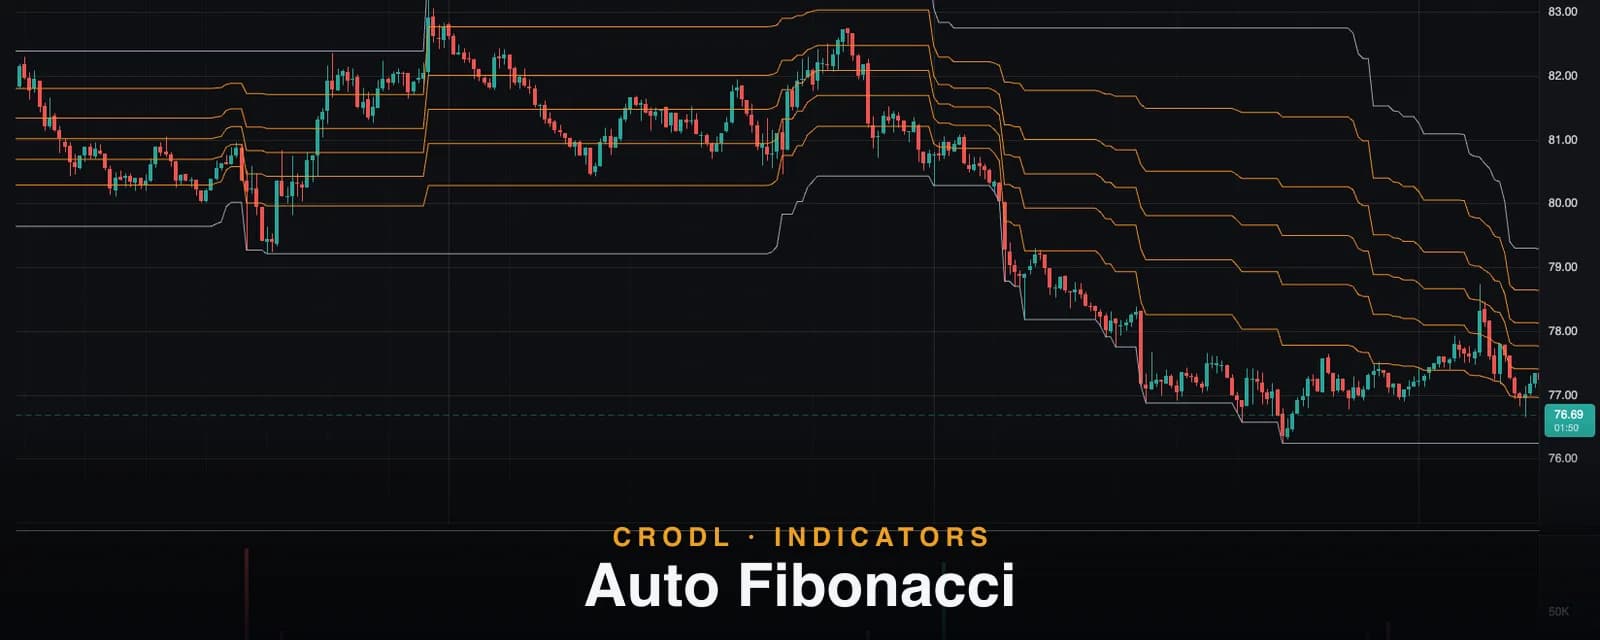
Auto Fibonacci
Crodl's Auto Fibonacci indicator maintains a live retracement grid — 23.6% to 78.6% — across the rolling N-bar high–low range, so your fib levels are never stale.
Indicators
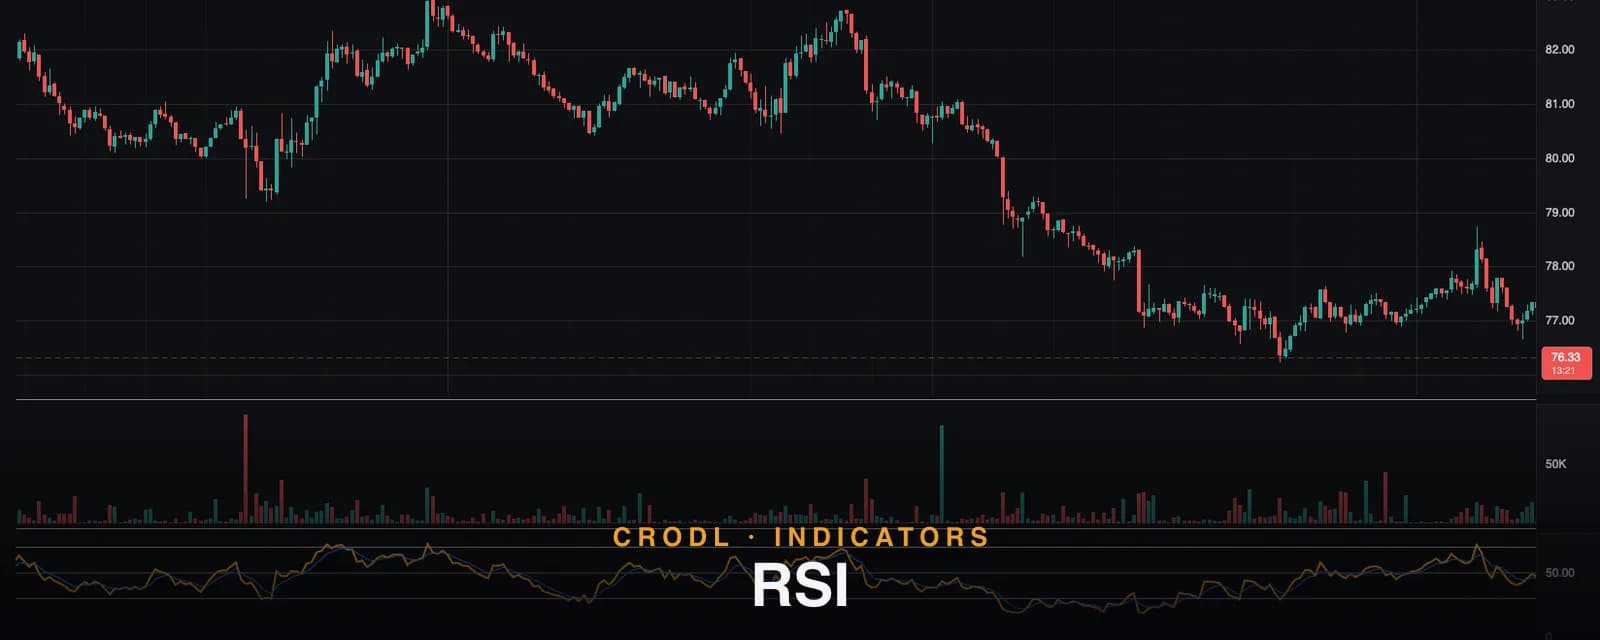
RSI
How the RSI preset on Crodl's terminal works: 14-period RSI in its own pane with a 5-period EMA signal line, a midline histogram, 70/30 bands, and crossover alerts.
Indicators
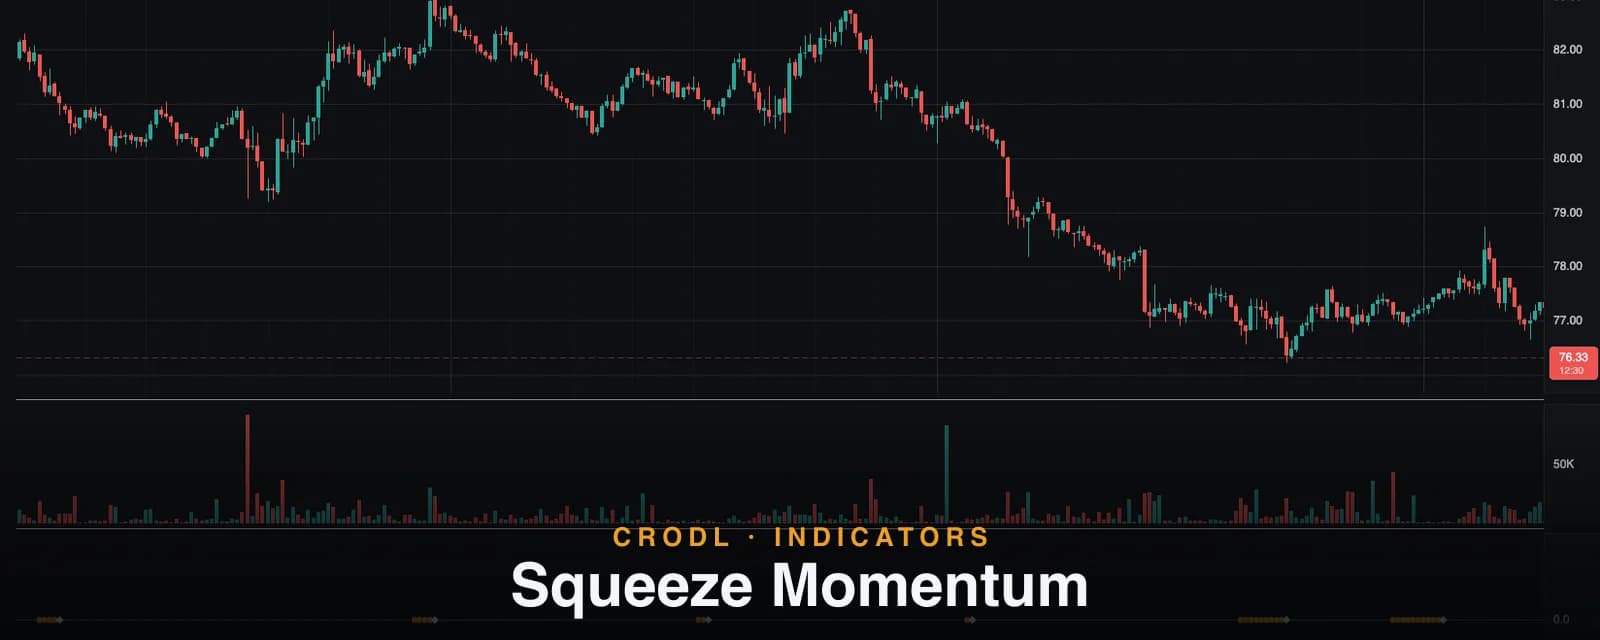
Squeeze Momentum
How Crodl's Squeeze Momentum preset works: Bollinger(20,2)-inside-Keltner(20,1.5) squeeze dots, a four-state momentum histogram, and alerts when the squeeze fires.
Indicators
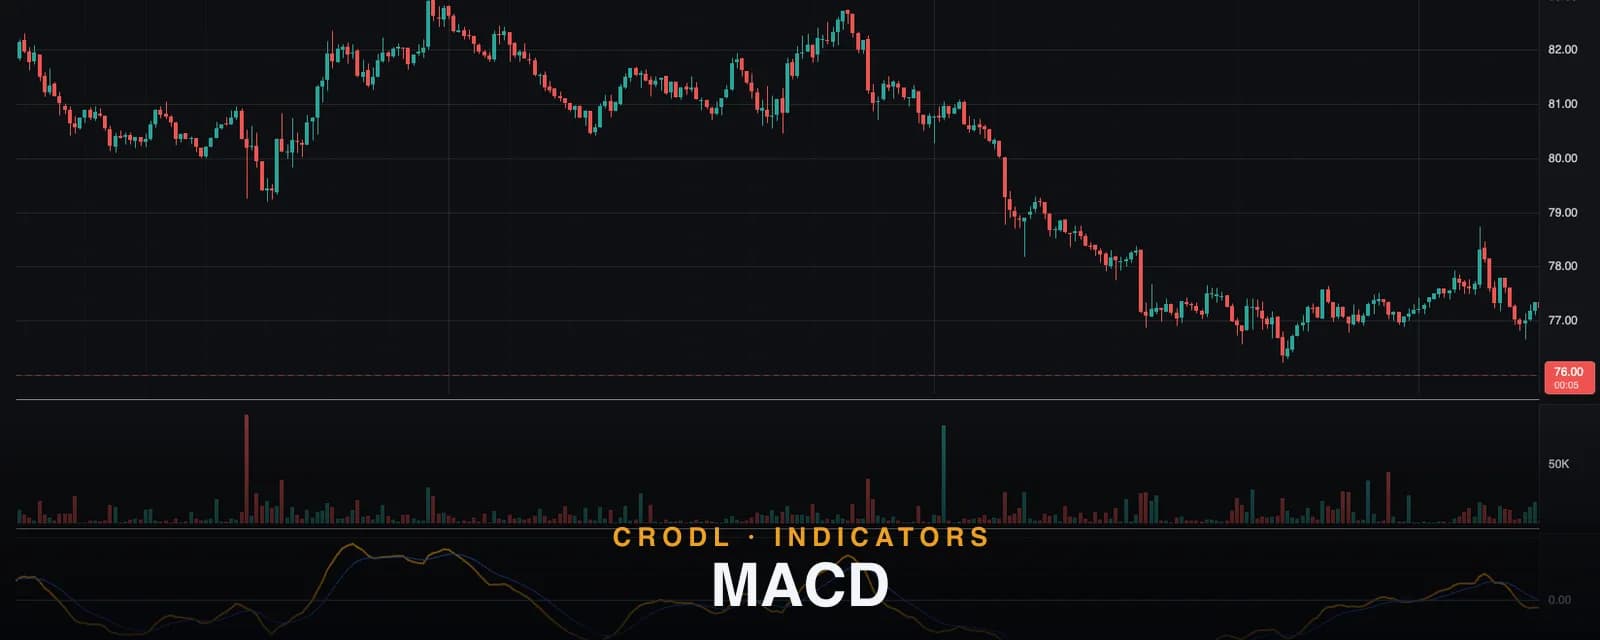
MACD
The classic 12/26/9 MACD on Crodl's terminal: how the line, signal, and bicolor histogram are computed, the four built-in crossover alerts, and how traders use each.
Indicators
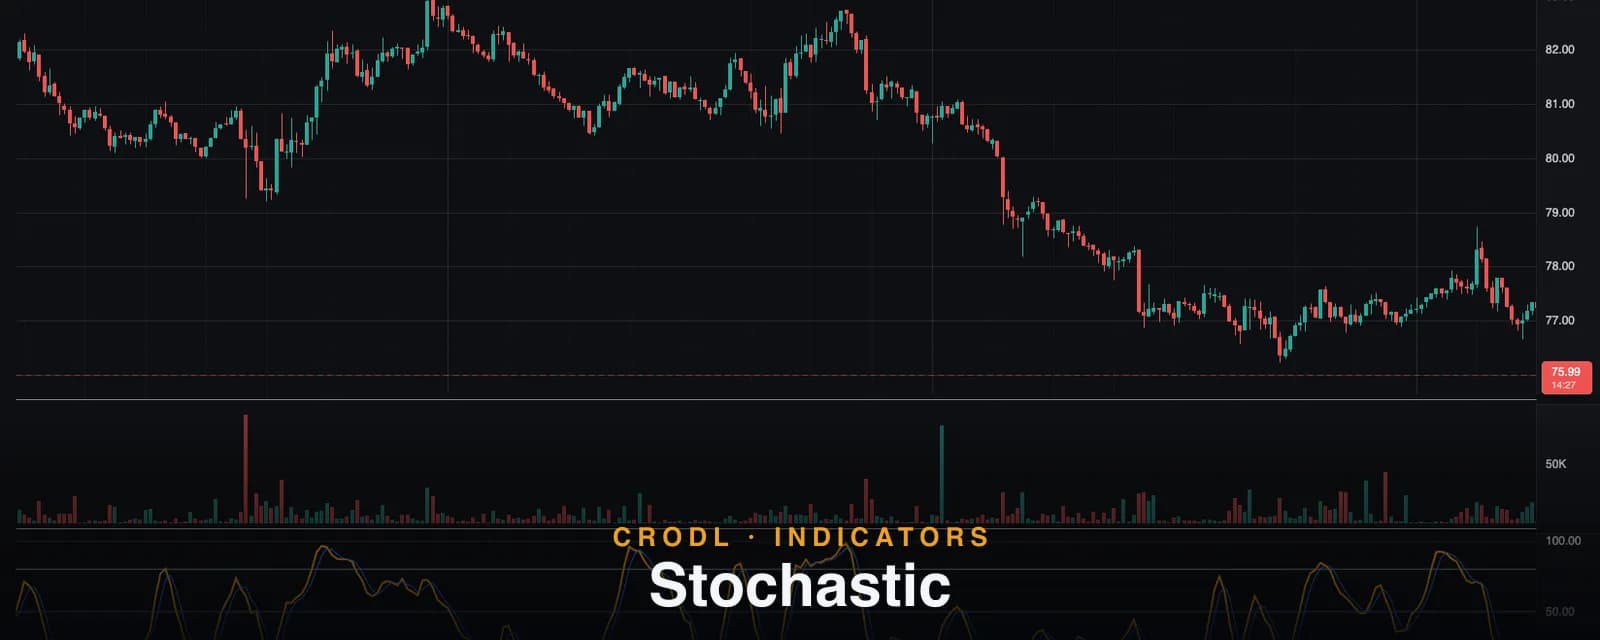
Stochastic
The Stochastic oscillator shows where price closed inside its recent range. How Crodl's 14-3-3 %K/%D preset works and how crypto traders use the 80/20 bands.
Indicators
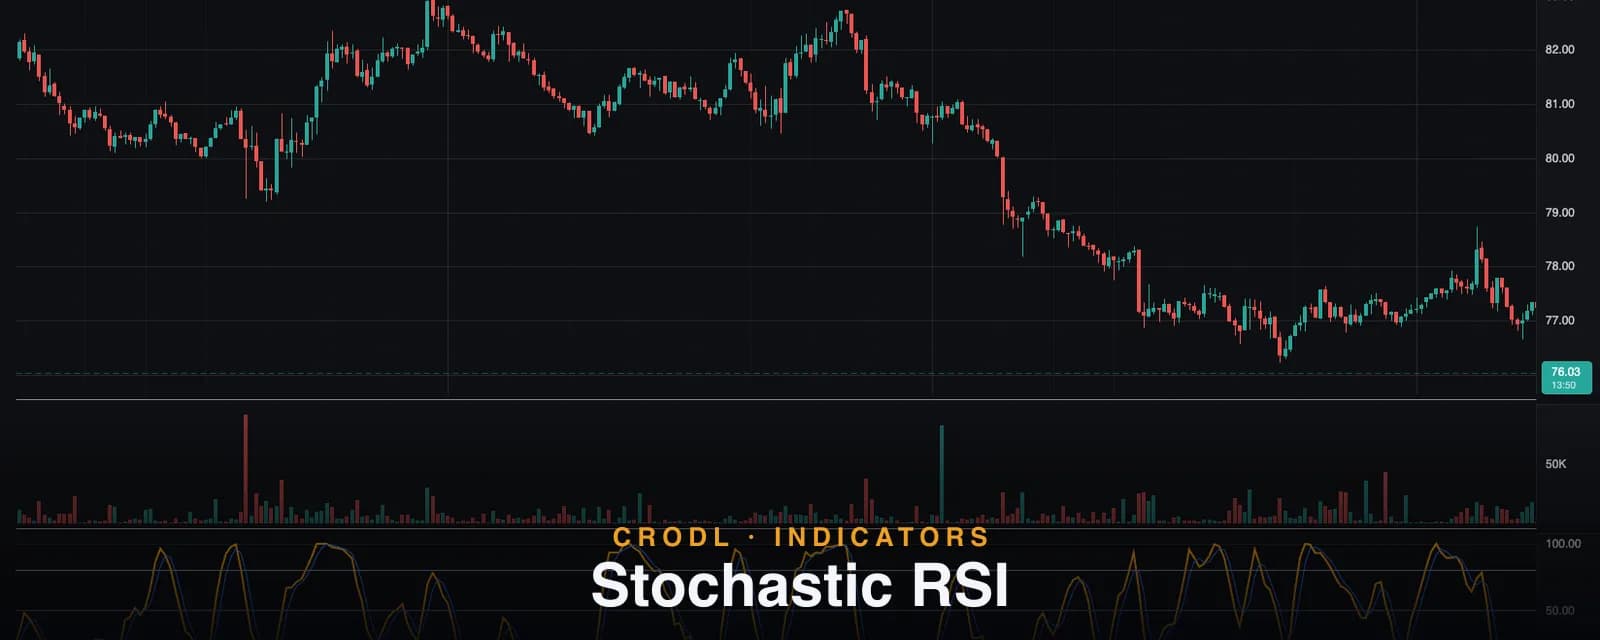
Stochastic RSI
Stochastic RSI runs the stochastic formula on RSI instead of price, giving a faster cycle-timing tool. Crodl's 14/14/3/3 preset, the 80/20 bands, and how to trade it.
Indicators
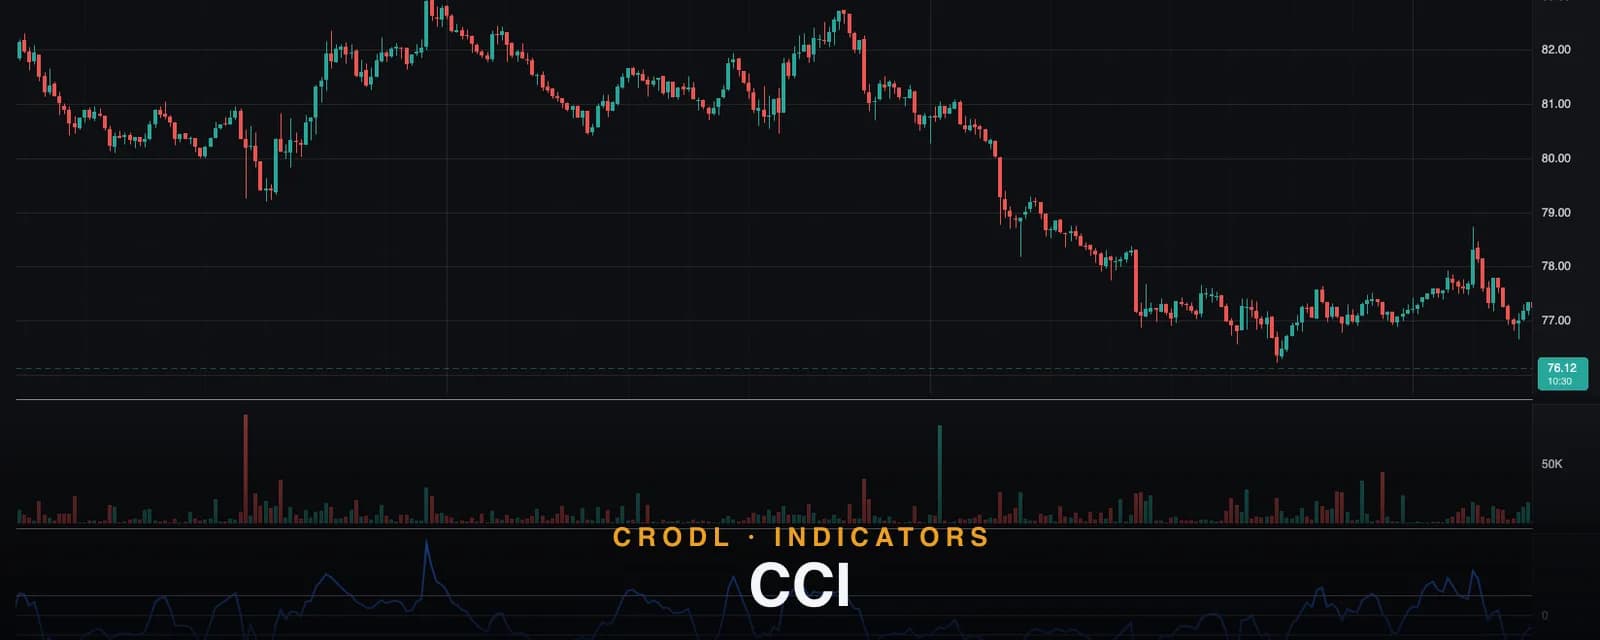
CCI
CCI measures how far typical price has stretched from its 20-period average, scaled by mean deviation. Crodl's preset, the ±100 bands, and how crypto traders use it.
Indicators
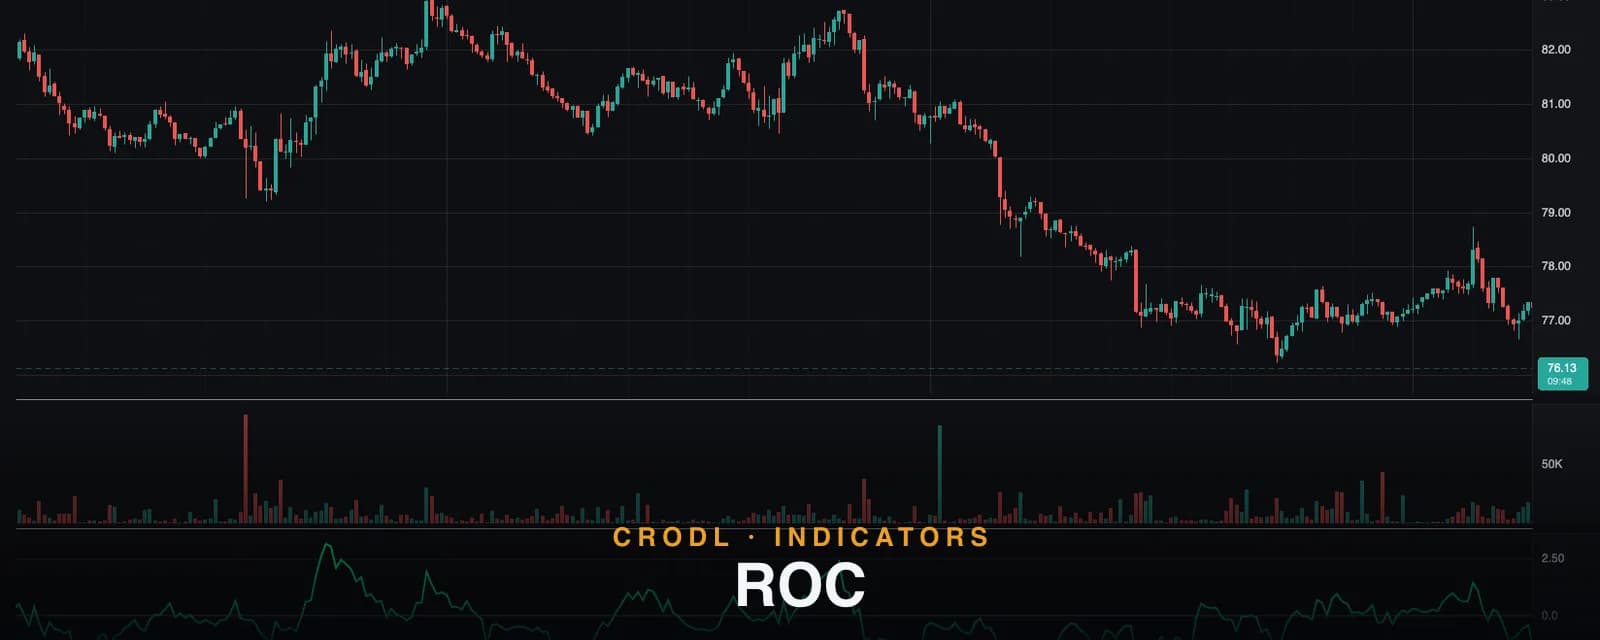
ROC
Rate of Change turns momentum into a simple percentage: how far price moved over the last 12 bars. Crodl's zero-baseline ROC preset and how crypto traders read it.
Indicators
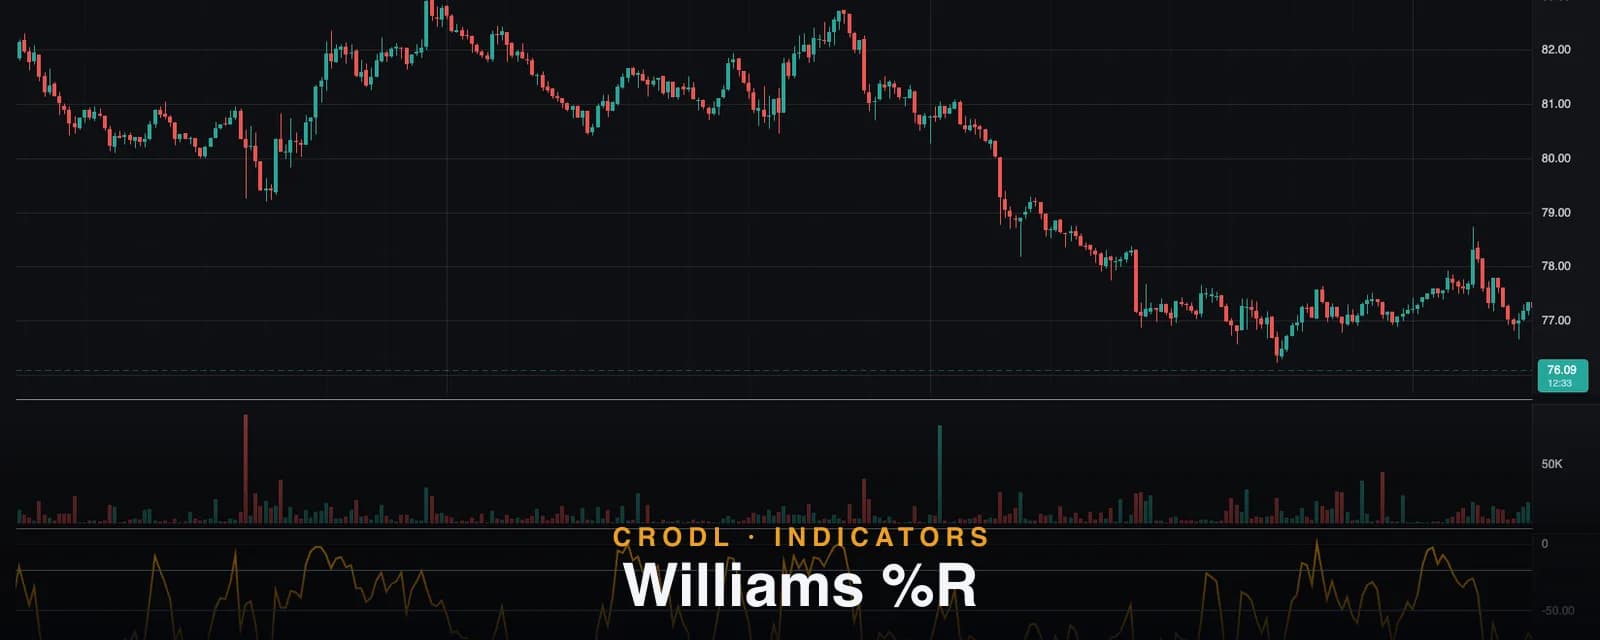
Williams %R
Williams %R measures how close price closed to the top of its 14-bar range on an inverted 0 to -100 scale. Crodl's preset, the -20/-80 zones, and how to trade it.
Indicators
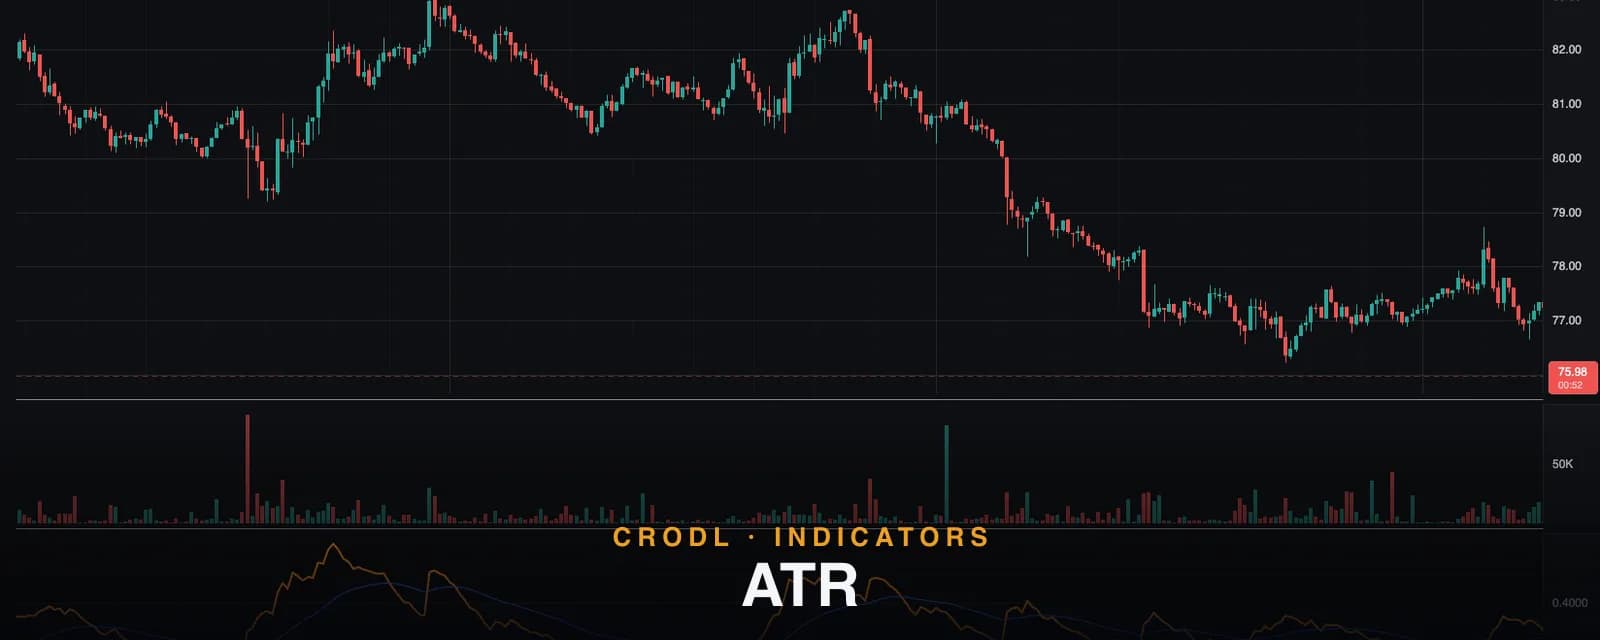
ATR
ATR measures true volatility bar by bar using Wilder's RMA smoothing. Crodl's 14-period preset, and why ATR should be setting your stop distance and position size.
Indicators
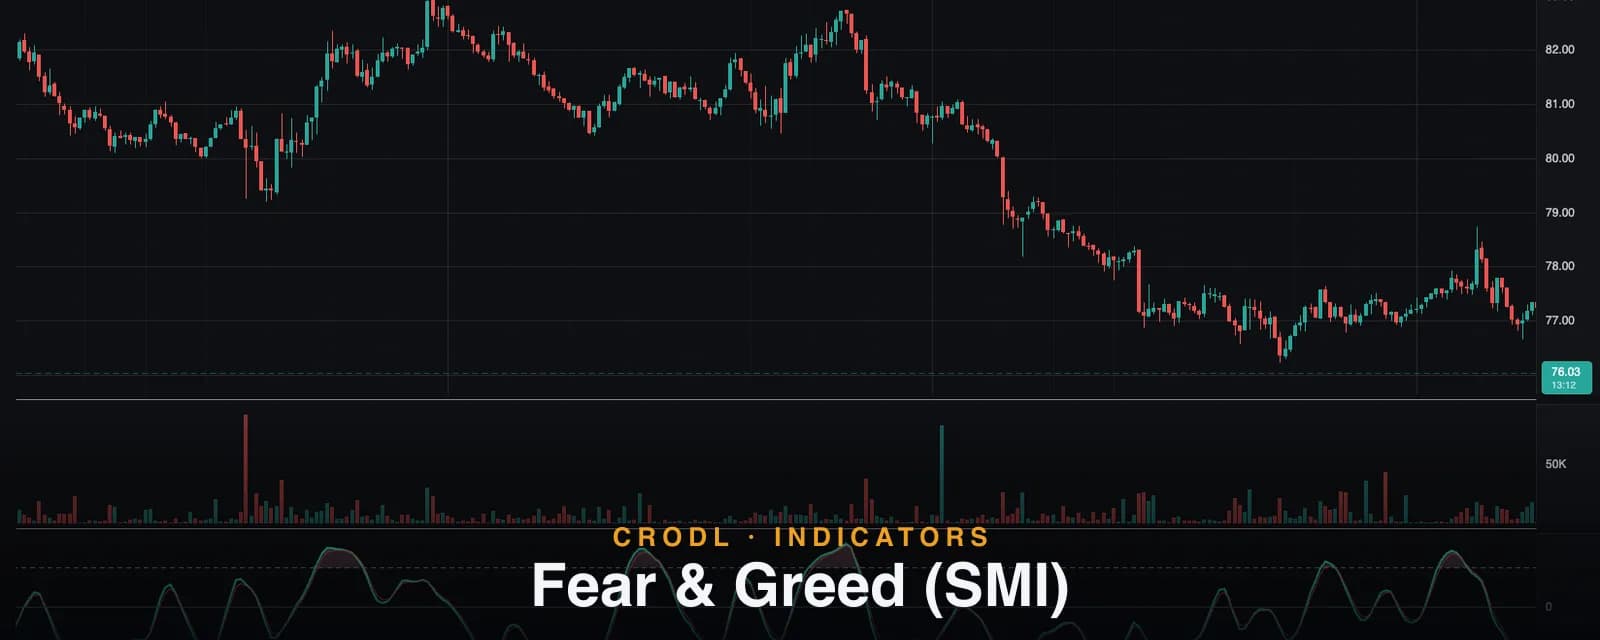
Fear & Greed (SMI)
How Crodl's Fear & Greed (SMI) indicator turns crowd emotion into a tradable signal — the Stochastic Momentum Index, ±50 greed and fear zones, and reversal alerts.
Indicators
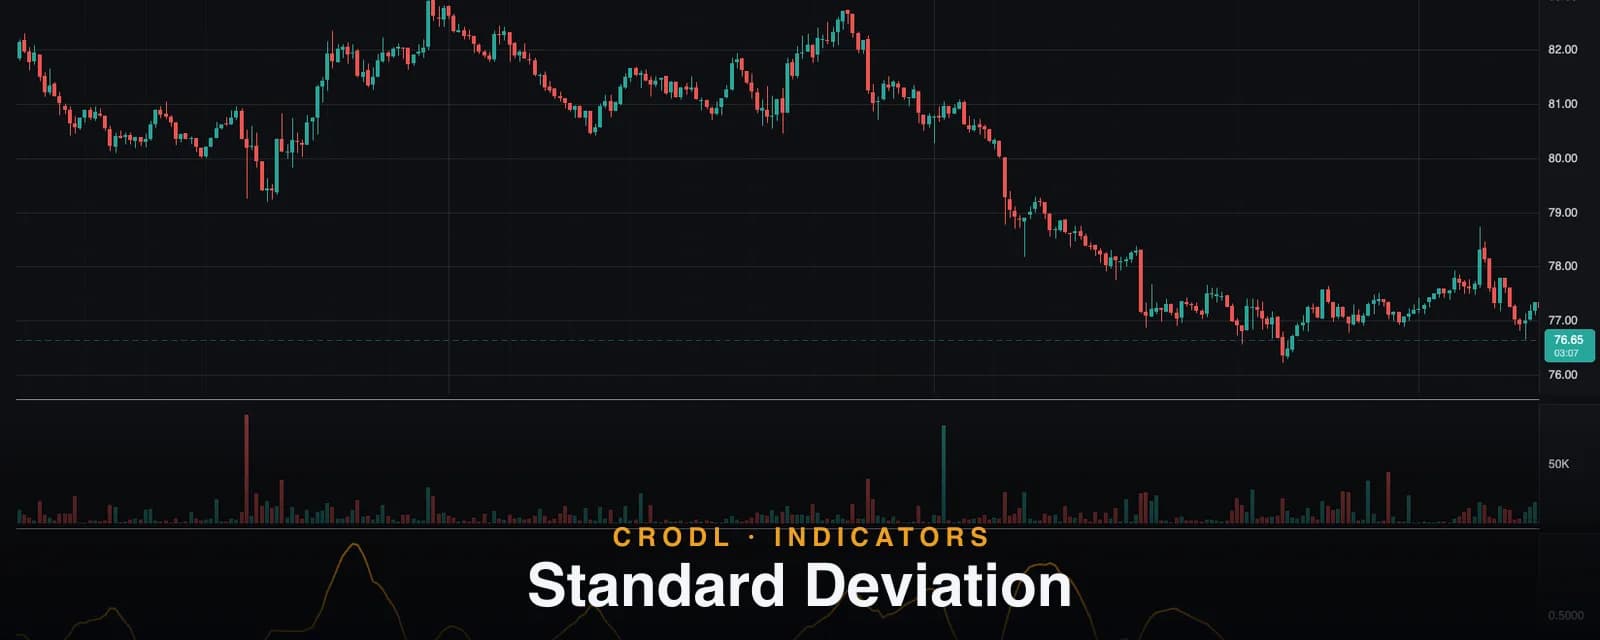
Standard Deviation
Standard Deviation is the purest volatility gauge: a rolling stdev of closing prices. Crodl's 20-period preset and how traders use quiet readings to front-run expansion.
Indicators
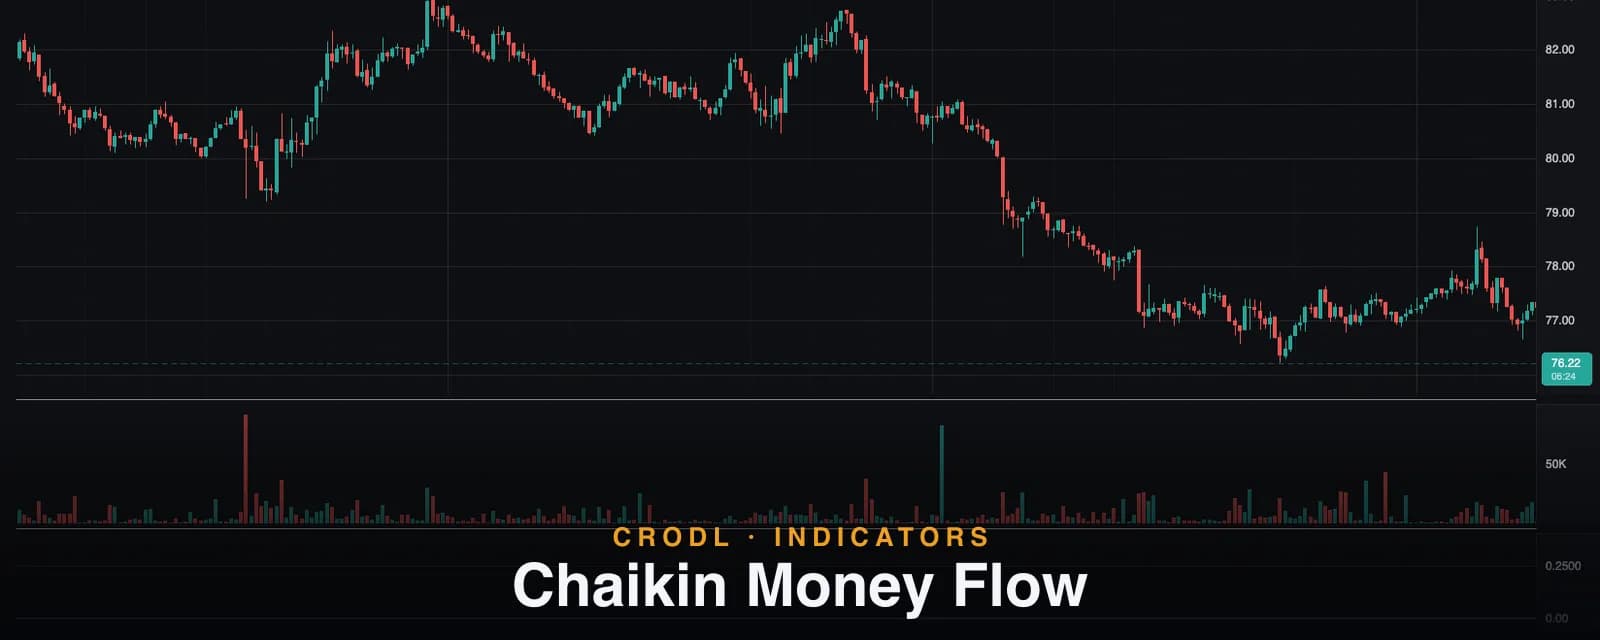
Chaikin Money Flow
Chaikin Money Flow reads where candles close within their range and weights it by volume. How Crodl's 20-period CMF works and how traders trade the zero line.
Indicators
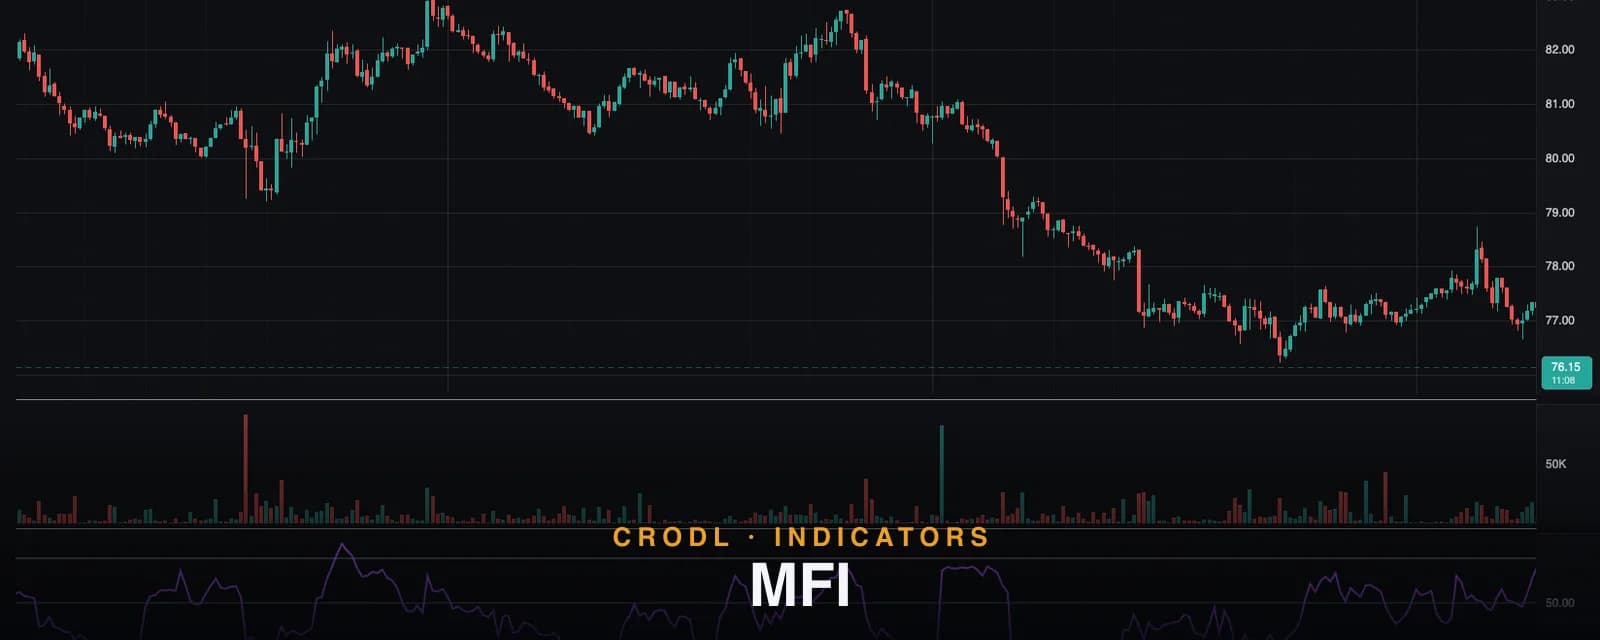
MFI
The Money Flow Index is RSI with volume built in. How Crodl's 14-period MFI preset works, its 80/20 bands, and what volume adds over price-only momentum oscillators.
Indicators
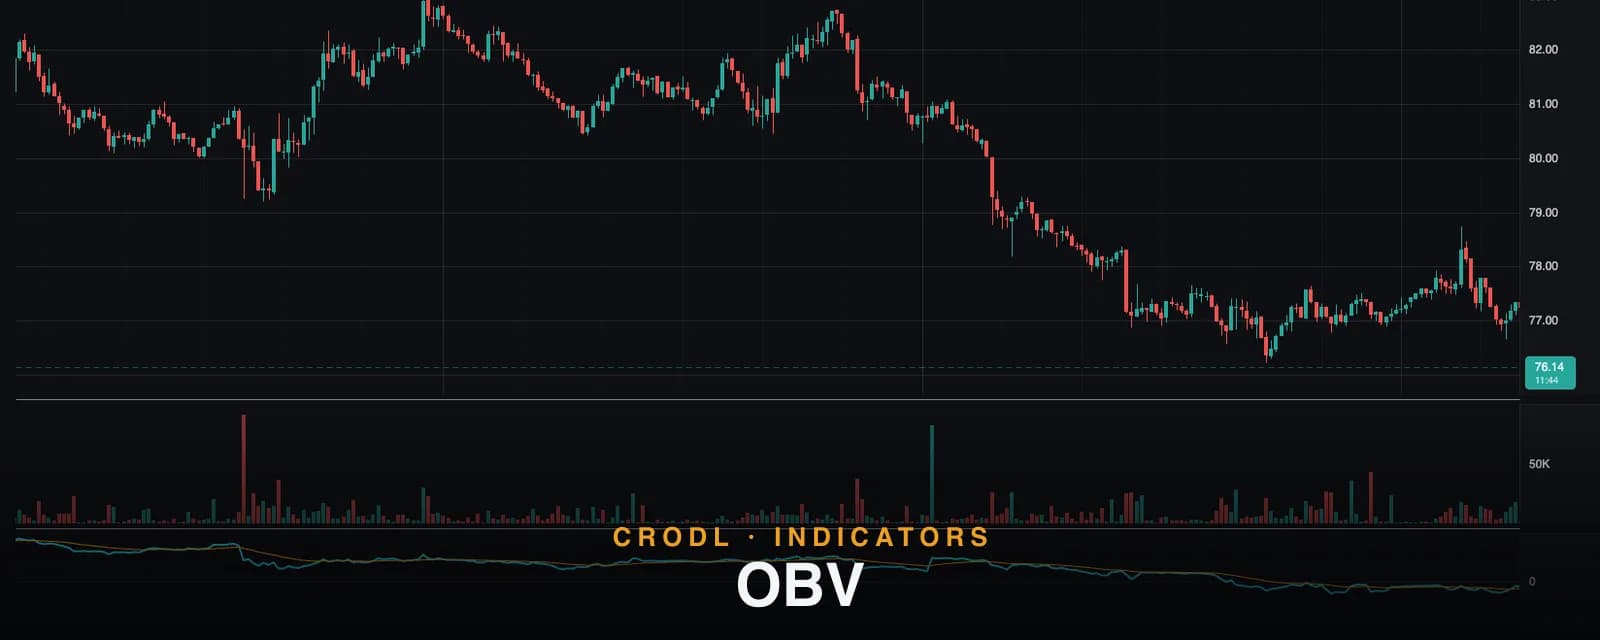
OBV
On-Balance Volume tracks whether volume flows with or against price. How Crodl's OBV preset works, its 21-period EMA signal line, and how traders read divergences.
Indicators
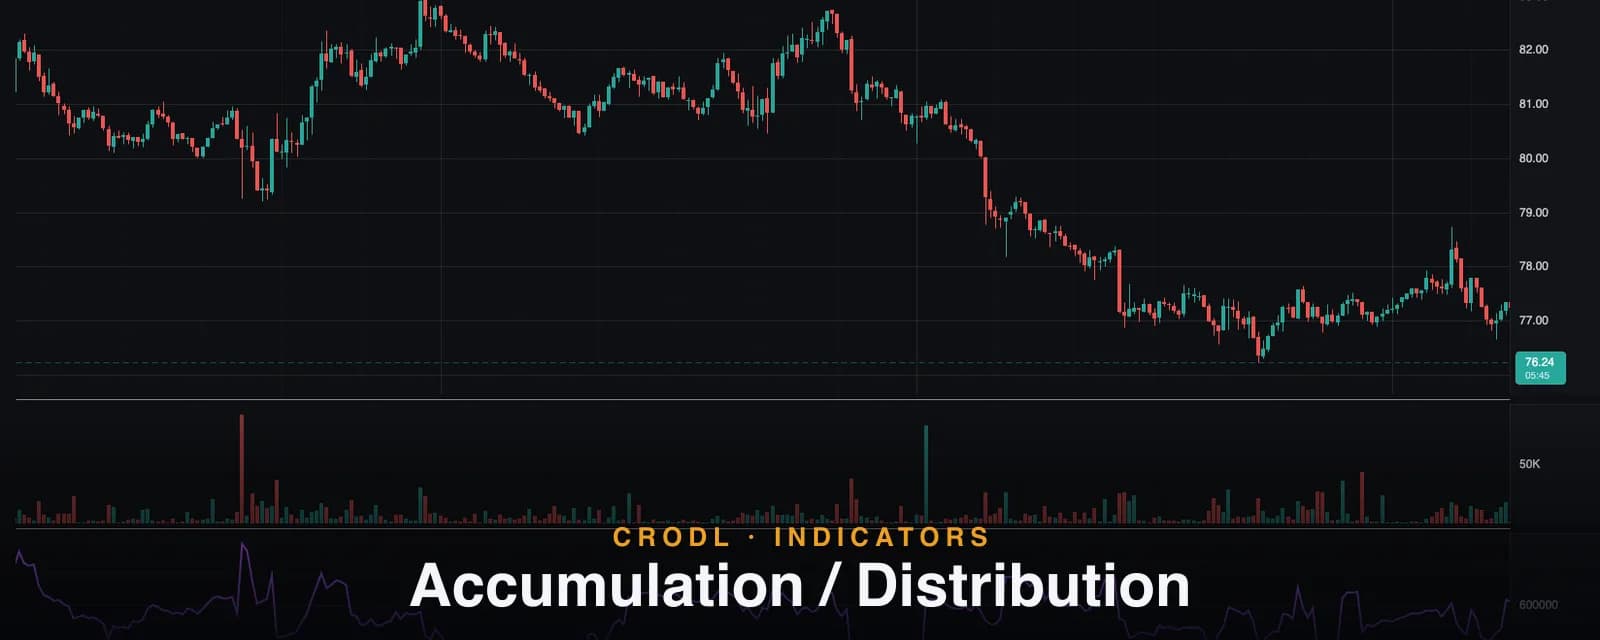
Accumulation / Distribution
The A/D line tracks cumulative money flow by weighting volume with each bar's close location. How Crodl's parameter-free preset works and how to read divergences.
Indicators
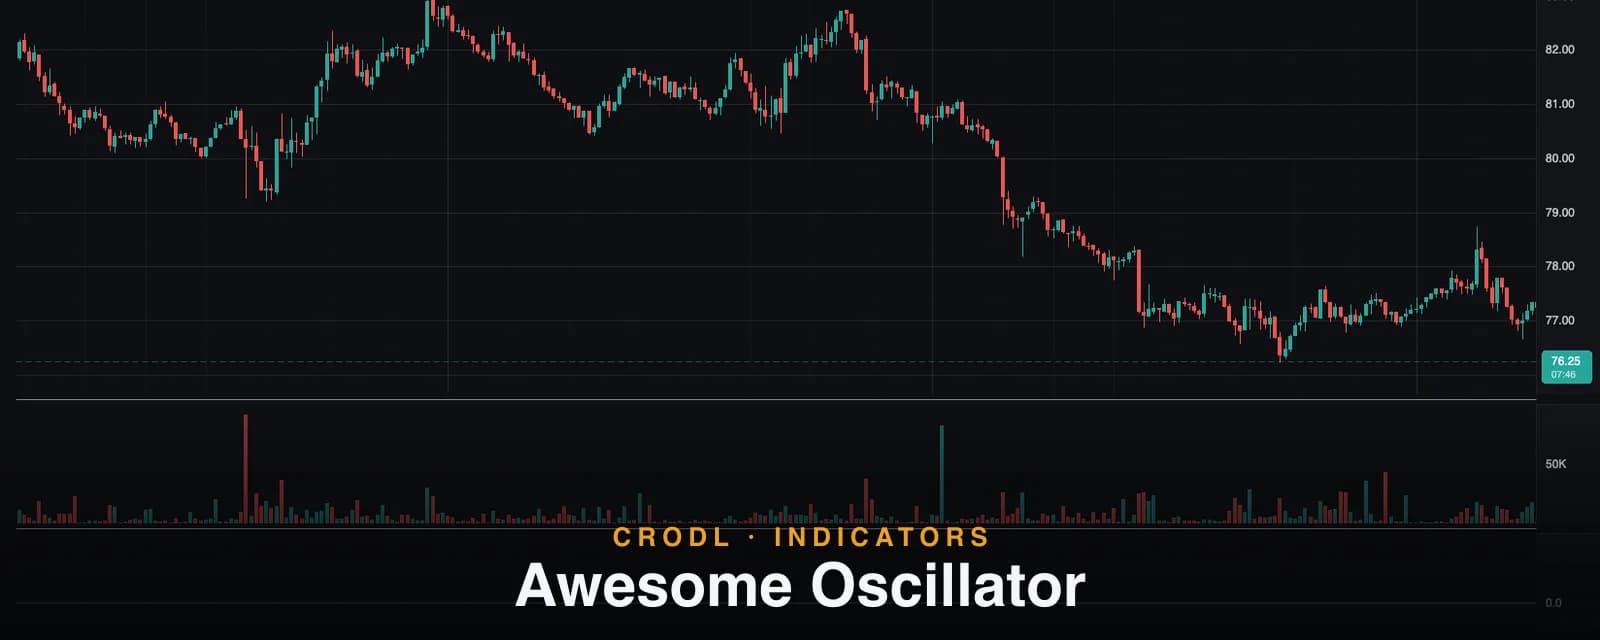
Awesome Oscillator
Bill Williams' Awesome Oscillator compares 5 and 34-period median-price averages in a bicolor histogram. How Crodl's preset works, plus the three classic signals.
Indicators
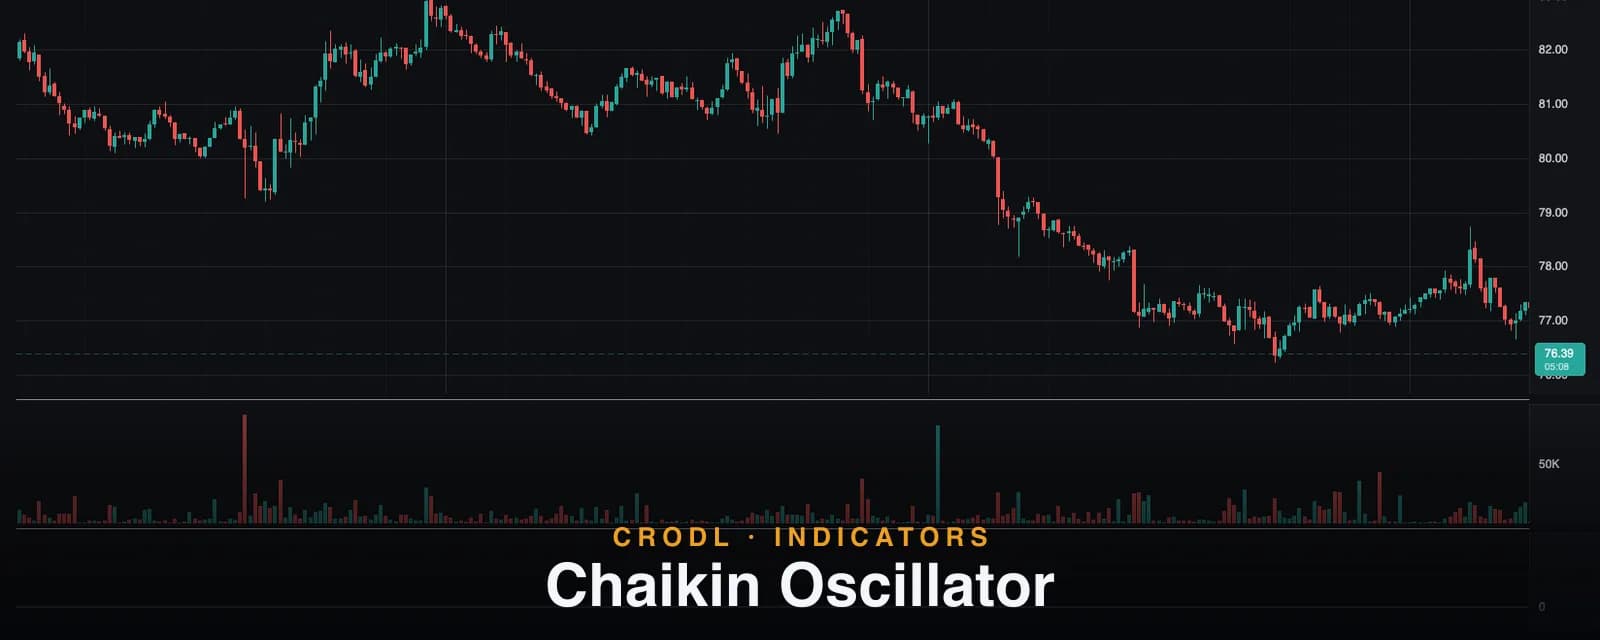
Chaikin Oscillator
The Chaikin Oscillator measures momentum of the Accumulation/Distribution line with a 3/10 EMA spread. How Crodl's preset works and how to trade its zero crosses.
Indicators
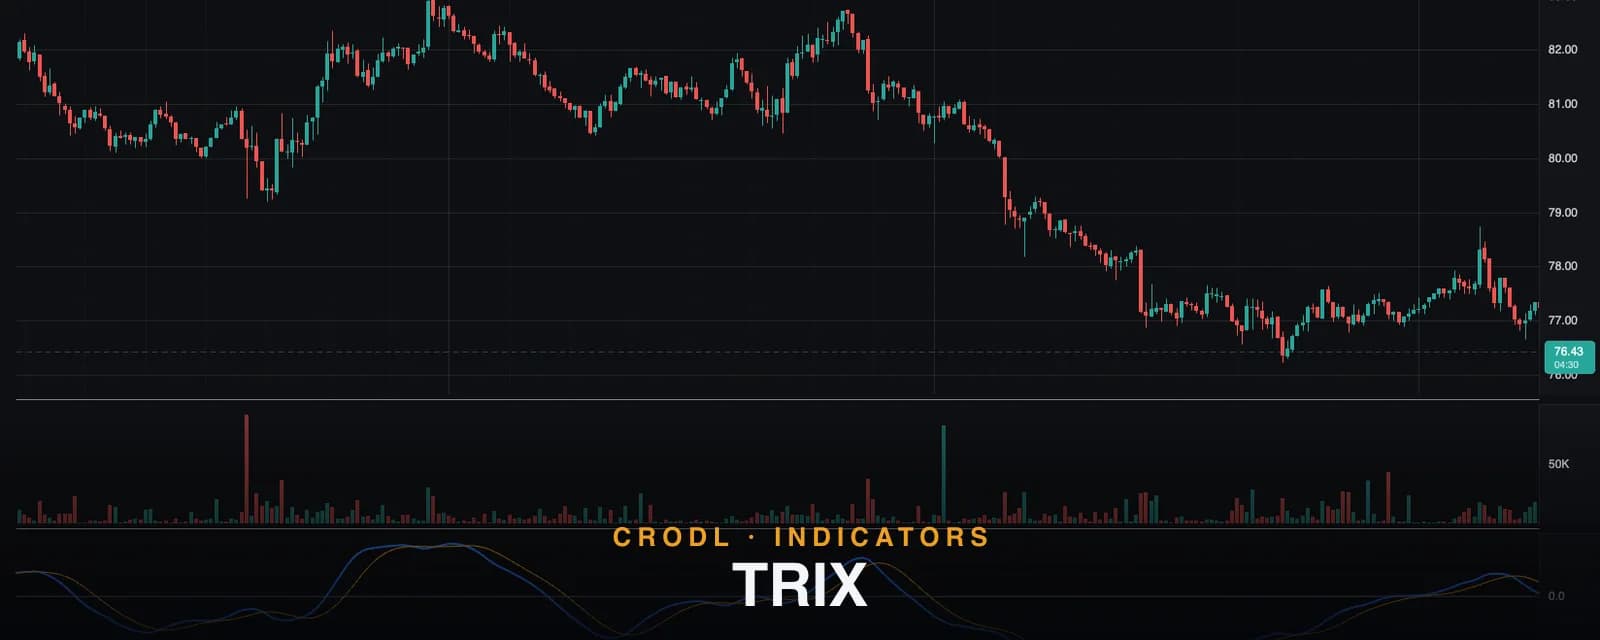
TRIX
TRIX triple-smooths an EMA and plots its rate of change, filtering noise other momentum tools trip on. How Crodl's 15/9 preset works and how traders use it.
Indicators
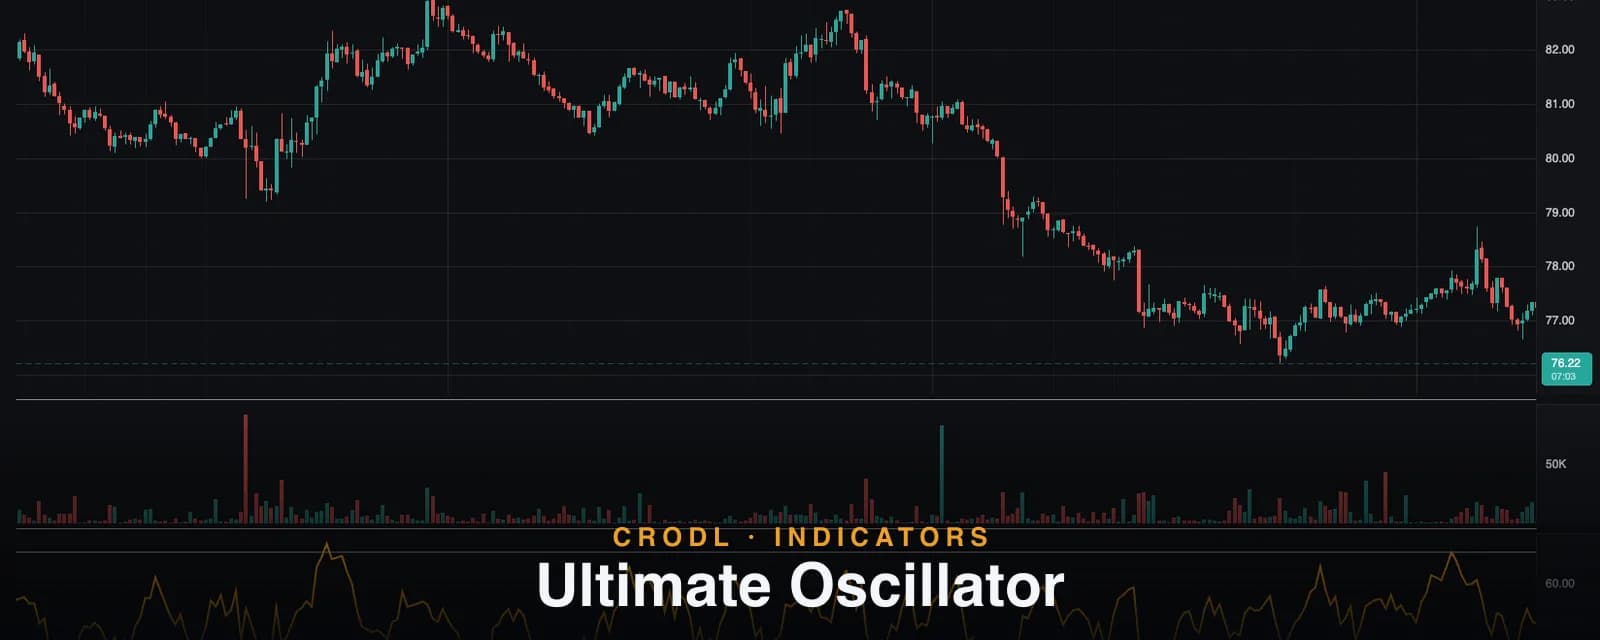
Ultimate Oscillator
Larry Williams built the Ultimate Oscillator to cut whipsaw by blending 7, 14, and 28-period buying pressure. How Crodl's weighted preset works in crypto.
Indicators
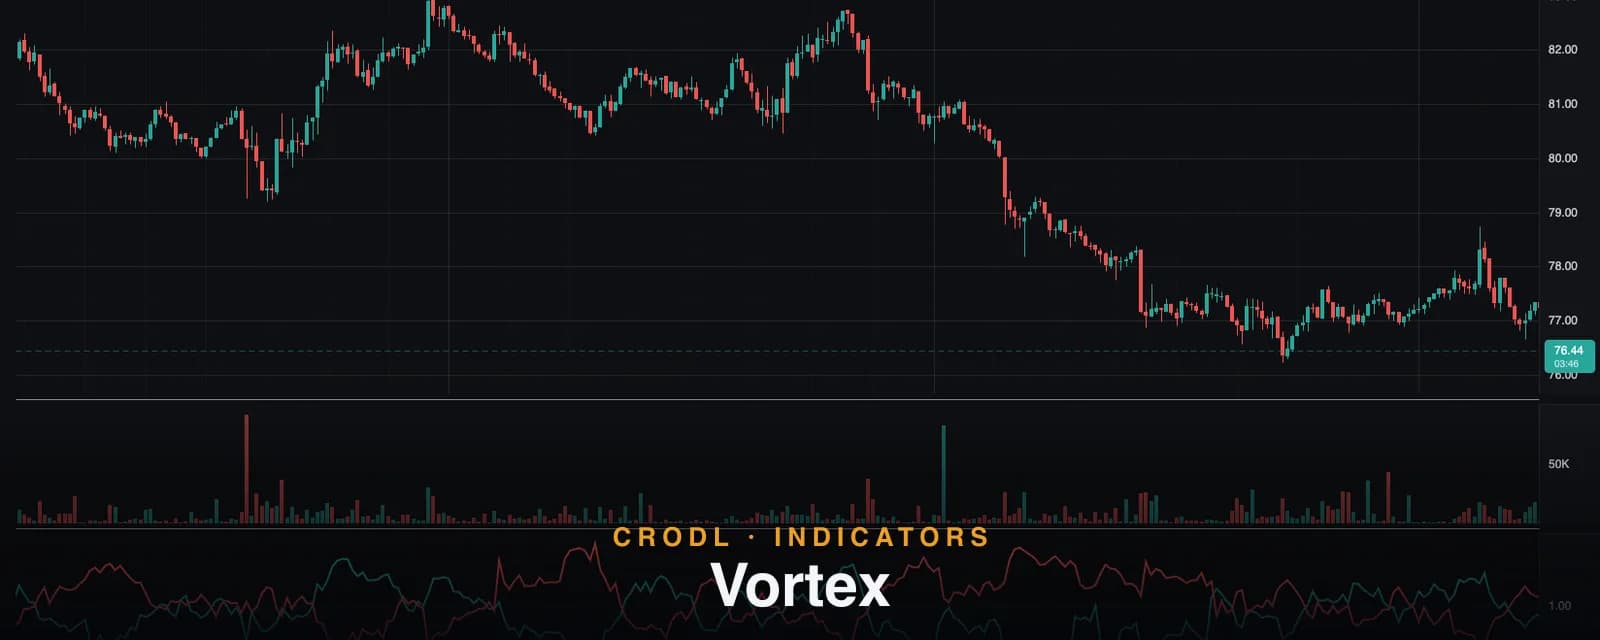
Vortex
The Vortex indicator tracks two lines, VI+ and VI−, built from bar-to-bar range extension. How Crodl's 14-period preset works and how to trade the crossovers.
Indicators
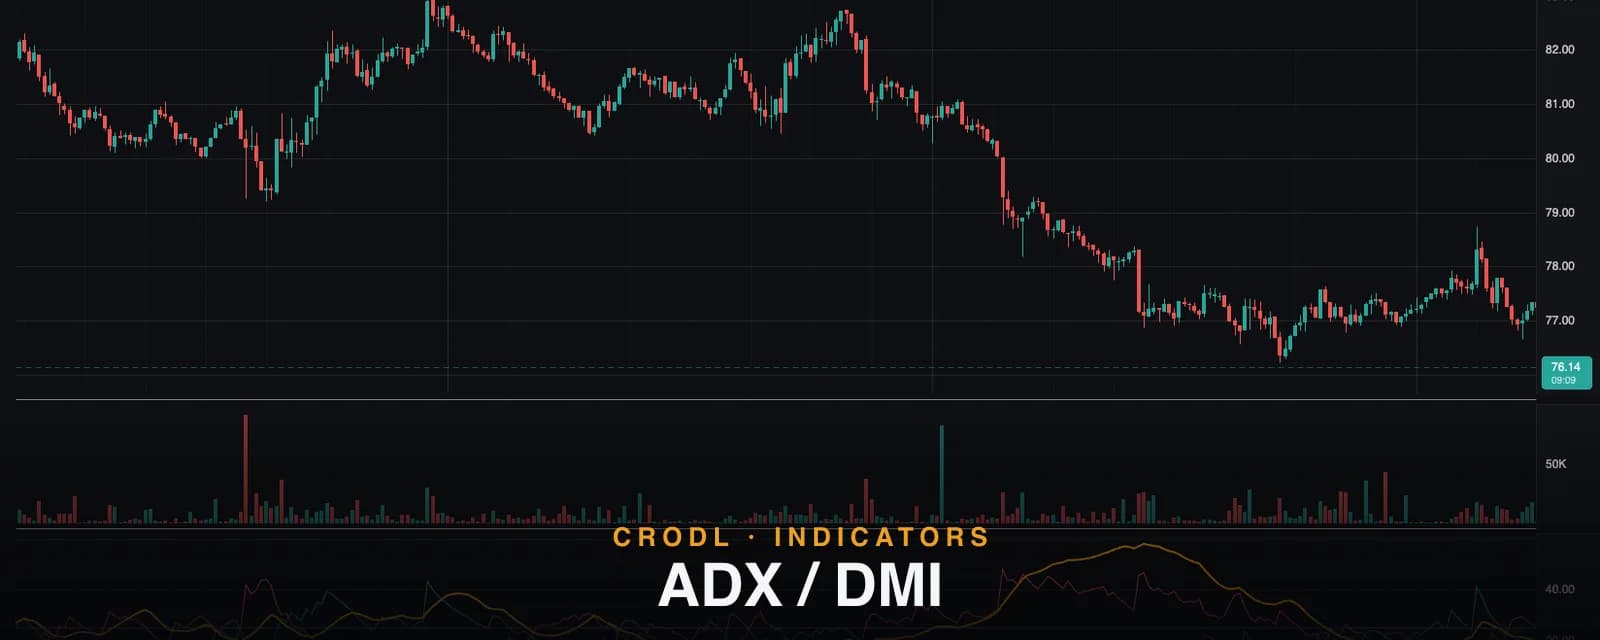
ADX / DMI
ADX measures how strong a trend is — never which way it points. How Crodl's ADX/DMI preset works, why the 25 line matters, and how +DI/−DI add direction.
Indicators
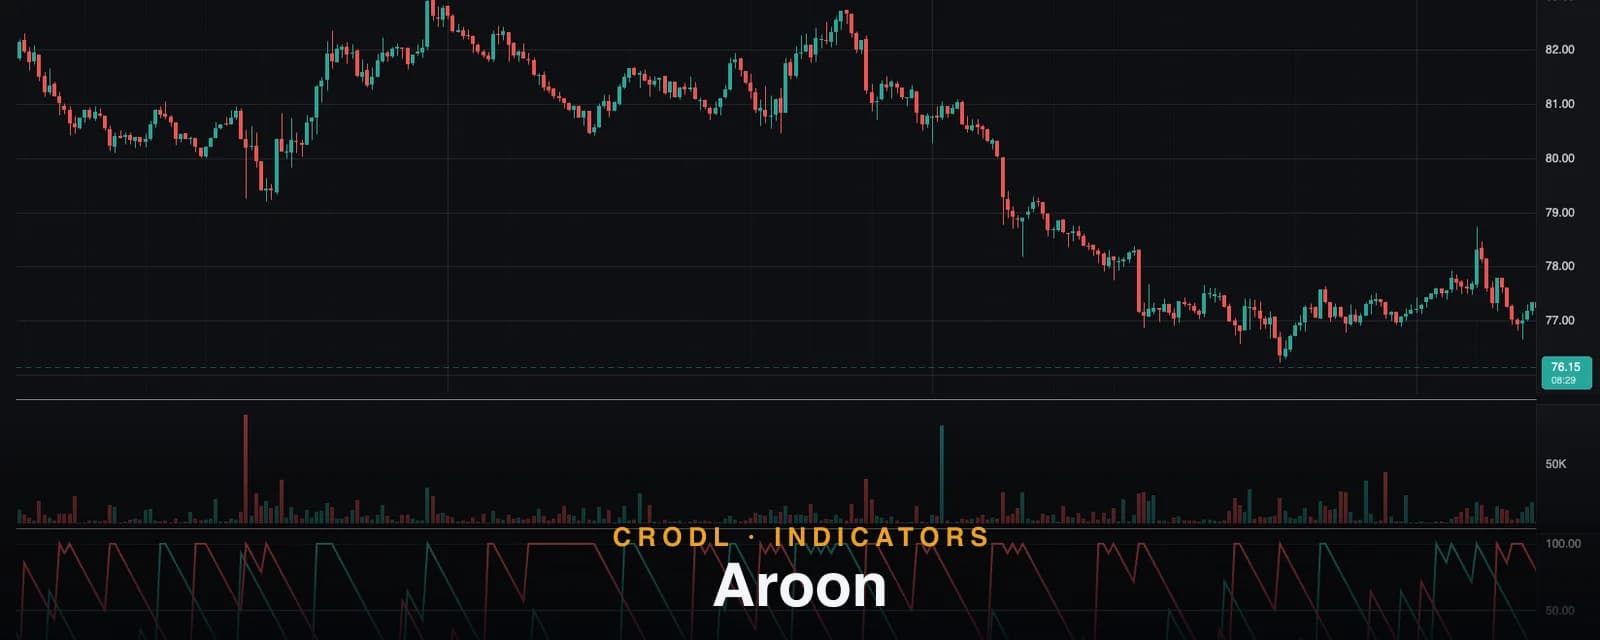
Aroon
Aroon measures time, not distance — how many bars since the highest high and lowest low. How Crodl's 14-period preset works and how to read the 0-100 lines.
Indicators
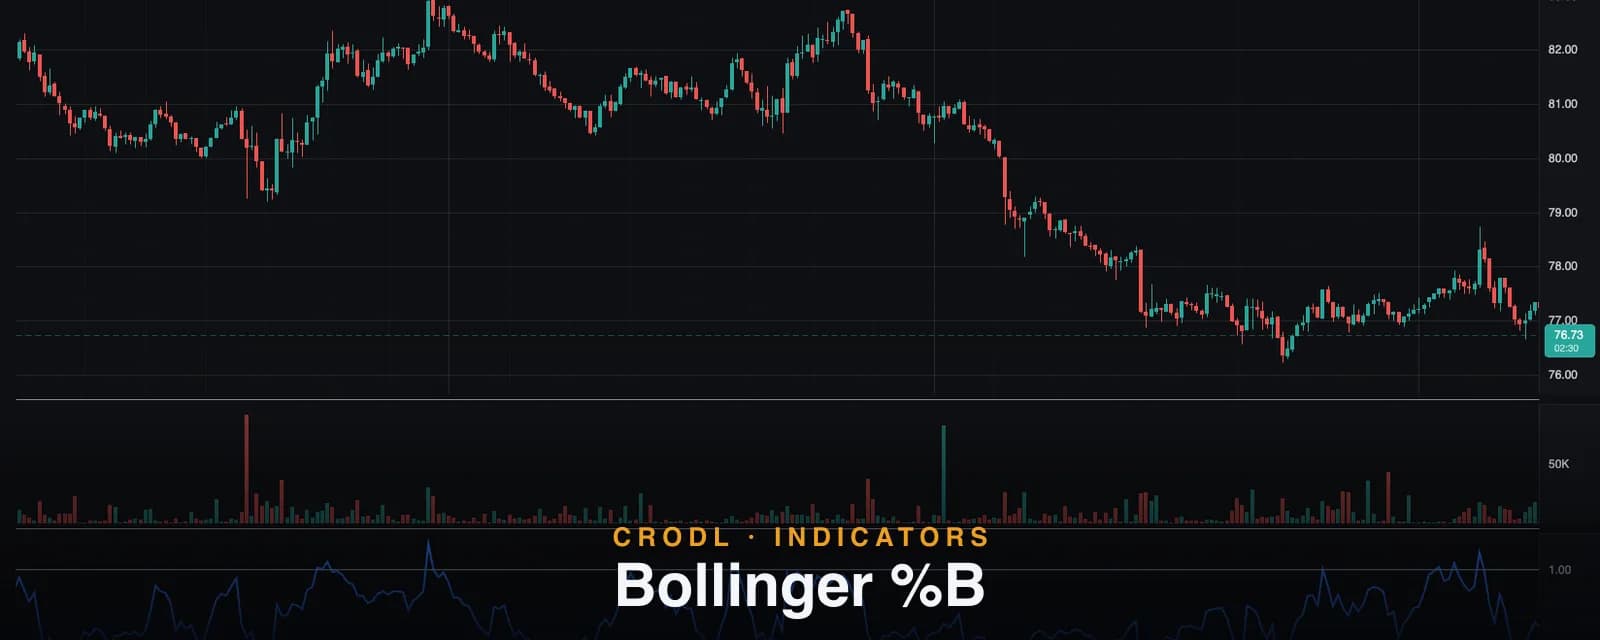
Bollinger %B
Bollinger %B turns band position into a single number, and Bandwidth gauges the squeeze. How Crodl's 20/2 preset works and how traders use both lines.
Trading
TradingView Webhook Automation: JSON Template for Crypto Trading
Use this TradingView webhook automation JSON template to send cleaner crypto trade alerts with side, symbol, size, TP/SL, and strategy ID fields.
Trading
Why Most Trading Journals Break, And How Strategy IDs Fix It
Most trading journals break once you scale in, scale out, and automate across the same symbol. Here is why that happens and how stable strategy IDs fix the grouping problem.
Trading
How to Automate Crypto Trades with TradingView Webhooks
Turn any TradingView alert into an automatic crypto trade on Bybit, Bitget, Blofin and more — no coding required. Set up in minutes with Crodl.
Trading
Why Trade on Multiple Crypto Exchanges?
Trading on multiple crypto exchanges reduces risk and unlocks better fees, more pairs, and built-in redundancy. Learn how Crodl makes multi-exchange trading effortless.
Educational
Risk Management Basics Every Crypto Trader Should Know
Learn the crypto risk management fundamentals that separate profitable traders from gamblers — position sizing, stop losses, risk-reward ratios, and portfolio allocation.