
Liquidity Zones
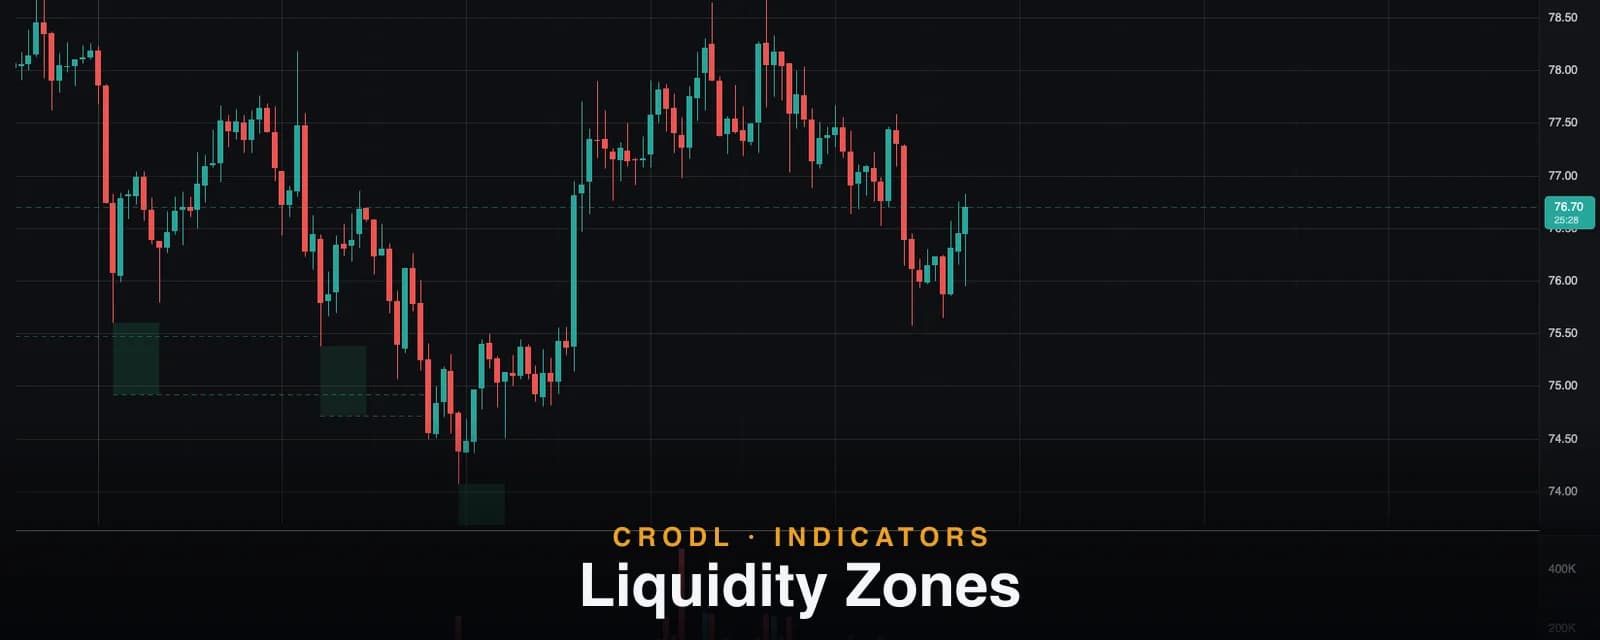
Liquidity Zones marks high-volume swing pivots and projects the stop clusters resting above highs and below lows, tracking each level until price grabs it.
Just beyond every meaningful swing high sits a pocket of orders: stops from the shorts who sold the swing, and breakout buy-orders from traders waiting for the level to give. Mirror that below every swing low. These pockets are liquidity — and the heavier the volume that built the swing, the more crowded the pocket behind it.
The Liquidity Zones indicator on the Crodl terminal finds the swings that formed on unusually heavy volume and projects a level just beyond each one — above the high, below the low — marking where that resting liquidity plausibly sits. Each level then lives its own lifecycle: it extends right until price finally trades through it, at which point the liquidity is "grabbed", the line turns dashed, and you have a record of the sweep. If you have read our post on Liquidation Levels, the logic will feel familiar — same magnet thinking, but seeded from stop-and-breakout liquidity at high-volume swings instead of leverage math.
What it shows — and why it matters
Two families of levels:
- Resistance liquidity (blue by default) — a level a measured distance above each qualifying pivot high. Price pushing up into it is running short-stops and triggering breakout longs: forced, price-insensitive buying.
- Support liquidity (green by default) — the mirror below each qualifying pivot low.
The value is in the two-stage story each level tells. While a level is live, it is a magnet and a likely wick target — markets are drawn toward dense resting orders. Once it is grabbed, the fuel is spent: what happens immediately after a grab (rejection or acceptance) is one of the most informative moments in price action, which is why the indicator keeps grabbed levels visible as dashed lines instead of deleting them.
How it works on the Crodl terminal
1. Pivot detection. A pivot high must be strictly the highest bar in a window of Length bars to its left (default 10) and Length − 2 bars to its right — so with defaults, a swing confirms 8 bars after it prints. Strictness (no ties allowed) rejects flat plateaus, so only clean swing points qualify. Pivot lows mirror.
2. The volume gate. Not every swing seeds a level — only the heavy ones. The pivot bar's volume is normalized by dividing its short moving average by a rolling 500-bar standard deviation of that average, which turns raw volume into a "how unusual is this?" score. The Volume strength setting picks the bar the score must clear:
| Volume strength | Normalized volume must exceed | Effect |
|---|---|---|
| Low (more zones) | 1 | Most swings qualify |
| Mid (default) | 2 | Clearly heavy swings only |
| High (fewer zones) | 3 | Only standout, event-grade swings |
3. Level placement. The level sits a volatility-scaled distance beyond the pivot. In the default Simple mode that distance is one ATR (200-period), so the level adapts to the market's current range — roughly where stops beyond the wick actually cluster, rather than one tick above it. Flip Dynamic distance on and the offset scales with the pivot's normalized volume instead: the heavier the swing, the further out its liquidity pocket is projected.
4. The grabbed lifecycle. Each level extends right from its pivot (with Extend to current bar on, the default, all live levels run to "now"). The moment a candle's range straddles the level — high above it and low below it — the liquidity is considered grabbed: the line stops extending, thins out, and turns dashed. Only the most recent Zones amount levels (default 10) are kept, so the chart always shows current structure rather than archaeology.
5. Markers and labels. A shaded box at the pivot spans from the swing price to its level, with opacity scaled by how heavy the pivot's volume was — heavier swings visibly read stronger. Show labels (off by default) adds the pivot's volume next to each live level and tags grabbed ones with "Grabbed".
How traders actually use it
Fade the grab
The classic sweep-and-reverse: wait for price to run through a live level — the straddle that flips it to dashed — then watch the very next candles. A sharp rejection back through the level means the pocket was consumed and the move had no interest beyond it; that is the entry, with a stop past the sweep's extreme. This pairs naturally with a market structure tool: a grab followed by a change of character is a textbook reversal sequence.
Keep your stops out of the pocket
The inverse discipline: the band between a swing and its projected level is exactly where clustered stops get harvested. If you are long against a swing low, placing your stop beyond the support-liquidity level — rather than between the low and the level — keeps you out of the wick whose whole purpose is to collect that pocket.
Grab-through as breakout confirmation
Not every grab reverses. When price straddles a level and then closes and holds beyond it, the pocket's forced orders became fuel in the breakout's direction. A grabbed resistance level that price accepts above — especially into a fresh Fair Value Gap or past an order block — reads as genuine expansion rather than a stop-run.
Settings that matter
- Length — pivot window size (default 10; confirmation takes Length − 2 bars). Larger = fewer, more major swings.
- Zones amount — how many recent levels stay on the chart (default 10).
- Volume strength — the quality gate; Mid by default, High for only the heaviest swings.
- Dynamic distance — volume-scaled level offset instead of the ATR default (off by default).
- Extend to current bar — run live levels to "now" (on by default).
An honest note on accuracy
Two limitations worth knowing. First, confirmation lag: a pivot needs Length − 2 bars to its right before it can qualify, so a level appears roughly 8 bars (at defaults) after the swing prints — inherent to any pivot tool, and the price of never repainting a swing. Second, warm-up: the volume normalization needs a full 500-bar statistical window, so on a freshly listed pair or a very high timeframe with limited history, few or no zones will appear until enough bars load. And as always: the levels are volatility-scaled estimates of where resting orders sit, derived from price and volume — not order-book data. Treat them as zones of interest, not exact prices.
Frequently Asked Questions
Why is the level above the high instead of at it?
Because the liquidity is not at the swing — it is behind it. Stops and breakout orders rest beyond the extreme, and the ATR offset (or volume-scaled offset in Dynamic mode) approximates where that pocket actually sits given current volatility. A level pinned to the exact high would be swept by ordinary noise.
Why did a line turn dashed?
Price straddled it — a candle traded both above and below the level, so the resting orders there are considered consumed. The level stops extending and stays on the chart as a dashed record of the sweep, which is often the most tradeable moment it produces.
Why do I see no zones on my chart?
Usually one of three reasons: not enough history is loaded yet (the volume filter needs ~500 bars to warm up), the Volume strength gate is set to High on a market without standout swings, or the recent swings simply were not heavy enough. Dropping strength to Low (more zones) is the quickest check.
Is this order-book or exchange liquidity data?
No — it is derived entirely from price structure and traded volume on the chart in front of you. That is a feature as much as a limitation: it works identically on every symbol and timeframe, needs no external feed, and updates instantly with the chart.
Put the pockets on your chart
Liquidity Zones is one click away on every Crodl terminal chart — add it from the indicator picker and trade with the map of high-volume swing liquidity in front of you, alongside live execution on six exchanges.
This article is for educational purposes only and is not financial advice. Leveraged trading carries substantial risk of loss. Always do your own research and never risk more than you can afford to lose.

Ready to automate your trading?
Connect your exchange, set up automations, and start trading smarter — all from one platform.
Start Trading Free