
Market Structure
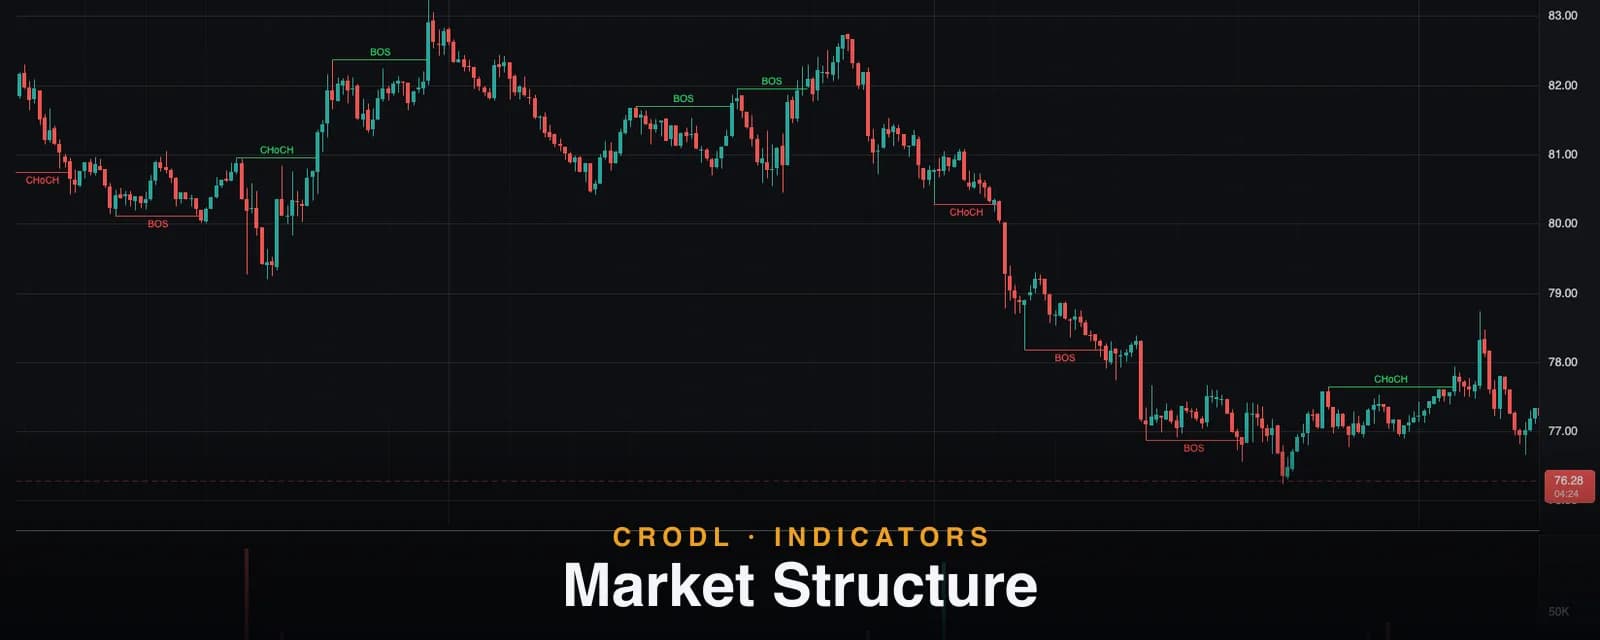
BOS and CHoCH tags drawn automatically from confirmed swing pivots. How Crodl's Market Structure indicator tracks trend objectively, and how traders trade the breaks.
Strip every indicator off your chart and a trend is still legible. An uptrend is simply a market that keeps breaking its swing highs while defending its swing lows; a downtrend is the mirror image. The moment that rhythm bends — a defended low finally gives way — is often the earliest structural evidence that the move is finished. Smart Money Concepts (SMC) traders formalize those moments into two events: the Break of Structure (BOS), which confirms the current trend, and the Change of Character (CHoCH), which warns it may be flipping.
The catch is that hand-marked structure is slow and quietly subjective — two traders can mark the same chart and disagree about half the swings. The Market Structure indicator on the Crodl terminal automates the whole loop: it confirms swing pivots with a strict, objective rule, tracks the two live structure levels, and stamps a BOS or CHoCH tag on the exact candle that broke them. This post explains what the tags mean, precisely how the detection works, and how traders build a process around them.
What market structure shows
Market structure is the ledger of a market's swing points. In a bull trend, each rally confirms a new swing high and each pullback carves out a swing low that holds. Two things can happen to that ledger:
- BOS (Break of Structure) — price closes through the most recent swing level in the direction of the prevailing trend: through a swing high while trending up, or a swing low while trending down. Structure is intact; the trend just re-confirmed itself.
- CHoCH (Change of Character) — price closes through the most recent swing level against the prevailing trend: through a swing low while trending up, or a swing high while trending down. The pattern that defined the trend just failed, which is the earliest structural reversal warning most traders will get.
A CHoCH is not a guaranteed reversal — plenty of them resolve into nothing more than a deep pullback. It is evidence, not a verdict, and the rest of this post is about how to weigh it.
How it works on the Crodl terminal
The indicator runs on whatever timeframe you are viewing, in five steps:
- Confirm swing pivots. A bar is a swing high only if its high is the strict maximum of every bar within
Swing lengthbars on both sides — ties reject, so a flat plateau never marks a pivot on every bar. Because the right half of that window has to close first, a pivot confirmsSwing lengthbars after it prints. There is no lookahead. - Track the live levels. The most recent confirmed swing high and swing low are the current structure levels. When a newer swing confirms, it replaces the older one.
- Detect breaks on closes. A candle close above the live swing high is a bullish break; a close below the live swing low is a bearish break. Wicks through a level do not count — a stop-run wick that closes back inside leaves structure untouched.
- Classify BOS or CHoCH. The indicator keeps a running trend state. A break that continues the current trend prints BOS; a break that flips it prints CHoCH. The first break on a fresh chart, before any trend exists, counts as a BOS.
- Consume the level. A broken level is spent. A fresh swing must confirm before another break can print in the same direction, so a single high can never spam repeated BOS tags.
Each event is drawn as a horizontal line from the swing pivot to the candle that broke it, tagged BOS or CHoCH — green above the line for bullish breaks, red below it for bearish ones. Enable Show swing marks and the confirmed pivots themselves appear as small gray dots, which is the fastest way to audit why a tag did or did not print.
| Tag | Prevailing trend | What broke | Standard reading |
|---|---|---|---|
| BOS (bullish) | Up, or none yet | Close above the last swing high | Uptrend confirmed or continuing |
| BOS (bearish) | Down, or none yet | Close below the last swing low | Downtrend confirmed or continuing |
| CHoCH (bullish) | Down | Close above the last swing high | Downtrend character broken — possible reversal up |
| CHoCH (bearish) | Up | Close below the last swing low | Uptrend character broken — possible reversal down |
Settings that matter
- Swing length (default 10) — bars required on each side of a pivot. Larger values track only major structure; smaller values catch every minor shift and tag far more often.
- Show swing marks (default off) — draw the confirmed pivot dots the logic actually runs on.
- Max events drawn (default 60) — how many recent break lines stay on the chart.
- Bull / bear colors — the line and tag palette per direction.
How traders use it
As a trend filter
The simplest use is directional discipline: only take longs while the latest breaks are bullish BOS events, only shorts while they are bearish. It costs you the exact top and bottom, and in exchange it keeps you out of counter-trend bleed — usually a good trade.
CHoCH plus confluence
A CHoCH alone is a warning, not an entry. The classic SMC sequence is CHoCH first, then a retracement into a zone created by the reversal leg — an order block or the discount half of the new dealing range — with the CHoCH providing the directional license for the trade.
Reading breaks against liquidity
Not every break is honest. A close through a cluster of equal highs can be a liquidity grab that immediately fails; when the next tag is a CHoCH straight back the other way, the "breakout" was probably a sweep. The close-based rule already filters pure wick-runs, but the sequence of tags around obvious liquidity tells you who just got trapped.
Multi-timeframe structure
A common workflow: read bias from structure on the 4-hour or daily, then drop to a 5–15 minute chart and wait for a lower-timeframe CHoCH in the direction of the higher-timeframe trend. Because the rule is identical on every timeframe, the two reads never disagree about definitions.
Frequently Asked Questions
Does it repaint?
A pivot needs Swing length closed bars on each side, so pivots only appear once confirmed and never move afterwards. Break tags are evaluated against the live close while a candle forms, so a tag can appear intra-bar and retract if the candle closes back inside the level — once the bar closes, the event is final and immutable.
What swing length should I use?
The default of 10 suits most intraday and swing charts. Scalpers drop toward 3–5 (more events, more noise); position traders raise it to 15–20 so only major structure tags. There is no "correct" value — it defines what you consider a swing.
Why didn't an obvious reversal print a CHoCH?
Three common reasons: the opposing swing had not confirmed yet (confirmation takes Swing length bars), the level in that direction was already consumed by an earlier break and no fresh swing had formed, or price only wicked through the level without closing beyond it.
A BOS just printed — is that an entry signal?
Structure tools are context, not triggers. A BOS says the trend is intact; most traders use it to hold or add with the trend and then look for entries at pullback zones, rather than chasing the break candle itself.
Put structure on autopilot
Market Structure ships with every Crodl terminal chart — add it from the indicator picker and every BOS and CHoCH on your pair is tagged in real time, on any timeframe, alongside live trading on six exchanges.
This article is for educational purposes only and is not financial advice. Leveraged trading carries substantial risk of loss. Always do your own research and never risk more than you can afford to lose.

Ready to automate your trading?
Connect your exchange, set up automations, and start trading smarter — all from one platform.
Start Trading Free