
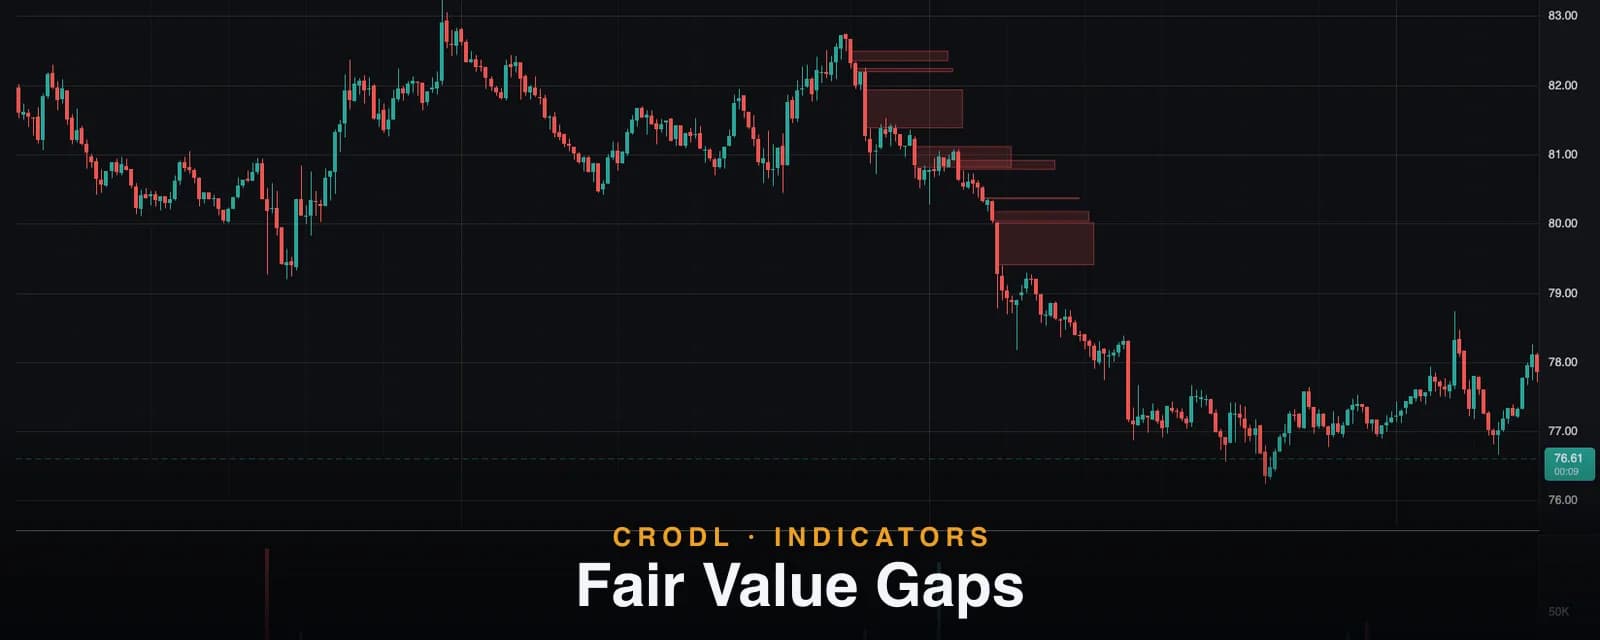
Fair Value Gaps
Fair Value Gaps mark three-candle imbalances that price tends to revisit. See how Crodl detects them, how Close vs Wick fill works, and how to trade iFVG inversions.
Crypto does not move smoothly — it lurches. When aggressive buyers or sellers push price so hard that an entire band of prices gets skipped in a single candle, that band traded almost entirely one-sided. Orders that would normally have been filled there never were. Traders call that band a Fair Value Gap, and markets have a well-documented habit of coming back to it.
The FVG indicator on the Crodl terminal finds every one of these gaps automatically, draws it as a box on your chart, tracks whether it has been filled, and — if you want — flips filled gaps into inverse zones that often act as fresh support or resistance. This post covers exactly how the detection works, what the fill modes mean, and the plays traders actually run off these boxes.
What a Fair Value Gap shows — and why price revisits it
The definition is strict and mechanical, which is what makes it tradeable. Take any three consecutive candles A, B, C:
- Bullish FVG — candle C's low is above candle A's high. The middle candle B moved up so violently that the band between A's high and C's low never traded on the way up. That band is the gap.
- Bearish FVG — the mirror: candle C's high is below candle A's low.
Why does price come back? An FVG is an inefficiency — a stretch of prices where one side barely participated. Limit orders resting there were skipped, market makers are lopsided, and late entrants want the retrace. In practice, bullish gaps below price frequently act as support on the first retest, and bearish gaps above price act as resistance. This is a core building block of the smart-money-concepts toolkit, alongside order blocks and market structure shifts.
How the FVG indicator works on the Crodl terminal
Detection runs on your chart timeframe, on every candle, and each gap becomes a box anchored at the middle candle of its three-candle pattern. From there, the indicator walks forward and manages each box's lifecycle:
Fill modes. A gap counts as filled when price trades through its far side — the edge opposite where price left it. The Wick fill (off = Close) toggle (default off) picks the standard:
- Close mode (default) — a candle must close beyond the far side. A wick that stabs through and recovers does not fill the gap. Stricter, less noisy.
- Wick mode — a single touch by a wick fills it. Faster, and closer to how liquidity is actually consumed.
What happens on fill. With default settings (Delete filled on), a filled box simply disappears, so your chart only ever shows live, unfilled gaps. Turn Delete filled off and filled boxes stay, cut off at the bar that filled them — useful for reviewing how price interacted with past gaps.
Inversions. Turn on Show Inverse FVG (default off) and a filled gap does not die — it inverts. A bullish gap that price closed below becomes a bearish iFVG, drawn in its own color, and now marks likely resistance; a filled bearish gap becomes a bullish iFVG support zone. The inverted zone lives until price trades back through it. This is the classic support-becomes-resistance logic, applied to imbalances.
| Zone | Appears when | Typical role | Ends (or inverts) when |
|---|---|---|---|
| Bullish FVG | C's low > A's high | Support on retrace | Price fills through the gap's bottom |
| Bearish FVG | C's high < A's low | Resistance on retrace | Price fills through the gap's top |
| Bullish iFVG | A bearish FVG fills upward | Fresh support | Price trades back below the zone |
| Bearish iFVG | A bullish FVG fills downward | Fresh resistance | Price trades back above the zone |
Box drawing. By default each box runs Box length bars (default 20) from its anchor and stops — the TradingView convention. Flip Extend boxes on and every live box stretches to the current bar instead, so all unfilled gaps share one right edge at "now". Bullish gaps draw teal, bearish red; iFVGs get their own blue/orange palette so you can tell fresh imbalance from inverted at a glance. Show labels (default off) adds a small FVG/iFVG tag inside each box.
How traders actually use it
The retrace entry
The bread-and-butter play: in an uptrend, wait for price to retrace into a bullish FVG below, enter inside the gap, and place the stop just beyond its far side — because a true fill through the far side is exactly the event that invalidates the zone. The gap gives you a defined entry band and a defined invalidation, which is most of what a trade plan is.
The iFVG flip
Enable Show Inverse FVG and watch what happens after a gap fails. A bullish gap that price sliced through was demand that got consumed — when price rallies back into that same band, it routinely gets rejected. Trading the first retest of a fresh iFVG is a clean continuation entry in the direction of the fill.
Stacked gaps as confluence
One gap is a level; three overlapping gaps are a zone the market has skipped repeatedly. Stack the FVG boxes with a liquidity level or a volume shelf and you get the kind of confluence where multiple independent tools agree — the setups worth sizing.
Settings that matter
- Show FVG / Show Inverse FVG — the two zone families; iFVG is off by default.
- Wick fill (off = Close) — how strict a fill must be. Close is the default and the conservative choice.
- Box length — bars each box extends from its anchor (default 20).
- Extend boxes — stretch every live box to the current bar instead.
- Delete filled — remove filled boxes entirely (default on).
An honest note on gaps
A gap only exists once its third candle closes — the indicator cannot show you an imbalance before the pattern that defines it is complete. On the live bar, a Close-mode fill is judged against the current close, so a box can flicker between filled and live until that bar actually closes; its state is final at the close. And no gap is a guarantee: in strong trends, gaps get blown through without a second look. The box marks where the imbalance is, not a promise that price will respect it.
Frequently Asked Questions
Do Fair Value Gaps always get filled?
No — and "always fills eventually" is not a trading edge, because eventually can be months away. The tradeable observation is that the first retest of a fresh gap frequently produces a reaction. Treat the box as a reaction zone with defined invalidation, not a certainty.
Should I use Close or Wick fill mode?
Close mode (the default) keeps zones alive through wicky stop-runs, which suits swing trading. Wick mode kills a zone on any touch of the far side, which is closer to literal liquidity consumption and suits faster intraday styles. Pick one and stay consistent — they produce different zone populations.
What is an Inverse FVG exactly?
A filled gap flipped into an opposite zone. The demand (or supply) the gap represented was consumed when price traded through it, so the same band now tends to act the other way. On Crodl, filled bullish gaps become bearish iFVG resistance and filled bearish gaps become bullish iFVG support, each drawn in a distinct color.
Which timeframes work best?
All timeframes produce valid gaps — the mechanics are identical. Low timeframes produce many small gaps (most noise), higher timeframes fewer, more significant ones. A common approach: mark gaps on the 1h–4h, execute entries on the 5m–15m. If you want fewer, higher-quality gaps on one chart, the FVG Profiles and Quiet-Zone FVG studies exist precisely to filter this firehose.
Put the gaps on your chart
The FVG indicator is one click away on every Crodl terminal chart — add it from the indicator picker and every imbalance on your pair is boxed, tracked, and cleaned up automatically while you trade live on six exchanges.
This article is for educational purposes only and is not financial advice. Leveraged trading carries substantial risk of loss. Always do your own research and never risk more than you can afford to lose.

Ready to automate your trading?
Connect your exchange, set up automations, and start trading smarter — all from one platform.
Start Trading Free