
FVG Profiles
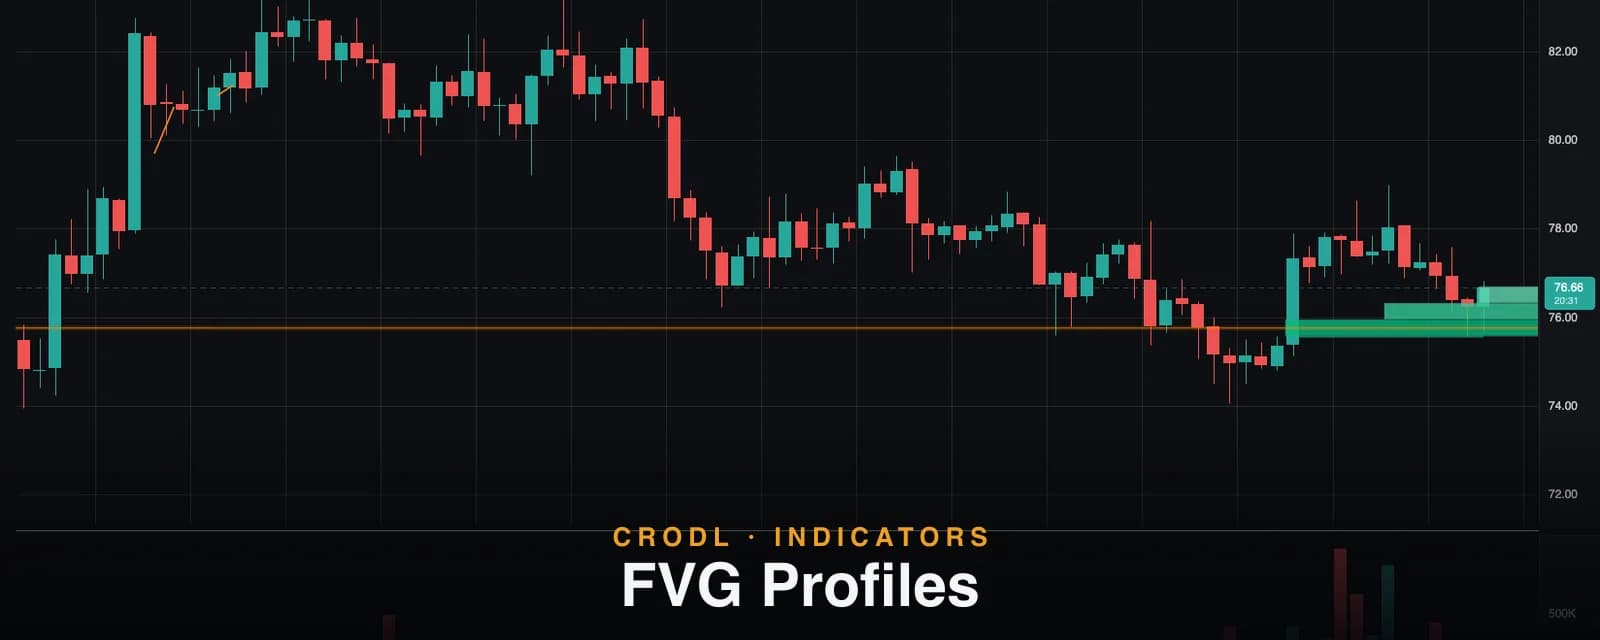
FVG Profiles filters fair value gaps by time-of-day significance, decays them by traded volume, and maps the liquidity still left inside as a KDE histogram.
A standard Fair Value Gap indicator treats every gap the same: detected the same way, drawn the same size, and killed by a single binary event — filled or not. That leaves two questions unanswered. Was this gap actually unusual, or just normal churn for this hour of the trading day? And when price trades back into a gap without fully filling it, how much of the imbalance is really left?
FVG Profiles on the Crodl terminal answers both. It only keeps gaps that are statistically significant for their time of day, gives each surviving gap a volume budget that gets eaten as price trades back through it, and then aggregates whatever is left into a live volume-at-price histogram at the right edge of your chart — with automatic level lines through the peaks. The result reads less like a pile of boxes and more like a map of where unfinished business is concentrated.
What it shows — and why it matters
Three layers, all derived from the same pipeline:
- Significant FVG boxes — the gaps that passed the statistical filter, shrinking and fading as their volume budget is consumed.
- A right-margin histogram — the surviving gaps' remaining volume, bucketed by price and smoothed, so you can see at which prices unmitigated imbalance is stacked.
- Gap-zone lines — horizontal levels cast across the chart through the histogram's local peaks: the specific prices where leftover gap liquidity is densest.
Why it matters: raw FVGs are plentiful and mostly noise, especially intraday. What you actually want to know is which gaps were abnormal when they formed and how much of each is still unconsumed — because a gap that has already absorbed most of its volume on partial retests is close to spent, while a fresh, heavy, untouched gap is still a magnet. This is the same "where is the volume" thinking as a Volume Profile, applied only to imbalances.
How it works on the Crodl terminal
The pipeline runs in four stages on your chart timeframe:
1. Detection. The same strict three-candle imbalance as the standard FVG study: bullish when a candle's low clears the high from two bars earlier, bearish when its high is below the low from two bars earlier.
2. Time-of-day significance filter. The indicator keeps a rolling memory — the last Time-of-day memory samples (default 5) — of gap heights and candle volumes for each intraday time slot. A new gap survives only if both its height and its middle candle's volume are unusual versus that slot's recent history, measured as a z-score against the slot's average. You choose how unusual with two dropdowns, Gap strictness (z-score) and Volume strictness (z-score) (both default Low):
| Strictness | Z-score bar | What survives |
|---|---|---|
| None | Filter disabled | Every detected gap |
| Low | ≥ 0 | Above the slot's recent average |
| Medium | ≥ +0.5σ | Clearly above average |
| High | ≥ +1σ | Unusual gaps only |
| Extreme | ≥ +2σ | Rare, standout events |
Because the memory is per-time-of-day, a gap at 14:00 UTC is compared against recent 14:00 UTC behavior — so the daily volume rhythm (dead Asian lull, loud US open) doesn't distort the filter. On daily and higher timeframes every bar falls into one slot, and the filter gracefully becomes a single global baseline.
3. Volume-decay mitigation. Each surviving gap is seeded with a volume budget from its middle candle. When a later candle overlaps the gap, volume proportional to the price overlap is subtracted from the budget and the box shrinks from the traded side — its fill fading as the budget drains. A gap dies when its budget is spent, when it collapses to nothing, when price trades beyond its original far side (a full mitigation), or when it exceeds Max FVG age (bars) (default 500). Only the newest Max FVGs gaps (default 20) are tracked at once.
4. Histogram and gap zones. The remaining bull/bear budgets of all live gaps are bucketed into Profile bins (default 50) across their combined price range, smoothed with an Epanechnikov kernel (KDE smoothing, default 2.5), and drawn right-aligned at the chart's right margin — Histogram width (bars) wide (default 20), colored by each bin's dominant side. Local peaks at or above the Gap zone percentile (default 80) each cast an orange level line left across the chart. Those lines are the punchline: the exact prices where surviving imbalance is thickest.
How traders actually use it
Trade the fattest fresh gap, not the nearest one
With Box volume text on (default), every box shows its remaining budget. When price approaches two gaps, the one holding most of its original volume is the one that historically produces the stronger reaction — the nearly-drained box is background noise. This single readout replaces a lot of squinting at candle history.
Gap-zone lines as targets and reaction levels
The orange lines mark where leftover imbalance stacks across multiple gaps. They behave like high-volume nodes on a volume profile: natural take-profit targets when price is traveling toward them, and levels to expect a fight at when price arrives. Pairing them with Liquidity Zones shows you both sides of the story — where resting stops sit and where unfinished imbalance waits.
Tighten strictness to match your timeframe
On a 1m–5m chart, Low/Low strictness still passes plenty of gaps. Swing traders working intraday charts commonly push both filters to Medium or High so only genuinely anomalous imbalances — the ones worth planning a day around — remain. The time-of-day baseline means you can do this without the filter being fooled by the market's daily volume cycle.
Settings that matter
- Gap strictness / Volume strictness — the two z-score gates; both must pass. The main quality dial.
- Max FVGs / Max FVG age — how many gaps are tracked and for how long (defaults 20 and 500 bars).
- Profile bins / KDE smoothing — histogram resolution and smoothing (defaults 50 and 2.5).
- Gap zone percentile — how dominant a histogram peak must be to cast a level line (default 80).
- FVG boxes / Master histogram / Gap zones / Box volume text — independent visibility toggles, all on by default.
An honest note on the math
The volume budgets are estimates, not order-flow data. Attribution assumes a candle's volume is spread evenly across its range, so the "eaten" amount is proportional to price overlap — a reasonable model, not tape reading. The significance filter also warms up permissively: with fewer than two samples in a time slot's memory there is no deviation to measure, so early gaps pass by default until the per-slot history fills in. And the whole study needs real volume data — on a feed without it, the filter and budgets degrade.
Frequently Asked Questions
How is this different from the plain FVG indicator?
The standard FVG study shows every gap and uses a binary filled/unfilled lifecycle — ideal for clean SMC structure work. FVG Profiles is the analytical sibling: it filters for statistically significant gaps, mitigates them gradually by traded volume, and adds the histogram plus gap-zone lines. Many traders run the plain study for structure and switch to Profiles when deciding which zones deserve orders.
Why did a box shrink instead of disappearing?
That is the volume-decay model working. A partial retest ate part of the gap's budget, so the box contracted from the traded side and its fill faded. It only disappears entirely when the budget is spent, price fully mitigates past its original far side, it collapses, or it ages out past 500 bars.
What exactly are the orange lines?
Histogram peaks, promoted to levels. Any local maximum in the smoothed profile at or above the 80th percentile (configurable) casts a horizontal line across the chart. They update as gaps drain and new ones form.
Does it work on daily charts?
Yes. The time-of-day machinery collapses to a single global baseline on daily-and-up timeframes, so strictness is measured against recent daily behavior overall. Detection, decay, histogram, and gap zones all work unchanged.
See where the imbalance still lives
FVG Profiles ships on every Crodl terminal chart — add it from the indicator picker and you get filtered gaps, live mitigation, and an imbalance profile on any pair across six exchanges, no extra data feed required.
This article is for educational purposes only and is not financial advice. Leveraged trading carries substantial risk of loss. Always do your own research and never risk more than you can afford to lose.

Ready to automate your trading?
Connect your exchange, set up automations, and start trading smarter — all from one platform.
Start Trading Free