
Bull Flag & Bear Flag: Automatic Continuation-Pattern Detection
How Crodl's Bull Flag and Bear Flag detectors find the flagpole, measure the consolidation channel, and confirm the breakout — continuation patterns drawn mechanically, only after they complete.
The flag is the pattern traders trust most and draw worst. A sharp move, a tidy pullback, a breakout in the original direction — everyone knows the shape. The trouble is that in the moment, every pullback looks like a flag, and most are just the start of a reversal. The pattern is real; the eyeballing is where the money leaks.
The Bull Flag and Bear Flag detectors on the Crodl terminal apply the definition mechanically. They require a genuine impulse for the flagpole, a shallow bounded consolidation for the flag, and — the part that separates a flag from wishful thinking — an actual breakout close resuming the trend before anything is drawn. Nothing appears on your chart until the pattern has completed and broken out.
What the detectors show
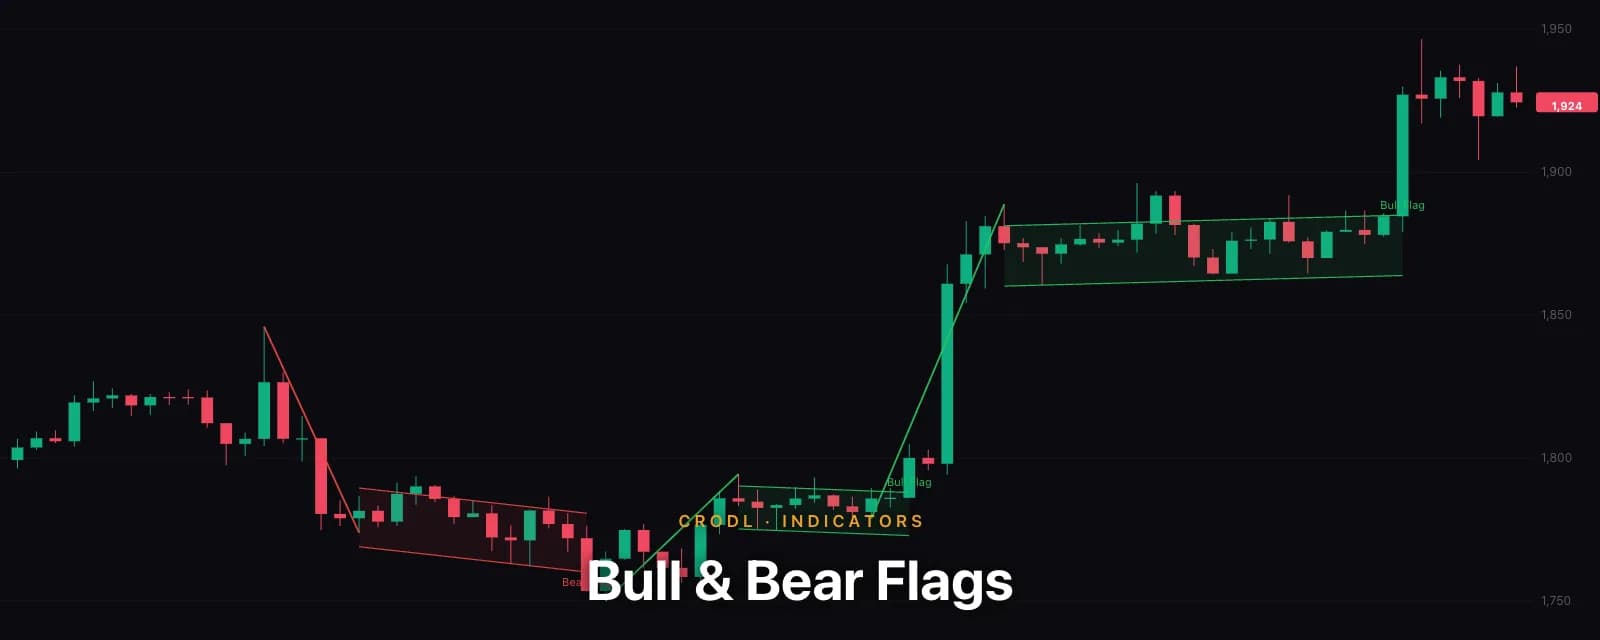
A flag has three parts, and the study draws all three:
- The flagpole — the impulse leg, drawn as a bold line from the swing that launched the move to its peak. A bull flag's pole runs up; a bear flag's runs down. This must be a real move: at least three times the current ATR, over a limited number of bars. A slow grind never qualifies.
- The flag — the consolidation, drawn as a shallow parallel channel that drifts against the pole. After a bull-flag pole, price eases down or sideways inside a small descending channel; after a bear-flag pole, it grinds up. The channel must hold beyond the pole's midpoint — a pullback that gives back more than half the pole is a reversal, not a flag, and is rejected.
- The breakout — the first candle that closes back through the pole's apex in the trend's direction. That close is the confirmation, and it's where the label ("Bull Flag" / "Bear Flag") is drawn.
Bull flags are green, bear flags red. They join the existing Chart Patterns family — tops, bottoms, rectangles — in the same picker, so you can run the reversal and continuation catalogs together or one flag type on its own.
How detection works on the Crodl terminal
The detectors reuse the Chart Patterns engine's swing pivots and ATR series, then apply flag-specific structure:
- Pole — a swing low followed by the next swing high (bull), spanning at least 3× ATR over no more than ~25 bars. The ATR gate is what makes the pole an impulse rather than a drift, and it scales automatically with each market's volatility.
- Flag — the bars after the apex are scanned forward. Two things invalidate the flag: price giving back more than half the pole (too deep — it's reversing), or breaking out before it has consolidated for a few bars (no flag — the pole just continued). What survives is a real, bounded pause.
- Channel fit — the consolidation's highs are fit with a least-squares line for the upper rail, and a parallel lower rail is placed at the deepest low. That's the sloped band you see drawn, matching how the flag actually leans.
- Breakout — the first close beyond the apex (with an ATR-scaled buffer) confirms and dates the pattern.
Because the confirmation is a close beyond the pole apex — not merely a touch of the channel line — the detector is deliberately strict. You get fewer flags than you could hand-draw, and the ones you get already resolved.
How traders use it
The continuation entry and the retest
The textbook flag trade is the breakout: enter as price closes out of the consolidation in the pole's direction, stop below the flag's lower rail (above the upper, for bear flags). Because the study only prints the flag at the breakout, the pattern and the trigger arrive together. The lower-risk variant waits for the retest — price often returns to the broken rail before continuing, offering a tighter stop against the same target.
The measured move
Flags project: the classic target is the flagpole's height added to the breakout point. The study draws the pole explicitly, so the measurement is right there — measure the pole, project it from the breakout, and you have a first objective. Levels from Liquidity Zones or Session Levels tell you which projected targets actually have something to trade against.
Flags as trend-health checks
A trend that prints clean flag after clean flag — each pole holding, each consolidation shallow — is a healthy trend you want to stay with. When the flags stop breaking out, or the pullbacks start cutting deeper than half the pole (so the detector stops drawing them), the character has changed. The absence of new flags in a former flag-machine is information.
Confluence with the pole's own channel
A bull flag riding the lower rail of an Auto Channel up-channel is the same continuation story told twice — the micro pause inside the macro trend. When the flag breakout and the channel both point the same way, the read is as clean as price action gets.
Honest limitations
Flags are continuation patterns, and continuation is a probability, not a promise — a confirmed flag still fails when the broader move is exhausted. The detector is strict by design: requiring a close beyond the pole apex means it misses flags that break their channel line but stall below the apex, and it prints the pattern a candle or two later than an aggressive hand-drawer would. The flagpole is anchored to swing pivots, so an impulse that starts mid-bar without a clean pivot low may measure slightly short. And the study reads price only — the volume dry-up during the flag and surge on breakout that textbooks prize is left for your eyes, because volume data quality varies too much across venues to gate a pattern on.
Frequently Asked Questions
What's the difference between a flag and the Auto Channel or Rectangle?
Scope and intent. A flag is a small counter-trend consolidation tied to a specific impulse pole, and it's a continuation signal. Auto Channel draws the channel around the trend leg itself, and a Rectangle is a horizontal range whose direction isn't known until it breaks. A flag always knows its expected direction — the pole's — before the breakout.
Does it repaint?
No. A flag is only drawn once price closes beyond the pole apex, and that breakout bar is fixed. You will never see a half-formed flag that later vanishes — the trade-off is that the pattern appears at confirmation, not while it's still forming.
Why didn't my obvious flag get detected?
Most often one of three reasons: the pole wasn't steep enough (under 3× ATR — a drift, not an impulse), the pullback was too deep (gave back more than half the pole, so it read as a reversal), or price never closed back beyond the pole's high/low (it broke the channel line but stalled). The detector holds out for all three.
Can I show only bull flags, or only bear flags?
Yes. Each is its own entry in the indicator picker — add Bull Flag alone, Bear Flag alone, or both, and they sit alongside the rest of the Chart Patterns catalog. Selecting "All" in a Chart Patterns instance includes flags too.
Let the pole prove itself first
Bull Flag and Bear Flag are one click away in the indicator picker on every Crodl terminal chart. Put them on a trending pair, and instead of talking yourself into every pullback, let the detector wait for the impulse, the pause, and the break — and only then call it a flag.
This article is for educational purposes only and is not financial advice. Leveraged trading carries substantial risk of loss. Always do your own research and never risk more than you can afford to lose.

Ready to automate your trading?
Connect your exchange, set up automations, and start trading smarter — all from one platform.
Start Trading Free