
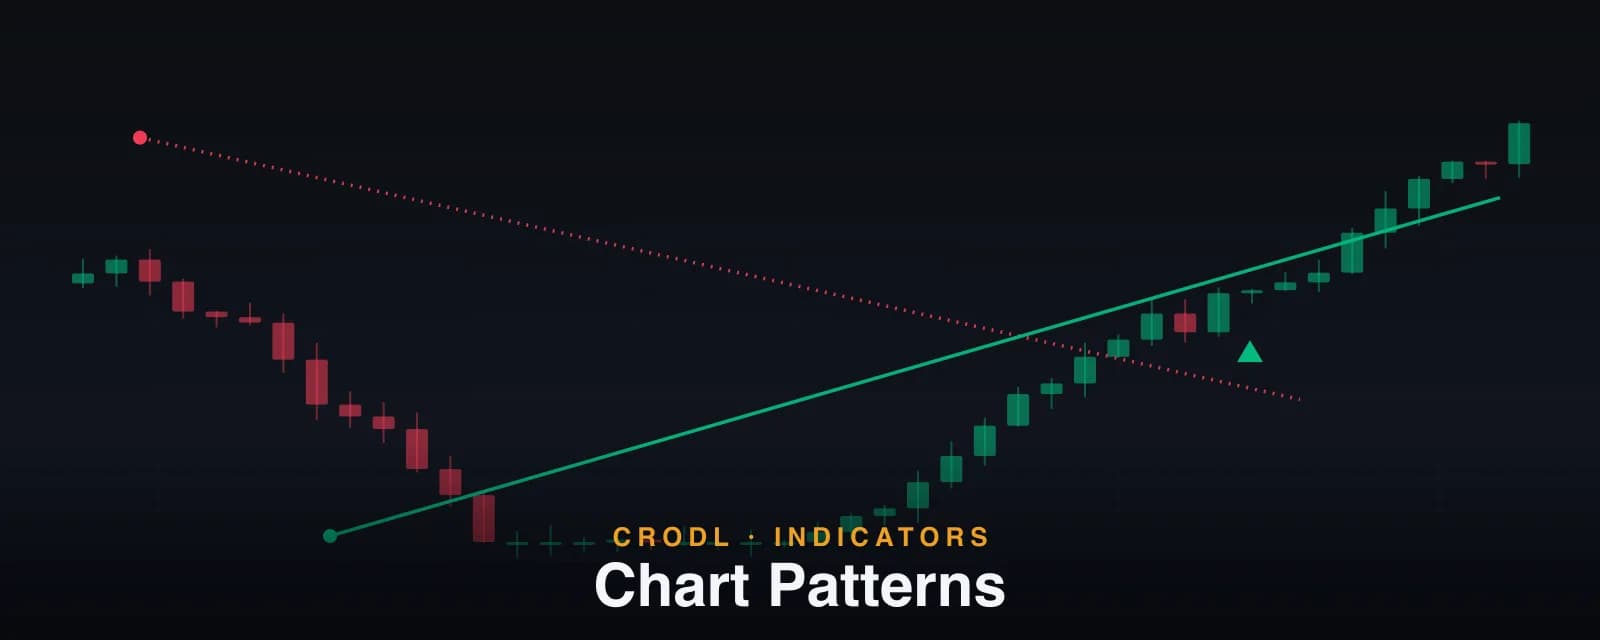
Chart Patterns: Automatic Double Top, Double Bottom and Rectangle Detection
How Crodl's Chart Patterns study finds double and triple tops and bottoms plus rectangles from swing pivots, with ATR-scaled tolerance and breakout confirmation.
Double tops and double bottoms are among the oldest, most cited structures in technical analysis — and among the most abused. Stare at any chart long enough and you can convince yourself two swings are "equal," a neckline exists, and a reversal is due. The pattern is real; the human application is where the edge dies.
The Chart Patterns study on the Crodl terminal applies the definitions mechanically. It builds swing pivots from the price series, matches them with a volatility-scaled tolerance, enforces the structural requirements a genuine pattern needs — a real prior trend, a real pattern height, no escaping legs — and only draws the pattern once price actually confirms it by closing through the required breakout level.
That last part is the study's defining honesty: you will never see a hopeful, half-formed pattern on your chart. Everything it draws completed and broke out.
What the study shows
The reversal and range formations are: double tops and triple tops (bearish), double bottoms and triple bottoms (bullish), and rectangles (direction decided by whichever side price breaks). Each draws as a translucent box spanning the pattern's full price band from its first pivot to the breakout bar, with a zigzag line tracing the actual pivots that formed it and a label at the breakout naming the pattern. The same family also detects continuation flags — see Bull Flag & Bear Flag — and the sweep-reversal W & M patterns, the liquidity-grab variant of the doubles.
Bullish patterns are green, bearish red, by default, and the chart keeps the most recent Max patterns drawn detections (default 20).
| Pattern | Pivot structure | Direction | Confirmed when |
|---|---|---|---|
| Double Top | High – low – high (peaks match) | Bearish | Close below the valley between the peaks |
| Double Bottom | Low – high – low (troughs match) | Bullish | Close above the peak between the troughs |
| Triple Top | Three matching highs, two valleys | Bearish | Close below the lower valley |
| Triple Bottom | Three matching lows, two peaks | Bullish | Close above the higher peak |
| Rectangle | Four alternating touches of a flat band | Either | Close beyond either boundary |
| Bull Flag | Upward impulse, then a descending or near-flat channel | Bullish | Close above the pole apex |
| Bear Flag | Downward impulse, then an ascending or near-flat channel | Bearish | Close below the pole apex |
| W Pattern | Low – high – lower low that closes back above (sweep) | Bullish | Close above the middle peak |
| M Pattern | High – low – higher high that closes back below (sweep) | Bearish | Close below the middle valley |
How detection works on the Crodl terminal
- Build swing pivots. A pivot high is a bar whose high dominates ±
Swing lengthbars (default 3); lows mirror. The pivot logic handles the ugly edge cases deliberately: a flat plateau of equal highs counts as one structural touch rather than minting phantom double tops, and an outside bar that is simultaneously a swing high and swing low is excluded as ambiguous. - Match pivots with ATR tolerance. "Equal" peaks are peaks within
Tolerance (x ATR14)of each other — 0.35 × the 14-period ATR by default. Volatility scaling means the same setting behaves sensibly on BTC and on a small-cap alt. - Enforce pattern quality. Three structural gates filter out noise: the pattern's height must be at least twice the tolerance (a "pattern" shorter than its own noise band is indistinguishable from jitter); tops and bottoms must reverse an actual prior trend — price must have traveled at least one full pattern height beyond the neckline in the window before the pattern; and price must stay contained inside the pattern's band between the first and last pivot — no leg may have escaped in between.
- Wait for the breakout. The pattern is only recorded when a close crosses the neckline within 160 bars of the final pivot's confirmation. If price instead closes beyond the pattern's far extreme first — pushing above a double top's peaks, for example — the pattern is invalidated and never drawn. Rectangles watch both boundaries and take their direction from whichever side breaks.
Settings are compact: Swing length (pivot granularity, default 3), Tolerance (x ATR14) (match strictness, default 0.35), Max patterns drawn (default 20), plus labels and the three colors. Like its candlestick sibling, the study scans closed candles only — the forming bar can never conjure or destroy a pattern mid-tick. You can run all nine detectors together or add any single pattern as its own study.
How traders use it
Post-breakout continuation and the retest
Because every drawn pattern already broke its confirmation level, the natural trade is the follow-through: the classic approach is to watch for a retest of the broken level and join in the breakout direction if it holds. A reversal pattern's neckline frequently coincides with a Visible S/R zone — broken pattern support becoming resistance is the flip behavior that zone study highlights explicitly.
The measured move
The pattern box makes the traditional measured-move projection trivial: the box's height is the pattern height, and the conventional target is that height projected from the breakout point. It is a heuristic, not a law — but it gives a principled first take-profit region rather than a guess.
Review and pattern literacy
Scrolling history with the study active is a fast way to calibrate your eye: you see which "double tops" the mechanical definition actually accepted, and — more instructive — how many visually tempting ones failed the prior-trend or containment gates. Many traders keep it on precisely to argue with it.
Confluence across pattern scales
Structure nests. The second trough of a double bottom is often itself marked by a bullish candlestick pattern like a tweezer bottom or hammer, and the breakout leg frequently coincides with a trendline break. When the bar-scale, swing-scale, and line-scale tools agree, the setup is structurally redundant — in the good sense.
Honest limitations
The confirmation-first design cuts both ways: you get zero false "forming" patterns, but you also see every pattern only after its breakout — this is a confirmation and context tool, not an anticipation tool. Pivots confirm Swing length bars after they print, adding a small structural lag. Reversal and range patterns must break out within 160 bars of completing; the shorter flag setup expires after 40 bars. The library deliberately covers these nine formations; head and shoulders, triangles, and wedges are not detected. Bull and bear flags use their own continuation-specific gates, described in the flag detector guide, and the sweep-reversal W & M variants have their own dedicated guide.
Frequently Asked Questions
Why can't I see a pattern that's clearly forming right now?
By design. A pattern is only drawn once a close crosses its required confirmation level — before that, it is a hypothesis, and the study does not draw hypotheses. If you want to trade the formation before confirmation, use the pivots and levels themselves; the study will validate you (or not) when the break comes.
Does it repaint?
No. Detection runs on closed candles only, and a pattern is recorded at its breakout bar with all conditions evaluated on data available then. Drawn patterns never move or vanish, except by rotating out of the Max patterns drawn window.
How does a rectangle get its direction?
It doesn't have one until the breakout: the pattern needs four alternating touches of a flat, ATR-tolerance-matched band, and the first close beyond either boundary stamps it bullish (upside break) or bearish (downside break).
What do Swing length and Tolerance actually trade off?
Swing length sets pivot granularity: smaller finds more, smaller patterns sooner; larger keeps only major structure. Tolerance (x ATR14) sets how equal "equal" must be: tighter tolerance means cleaner, rarer patterns; looser admits sloppier ones. The defaults (3 and 0.35) are a sensible middle for crypto timeframes.
Let the structure prove itself first
The Chart Patterns study is available on every Crodl terminal chart — add it from the indicator picker and every confirmed top, bottom, rectangle, flag, and sweep-reversal W or M marks itself on your chart, alongside live trading on six exchanges.
This article is for educational purposes only and is not financial advice. Leveraged trading carries substantial risk of loss. Always do your own research and never risk more than you can afford to lose.

Ready to automate your trading?
Connect your exchange, set up automations, and start trading smarter — all from one platform.
Start Trading Free