
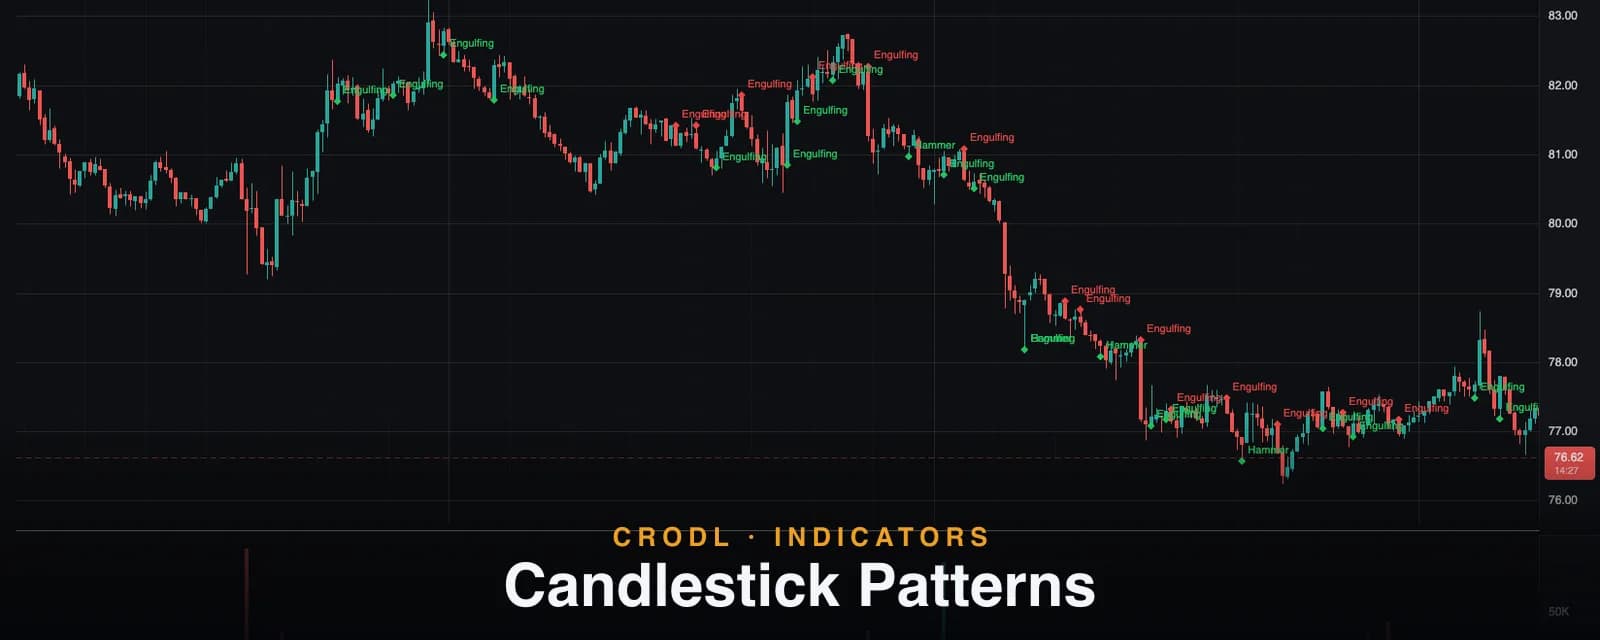
Candlestick Patterns: 46 Auto-Detected Formations on the Crodl Chart
Crodl's Candlestick Patterns study scans closed candles for 46 classic formations — doji, engulfing, morning star, three white soldiers and more — and marks each one.
Candlestick reading is the oldest skill in charting, and still one of the most practical: a hammer at a low, an engulfing bar at resistance, three white soldiers off a base — these shapes compress real order-flow stories into a glance. The catch is coverage. Nobody actually inspects every bar on every pair for forty-odd formations; you spot the ones you happen to be looking for and miss the rest.
The Candlestick Patterns study on the Crodl terminal runs that inspection continuously. It scans every closed candle against a library of 46 classic patterns — from single-bar doji variants to the five-bar Rising Three Methods — and marks each detection on the chart with a marker and a label naming the pattern.
You can run the whole library at once or add any single pattern as its own study, so "show me every bullish engulfing on this chart" is one click, not an evening of scrolling.
What the study shows
Each detected pattern gets a marker anchored to its final candle: a diamond for directional patterns (green for bullish, red for bearish by default) and a smaller circle for the neutral ones (doji and spinning tops, slate-grey). Bullish markers anchor at the candle's low, bearish and neutral ones at the high, so they sit clear of the bar itself. With labels enabled, each marker carries the pattern's short name — Engulfing, Morning Star, 3 Soldiers.
The library spans 21 bullish, 22 bearish, and 3 neutral formations, and the chart keeps the most recent Max patterns detections (default 80) so long histories don't drown in markers.
| Pattern length | Formations detected |
|---|---|
| 1 candle | Doji, Dragonfly Doji, Gravestone Doji, Hammer, Hanging Man, Inverted Hammer, Shooting Star, Long Lower Shadow, Long Upper Shadow, White/Black Marubozu, White/Black Spinning Top |
| 2 candles | Bullish/Bearish Engulfing, Bullish/Bearish Harami, Bullish/Bearish Harami Cross, Dark Cloud Cover, Piercing, Bullish/Bearish Doji Star, Rising/Falling Window, On Neck, Bullish/Bearish Kicking, Tweezer Top/Bottom |
| 3 candles | Morning/Evening Star, Morning/Evening Doji Star, Bullish/Bearish Abandoned Baby, Upside/Downside Tasuki Gap, Three White Soldiers, Three Black Crows, Bullish/Bearish Three-Bar Play, Bullish/Bearish Tri-Star |
| 5 candles | Rising Three Methods, Falling Three Methods |
How detection works on the Crodl terminal
The detectors follow the classical definitions, tightened with the kinds of guards a serious implementation needs:
- Adaptive proportions. "Long body," "small body," and "doji" are judged against each candle's own range and the average body of the prior 10 bars — not fixed percentages — so the same detector works on a quiet 1-hour chart and a violent 1-minute one. A marubozu, for instance, requires the body to fill roughly 88% of the range with almost no shadow on either side.
- Trend context where the pattern demands it. A hammer is only a hammer after a decline: the hammer family (hammer, hanging man, inverted hammer, shooting star) requires three progressively falling (or rising) closes before the pattern bar, plus an anchoring check that the pattern bar actually trades where that trend left off — a hammer shape printed far above a decline is unrelated to it and is rejected.
- Careful gap logic. Patterns built on gaps distinguish full-range gaps (rising/falling windows, abandoned baby) from real-body gaps (kicking, tri-star, doji stars) the way the classical literature does — important on crypto tapes where true range gaps are rare.
- Closed candles only. The forming bar is never scanned. A shape that exists mid-bar can un-form on the next tick, so detecting it live would paint markers that vanish — the study waits for the close, and what appears stays.
The settings are simple: Max patterns (default 80, up to 500) caps how many recent detections draw, Markers and Labels toggle the two visual layers, and the bullish/bearish/neutral colors are editable. Selecting a single pattern instead of "All" narrows the scan to just that formation.
How traders use it
Location first, pattern second
A candlestick pattern is a reaction snapshot — its value depends almost entirely on where it prints. A bullish engulfing inside a Visible S/R support zone is a trade location; the same bar mid-range is trivia. The standard workflow is to define locations first, then let the markers flag the reaction when price arrives.
Single-pattern mode for a focused playbook
Running all 46 detectors shows you everything the tape produces, which is ideal for learning but busy for execution. Traders with a defined playbook typically add just their patterns — engulfing bars and tweezers for reversal traders, windows and three-methods for continuation traders — and keep the chart quiet otherwise.
Multi-candle patterns as the higher bar
Three- and five-candle formations (morning star, abandoned baby, three soldiers, three methods) encode a full sequence of pressure, pause, and resolution, and traders generally weight them above single-bar shapes. Pairing a completed multi-candle reversal with an exhaustion read like a Candle Countdown 9 stacks independent evidence at the same turn.
The Three-Bar Play pair covers the classic continuation sequences traders call green-red-green and red-green-red: a long impulse candle, a small opposite-colour rest bar that holds more than half the impulse without retracing its origin, then a same-colour bar closing beyond the setup's extreme. The pattern marks on that breakout close — the bar that actually triggers the entry — making it the candlestick-scale cousin of the flag patterns.
From candles to structure
Candlestick events often mark the pivots that larger structure is built from — the tweezer bottom that becomes the second low of a double bottom. Watching both scales, the bar-level story and the multi-swing story, is where the pattern families compound.
Honest limitations
The study attaches no win-rate or probability statistics to any pattern, because honest per-pattern statistics depend on market, timeframe, and location — treat every marker as information about the last few bars' order flow, not a scored signal. Detection thresholds are established heuristics (in the spirit of the TA-Lib classics), so borderline shapes will sometimes be included or excluded where a human might judge differently. Single-bar patterns fire frequently by nature — doji especially — and the closed-candle guard means every detection arrives exactly one bar after the shape completes, never mid-bar.
Frequently Asked Questions
Does it repaint?
No. Patterns are only detected on closed candles, so a marker that appears never disappears. The cost is that you see the detection at the close of the pattern's final bar, not while it is forming — a deliberate trade of immediacy for reliability.
Can I detect just one pattern?
Yes. Every one of the 44 formations is available as its own study, and the combined study's Pattern setting can be narrowed from "All" to a single formation. Most traders run a shortlist rather than the full library.
Why is a pattern I can see not marked?
Usually the surrounding context: the hammer family requires a preceding three-close trend, star patterns require a genuinely long first candle and a real gap, and harami second bars must be truly small. The detectors enforce the classical definitions strictly — many "almost" shapes don't qualify. Older detections may also have rotated out of the Max patterns window.
Are these buy and sell signals?
No — they are descriptions of recent candle behavior, classified bullish, bearish, or neutral by their classical interpretation. Whether a given pattern is tradeable depends on where it printed and what you do about risk, which the study leaves to you.
Put the whole pattern library on watch
The Candlestick Patterns study ships on every Crodl terminal chart — add all 44 formations or just your favorites from the indicator picker, on every pair and timeframe, alongside live trading on six exchanges.
This article is for educational purposes only and is not financial advice. Leveraged trading carries substantial risk of loss. Always do your own research and never risk more than you can afford to lose.

Ready to automate your trading?
Connect your exchange, set up automations, and start trading smarter — all from one platform.
Start Trading Free