
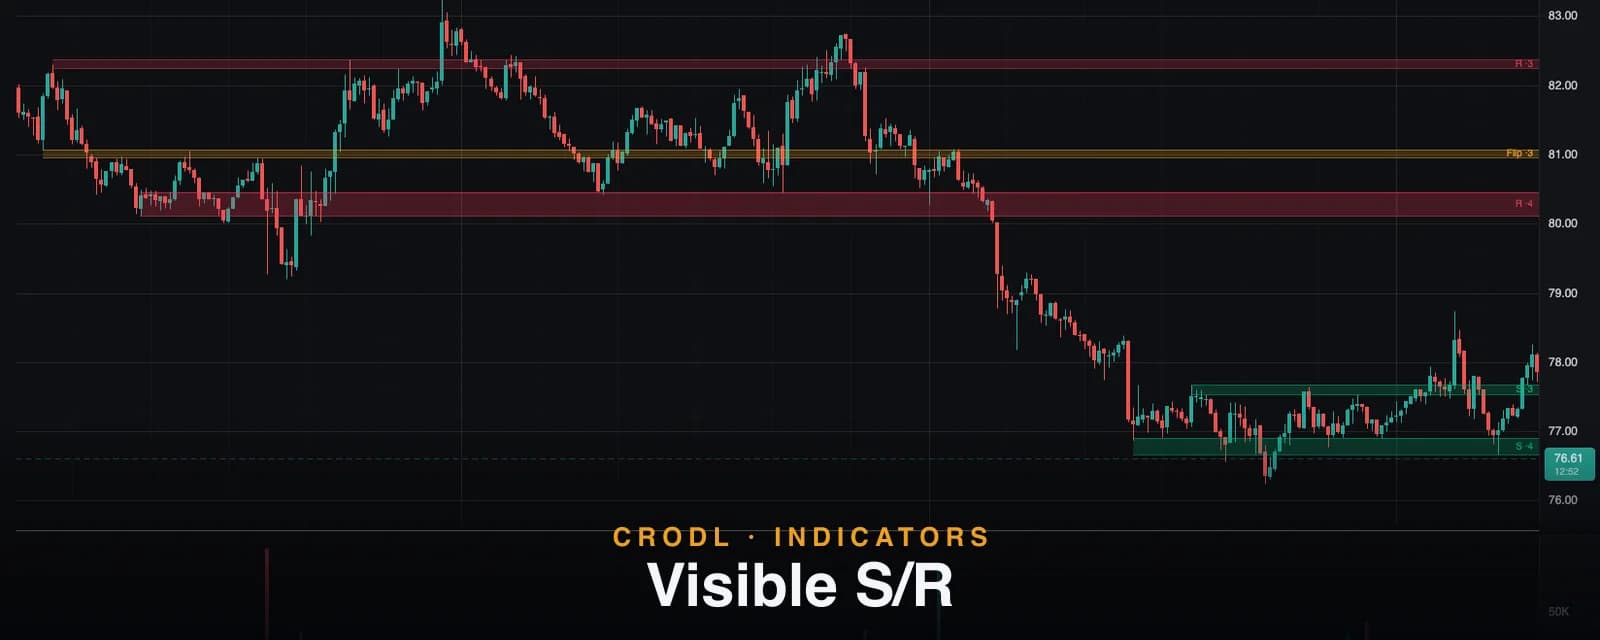
Visible S/R: Auto Support and Resistance Zones That Update as You Pan
How Crodl's Visible S/R indicator turns the swing pivots in your visible chart range into support, resistance and flip zones — recomputed live as you pan and zoom.
Every trader draws support and resistance. Almost nobody maintains it. Levels get drawn once, go stale as price migrates, and quietly bend to whatever bias you had the day you drew them. Worse, a level that matters on the 4-hour chart is often irrelevant noise on the 5-minute — so a static set of lines is always wrong for somebody.
The Visible S/R indicator on the Crodl terminal takes a different approach: it derives support and resistance from the candles currently on your screen, and re-derives them every time the view changes. Pan left into last month's range and the levels rebuild for that range. Zoom out to the macro chart and the intraday shelves dissolve into the levels that actually govern the higher timeframe. The chart in front of you always carries the levels that belong to it.
This post explains what the zones mean, exactly how they are computed, and how traders put a self-updating level map to work.
What Visible S/R shows
Visible S/R draws horizontal zones, not single lines — each zone spans the actual price spread of the swing pivots that formed it, because real support is a band, not a tick. Each zone runs from its first touch to the right edge of the chart and carries a compact label with its type and touch count (for example S ·4 — support, four touches).
There are three zone types. Support (green by default) sits below the current price; resistance (red) sits above it; and flip zones (amber) are levels where price has both rejected from above and bounced from below — the classic polarity-flip level that traders hunt for manually. Stronger zones are drawn more opaque: opacity scales with a zone's touch count relative to the strongest level in view, so your eye lands on the levels the market has respected most.
How it works on the Crodl terminal
The compute runs over the visible candle range and follows five steps:
- Find strict swing pivots. A bar qualifies as a pivot high only if its high is the sole maximum across ±8 bars (the default Pivot strength); pivot lows mirror with the sole minimum. Strictness matters — ties and near-misses don't mint pivots.
- Cluster pivots by price. Pivots within a tolerance band of each other merge into one level. The tolerance is volatility-scaled: 0.5 × the ATR of the visible window by default (Cluster tolerance (x ATR)), so clustering adapts to the symbol and zoom level instead of using a fixed percentage.
- Classify each level. A cluster containing both pivot highs and pivot lows becomes a flip zone. Otherwise it is resistance if it sits above the last visible close, support if below.
- Score and prune. Levels are scored by touch count first, with a recency bonus for levels touched late in the visible range. Only clusters with at least 2 touches (Min touches) survive, and only the strongest 8 (Max levels) are kept.
- Draw the zones. Each zone's height is the cluster's real price spread, floored at 0.15 × ATR (Min zone height) so a razor-thin cluster still reads as a band.
The headline behavior is the live viewport: the levels are recomputed whenever the visible range changes, so panning and zooming is the analysis. The compute is cached against the visible range and candle data, so simple repaints and y-axis moves reuse the last result — the indicator stays light even while you scrub the chart.
| Zone type | Default color | What formed it | How to read it |
|---|---|---|---|
| Support | Green | Clustered pivot lows below current price | Bounce-watch area for longs |
| Resistance | Red | Clustered pivot highs above current price | Rejection-watch area for shorts |
| Flip | Amber | A cluster holding both pivot highs and lows | Polarity level — broken support becomes resistance and vice versa |
The settings that matter
- Pivot strength (bars) — how dominant a swing must be to count (default 8). Larger values keep only major structure; smaller values admit minor shelves.
- Cluster tolerance (x ATR) — how close pivots must sit to merge (default 0.5). Raise it on choppy pairs to consolidate noisy near-duplicate levels.
- Min touches / Max levels — the quality floor (default 2) and the cap on how many zones draw (default 8).
- Highlight flip zones — toggle the amber flip classification; with it off, those clusters classify as plain support or resistance.
- Show labels / Zone opacity — the
S ·4-style tags and a global opacity scale from 10–100%.
How traders use it
Trade the reaction, not the line
A high-touch zone is a place to watch, not a trigger. Traders let price reach the zone and then read the reaction — a rejection wick, an engulfing bar, a failed breakout — before acting. The touch count in the label is a fast quality filter: a ·5 zone has been respected five separate times in the range you're looking at.
Flip zones as trend checkpoints
Flip zones mark where the market has already changed its mind once. In an uptrend, a flip zone under price is a natural pullback target and stop-anchor; losing it cleanly is an early warning that structure is turning — the same logic the Market Structure indicator formalizes with BOS and CHoCH events.
Zoom as timeframe analysis
Because the levels are derived from the visible range, zooming out is switching to higher-timeframe levels — no timeframe change required. A common workflow: zoom out to find the macro zone price is approaching, then zoom back in and let the local levels rebuild inside it.
Confluence stacking
Auto-derived zones get meaningfully stronger where they overlap other structure: an automatic trendline intersecting a ·4 support zone, or a liquidation cluster parked just beyond a resistance band, is a far better-defined trade location than any single signal.
Honest limitations
Pivot confirmation lags by design: a swing needs 8 bars (at default strength) on both sides before it can qualify, so the newest swing on your chart won't seed a zone until it is confirmed. Touch counts are counted within the visible range only — the same level may show different strength at different zooms, which is the intended behavior but worth internalizing. And because the levels re-derive per viewport, two traders looking at different ranges will see different zones; that is the feature, not a bug.
Frequently Asked Questions
Why did the zones change when I scrolled?
Because the indicator answers the question "where is support and resistance in this view?" Panning or zooming changes the candle set it reads, so the levels rebuild. If you want stable macro levels while trading a lower timeframe, keep a second zoomed-out chart — the zones on each stay true to their own range.
Does it repaint?
Confirmed zones don't move retroactively. A new pivot can only appear after its ±strength window completes (standard pivot confirmation lag), and a fresh confirmed pivot can add a touch to an existing cluster or seed a new level — which shows up as the zones updating on new structure, never as history being rewritten.
What exactly is a flip zone?
A price cluster where the pivot set contains both swing highs and swing lows — evidence that the market has rejected down from the level and bounced up off it. These polarity levels are the ones most likely to matter again on the next visit.
How many levels should I display?
The default of 8 suits most charts. Scalpers on fast pairs often drop Max levels to 4–5 and raise Min touches to 3 so only the heavily-defended zones draw; range traders mapping a full structure sometimes raise the cap instead.
Put a live level map on your chart
Visible S/R ships on every Crodl terminal chart — add it from the indicator picker and your support and resistance maintains itself, on every symbol and every zoom level, right next to live trading on six exchanges.
This article is for educational purposes only and is not financial advice. Leveraged trading carries substantial risk of loss. Always do your own research and never risk more than you can afford to lose.

Ready to automate your trading?
Connect your exchange, set up automations, and start trading smarter — all from one platform.
Start Trading Free