
Automatic Trendlines: Swing-Pivot Trendlines with Breakout Markers
How Crodl's Trendlines indicator anchors sloped support and resistance to confirmed swing pivots, sets the slope from ATR or Stdev, and marks every breakout close.
Trendlines are the most-drawn tool in technical analysis and the least agreed-upon. Two traders given the same chart will anchor different pivots, tilt the line to fit their bias, and quietly redraw it after every candle that embarrasses it. The information in a trendline is real — the redrawing is where it leaks away.
The Trendlines indicator on the Crodl terminal removes the hand from the equation. Every line is anchored to a confirmed swing pivot, its slope is set mechanically from volatility, and once drawn it never bends. When price closes through a line, the break is marked on the exact bar it happened — no hindsight, no nudging.
Just as importantly, it stays clean. Instead of painting every trendline the market has ever produced, it keeps only the most recent few per side, so the chart shows the lines that are live right now instead of a zigzag museum.
What Automatic Trendlines shows
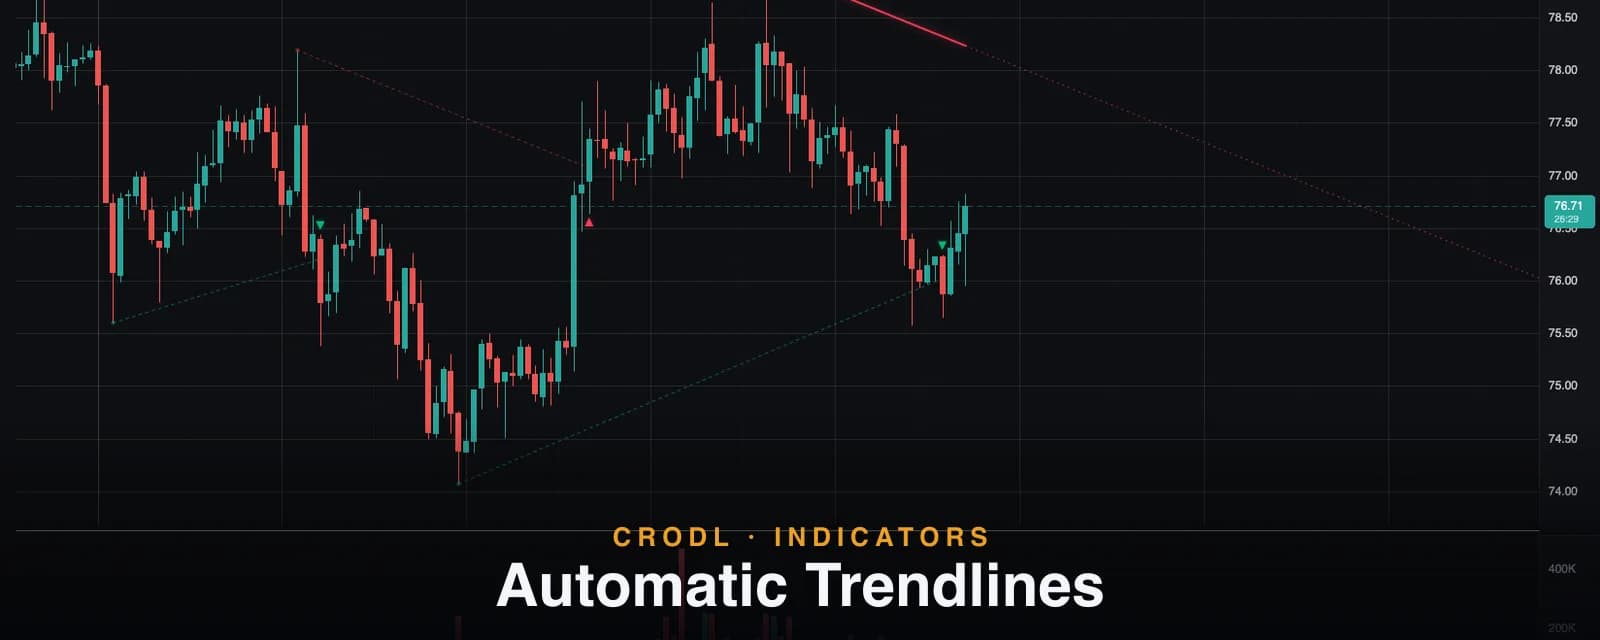
The indicator draws a small set of sloped line objects. Support lines (green by default) spring from confirmed swing lows and slope upward; resistance lines (red) spring from swing highs and slope downward. Each line starts with a dot at its anchor pivot.
The visual hierarchy tells you each line's status at a glance. The current, unbroken line on each side draws boldest with a soft glow, and — with Extend current line on — projects ahead to the right edge as a finely dashed continuation. Older lines that were superseded by a newer pivot draw calmer and stop where the newer line takes over. Broken lines fade to a dashed ghost that ends at the break bar, and if Breakout markers is enabled, a triangle marks the bar that closed through the line: below the bar for a resistance break (bullish), above the bar for a support break (bearish).
How it works on the Crodl terminal
- Find strict swing pivots. A bar is a swing high only if its high is the sole maximum across ±
Swing lookbackbars (default 20); swing lows mirror. A pivot is only confirmed 20 bars later — lines become actionable at confirmation, never before. - Set the slope from volatility. At the confirmation bar the indicator reads either the Wilder ATR or the rolling standard deviation of closes (your choice of Slope method), divides by the lookback length, and multiplies by the Slope setting (default 1.0). That per-bar slope is frozen at the pivot — the line never re-tilts afterward.
- Project the line. Resistance lines descend from the swing high at that fixed rate; support lines ascend from the swing low. With Slope set to 0 the lines go horizontal, turning the study into an automatic pivot-level tool.
- Detect the break. Scanning forward from confirmation, the first bar whose close crosses the projected line breaks it — closes only, so a wick poking through does not count. An older line stops scanning where the next same-side pivot supersedes it, so stale lines can never claim fresh breakouts.
- Keep it tidy. Only the most recent
Max lines per side(default 2) are drawn at all.
| Line state | Appearance | Meaning |
|---|---|---|
| Current, unbroken | Bold, soft glow, dashed projection to the right edge | The live trendline price is negotiating with now |
| Older, still holding | Thinner, calmer | Valid structure superseded by a newer pivot |
| Broken | Faded dashed ghost, ends at the break bar | Line failed — triangle marks the breaking close |
The settings that matter
- Swing lookback — pivot significance and confirmation lag in one number (default 20). Shorter = more lines, faster confirmation, more noise.
- Slope — the volatility multiplier (default 1.0). Lower values flatten the lines; 0 makes them horizontal.
- Slope method — ATR (default) or Stdev. ATR tracks bar range; Stdev tracks close dispersion and reacts differently in gap-heavy conditions.
- Max lines per side — how much history stays visible (default 2 per side).
- Extend current line — the dashed forward projection of the live line.
- Breakout markers — the break triangles on the closing bar.
How traders use it
Pullback entries along the live line
In a trend, the current support line is a mechanical pullback map: price returning to the glowing line is the classic trend-continuation location, and the line's projection shows where that test will sit several bars ahead. Traders pair the touch with a reaction signal rather than buying the line blind — a bounce that also sits inside a Visible S/R zone is a much stronger location than either alone.
Breakout confirmation without wick fakeouts
Because breaks are close-based, the triangle marker is a filtered signal: intrabar spikes through the line don't trigger it. A bullish break of a falling resistance line that aligns with a break of structure is a textbook trend-change sequence; the same close-through logic that confirms chart pattern necklines applies here to sloped lines.
Tuning slope to the market
The ATR-scaled slope adapts to each symbol's volatility, but the Slope multiplier is worth tuning: values below 1 suit grinding, low-volatility trends; higher values track steep parabolic phases. Setting it to 0 converts the tool into clean horizontal pivot levels — useful on ranging markets where sloped lines mislead.
Honest limitations
The confirmation lag is structural: with the default lookback of 20, a pivot — and therefore its line — only appears 20 bars after the swing printed. The slope is a volatility projection from a single pivot, not a regression fitted through multiple touches: the line is not guaranteed to connect two swing points the way a hand-drawn trendline would, and by construction it decays toward price. And a close-through break tells you the line failed — it says nothing about follow-through, which is why the markers are best treated as events to assess, not entries to take blindly.
Frequently Asked Questions
Do the lines repaint?
No. A line only exists once its anchor pivot is confirmed (lookback bars after the swing), and from that moment its anchor and slope are frozen. Breaks are stamped on the first qualifying close and never move.
Why did a trendline disappear?
Two possibilities: a newer swing pivot on the same side pushed it out of the Max lines per side window, or you switched symbol/timeframe and the study rebuilt for the new data. Raise Max lines per side if you want more history retained.
Why do the lines slope even in a flat market?
The slope is derived from volatility (ATR or Stdev), not from a second touch point — that is the design, inherited from the well-known "Trendlines with Breaks" approach. If you want horizontal levels instead, set Slope to 0.
What is the difference between the ATR and Stdev methods?
Both scale the slope to recent volatility. ATR uses true range (sensitive to wicks and gaps), Stdev uses the dispersion of closes (smoother, ignores wick extremes). On most crypto pairs they produce similar lines; ATR is the default and the common choice.
Let the chart draw its own lines
Automatic Trendlines is available on every Crodl terminal chart — add it from the indicator picker and get bias-free trendlines with confirmed breakout markers on every pair, alongside live trading on six exchanges.
This article is for educational purposes only and is not financial advice. Leveraged trading carries substantial risk of loss. Always do your own research and never risk more than you can afford to lose.

Ready to automate your trading?
Connect your exchange, set up automations, and start trading smarter — all from one platform.
Start Trading Free