
Session Levels
PDH, PDL, PWH, PWL, the opt-in PMH/PML and the day, week and month opens — the ICT daily-bias level set. How Crodl computes each level in UTC and how traders frame bias around them.
Some levels matter because of math. Others matter because everyone is watching them — and no levels are watched by more traders, algorithms, and exchange dashboards than the previous day's high and low, the previous week's high and low, and the current period opens. In ICT and Smart Money Concepts trading these form the daily-bias level set: the fixed reference frame you read every session against before a single pattern is considered.
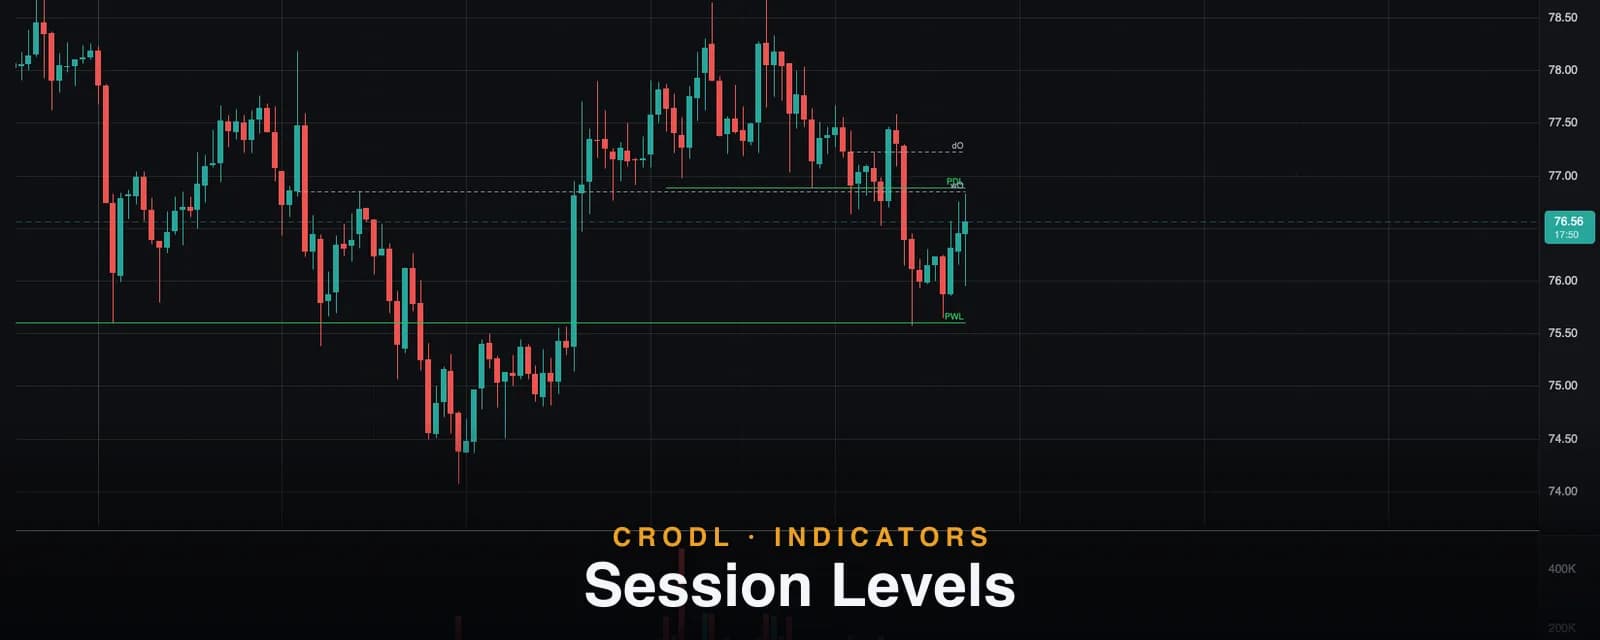
The Session Levels indicator on the Crodl terminal draws that whole set with one click: PDH/PDL (previous day high/low), PWH/PWL (previous week high/low), the opt-in PMH/PML (previous month high/low), and the current day, week, and month opens — all computed in pure UTC from the candles on your chart. This post covers what each level represents, exactly how they are calculated, and the ways traders build a session plan around them.
What session levels show
The previous day's extremes are the market's most recent settled boundaries — and, in liquidity terms, its most reliable magnets. Above PDH sit the stops of yesterday's shorts and a queue of breakout orders; below PDL, the mirror image. A large share of intraday crypto price action is simply the market traveling from one of these pools to the other, which is why "run on PDH" and "sweep of PDL" are staples of session commentary.
The opens serve a different purpose: bias. Trading above the day open means the session is net bullish from its anchor; below it, net bearish. The week open does the same job on a swing horizon, and the month open (opt-in) frames the macro leg. None of these levels predict anything by themselves — they are the coordinate system that makes everything else on the chart readable.
How it works on the Crodl terminal
Every level is derived from candle timestamps in pure UTC — the native convention of crypto markets:
- Day — the UTC calendar day, rolling at 00:00 UTC.
- Week — the ISO week, starting Monday 00:00 UTC.
- Month — the UTC calendar month.
There is no local-time or DST arithmetic anywhere, so a level can never shift because your clock did, and two traders in different timezones see identical lines.
From those boundaries the indicator emits up to nine levels: PDH and PDL from the previous completed UTC day, PWH and PWL from the previous completed week, PMH and PML from the previous completed month (opt-in), and the opens of the current day, week, and month. Each renders as a horizontal line from the first bar of its source period to the newest candle, with a right-edge tag: highs are solid red, lows solid green, and opens dashed gray.
| Level | Tag | Style | What it marks |
|---|---|---|---|
| Previous day high / low | PDH / PDL | Solid red / solid green | Yesterday's UTC extremes — intraday liquidity magnets |
| Previous week high / low | PWH / PWL | Solid red / solid green | Last week's extremes — swing-level reference |
| Previous month high / low | PMH / PML (opt-in) | Solid red / solid green | Last month's extremes — macro liquidity reference |
| Day open | dO | Dashed gray | The 00:00 UTC open — intraday bias line |
| Week open | wO | Dashed gray | Monday 00:00 UTC open — weekly bias line |
| Month open | mO (opt-in) | Dashed gray | The month's open — macro bias line |
Two properties are worth knowing. First, live ticks never move a level: the extremes come from completed periods and the opens are fixed the moment their first bar prints, so the set only changes when a day, week, or month actually rolls. There is nothing to repaint. Second, an honest limitation: levels are computed from the candles loaded on your chart. If your loaded history begins mid-week, PWH/PWL reflect only the loaded part of that week — scrolling back to load more history completes them.
Settings that matter
- Prev day H/L (PDH/PDL) (default on) — yesterday's extremes.
- Prev week H/L (PWH/PWL) (default on) — last week's extremes.
- Prev month H/L (PMH/PML) (default off) — last month's extremes; opt-in because they often sit far from price on low timeframes.
- Day open / Week open (default on) — the dashed bias lines.
- Month open (default off) — the one opt-in level, for higher-timeframe framing.
- Colors — highs, lows, and opens are independently themeable.
How traders use it
The PDH/PDL run
Price gravitates to the previous day's extremes, so the first question of any session is which one gets run. A sweep of PDL that immediately reclaims the level is a classic long setup — the same wick-grab logic the Equal Highs & Lows indicator formalizes, and doubly interesting when an EQH/EQL pool has formed right at the session extreme.
Bias from the opens
The simplest daily model: above the day open, favor longs at support; below it, favor shorts at resistance. When price opens the week above the week open and holds it, swing continuation setups get the benefit of the doubt. Losing an open you had been trading above is often the first quiet sign a session is flipping.
Level-and-time confluence
Session levels tell you where; session timing tells you when. A PDL sweep during the London window reads very differently from the same sweep in dead hours — pairing this indicator with ICT Killzones puts both on the chart at once. And when PDH stacks with a broader liquidity zone, the magnet above is that much stronger.
Frequently Asked Questions
Which timezone are the levels based on?
UTC, always: days roll at 00:00 UTC, weeks on Monday 00:00 UTC, months on the first of the month UTC. This matches how crypto data is conventionally aggregated, avoids all DST ambiguity, and means every Crodl user sees the same lines regardless of location.
Do the levels move during the day?
No. PDH/PDL, PWH/PWL and PMH/PML come from completed periods and are pure history; the opens are fixed as soon as the period's first bar exists. The set changes only when a period rolls — today's forming high and low are deliberately not drawn.
Why are the previous-month levels off by default?
PMH and PML are in the set — toggle Prev month H/L on and last month's extremes draw with the same solid red/green styling. They default off because monthly extremes often sit far outside the visible range on low timeframes, which squashes the price scale; on 1h and up they are a natural macro complement to the month open.
Why does PDH differ from my exchange's 24h high?
Exchange tickers usually show a rolling 24-hour window. PDH is the high of the previous completed UTC calendar day — a fixed, universally agreed level rather than one that changes every minute.
Frame every session
Session Levels ships with every Crodl terminal chart — add it from the indicator picker and PDH, PDL, PWH, PWL and the period opens are on your pair instantly, alongside live trading on six exchanges.
This article is for educational purposes only and is not financial advice. Leveraged trading carries substantial risk of loss. Always do your own research and never risk more than you can afford to lose.

Ready to automate your trading?
Connect your exchange, set up automations, and start trading smarter — all from one platform.
Start Trading Free