
ICT Killzones
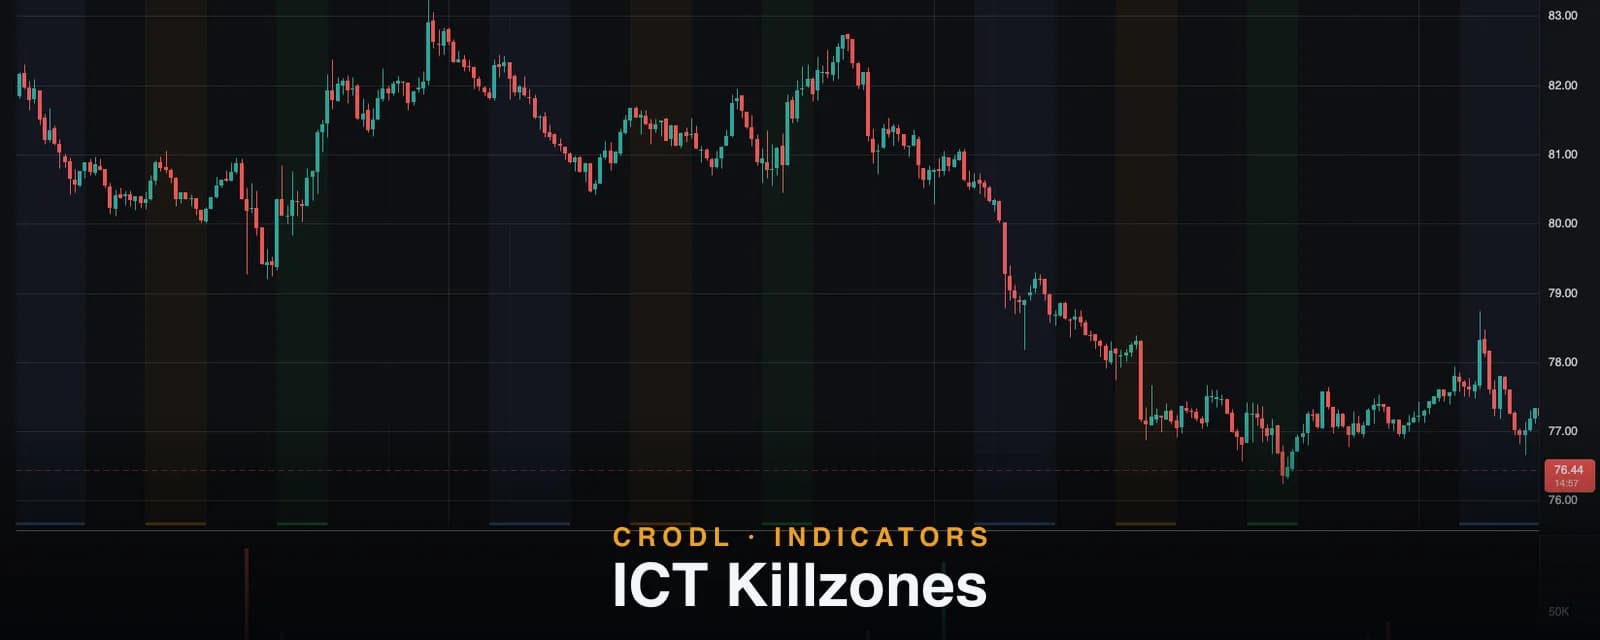
Asia, London and New York killzones drawn as session bands on any crypto chart. How Crodl computes ICT killzones in UTC and how to tune the windows to your market.
Crypto trades 24/7, but it does not behave 24/7. Volume, volatility, and follow-through cluster into a few hours each day — the windows when Asian desks, London, and New York are actually at their screens. ICT traders call these windows killzones: the sessions where institutional order flow concentrates, and therefore the only hours in which many of them will take a trade at all.
The ICT Killzones indicator on the Crodl terminal paints those windows directly onto your chart as translucent vertical bands — Asia, London, New York AM, and New York PM — computed from candle timestamps in pure UTC. Each window is fully configurable, so you can align the bands with equities hours, futures opens, or whatever rhythm your market actually follows. This post covers the session logic, the exact mechanics, and how traders combine time with level.
What killzones show
The classic ICT session script runs like this: Asia builds a range overnight, establishing the initial high and low. London opens with the day's first real expansion — and very often that expansion begins by sweeping one side of the Asia range before the true move starts (the "Judas swing"). New York AM brings the deepest liquidity of the day and either continues London's move or violently reverses it. New York PM is late-day positioning — quieter, and off by default on Crodl for exactly that reason.
Crypto never closes, but it still dances to this rhythm: CME products, ETF flows, and market-making desks all run on traditional hours, and the volume statistics show it. A breakout at 14:00 UTC with New York online and a breakout at 22:00 UTC on thin books are not the same trade — killzones make that difference visible at a glance.
How it works on the Crodl terminal
The indicator tracks four sessions, each defined as a start/end window in UTC hours:
| Session | Default window (UTC) | Default color | Typical character |
|---|---|---|---|
| Asia | 00:00 – 04:00 | Blue | Range building — defines the initial high and low |
| London | 07:00 – 10:00 | Amber | First expansion; often sweeps the Asia range |
| NY AM | 13:30 – 16:00 | Green | Deepest liquidity; continuation or reversal of London |
| NY PM | 17:30 – 20:00 (off by default) | Red | Late-day positioning, quieter follow-through |
Mechanically it is deliberately simple. A candle belongs to a session when its UTC time-of-day falls inside the session's window (start inclusive, end exclusive). Contiguous candles in a window merge into one band per session per day, and each band renders three ways: a faint full-height wash behind the candles, a stronger strip along the bottom of the chart that stays legible on busy charts, and a session label on bands wide enough to carry one.
Every window is editable in fractional UTC hours — 13.5 means 13:30 — in half-hour steps. One documented limitation: windows cannot cross midnight. Start and end are clamped to the same UTC day, and an inverted pair (say 22 → 2) is repaired by swapping into the 02:00–22:00 window rather than an overnight session.
Because band membership depends only on candle times, price ticks never change the drawing — the bands are exactly as stable as your chart's timestamps, with the most recent sessions kept up to the Max sessions drawn cap.
Settings that matter
- Session toggles — Asia, London, and NY AM are on by default; NY PM is opt-in (four bands is noisy).
- Window inputs — independent start/end UTC hours per session, in 0.5-hour steps.
- Session colors — blue, amber, green, and red by default; each independently themeable.
- Max sessions drawn (default 60) — how many recent bands stay on the chart.
How traders use it
The Asia-range playbook
The bands make the overnight range trivially easy to read: Asia's high and low are the day's first liquidity pools. The classic sequence is a London-session sweep of one side — especially when equal highs or lows have formed at the range extreme — followed by displacement in the opposite direction into New York. Trading the second move, not the first, is the entire point of the pattern.
Time as a trade filter
Many ICT traders simply refuse setups outside a killzone. A Break of Structure printed during NY AM, with real participation behind it, carries different weight than the same break in the dead hours between sessions — where moves routinely retrace as soon as volume returns. The bands turn that discipline into something you can see.
Stacking time with level
Killzones tell you when; levels tell you where. The strongest setups sit at the intersection: a sweep of the previous day's low (from Session Levels) during the London window, or a fair value gap left by NY AM displacement that gets revisited in the PM session. Time-and-price confluence is the core of the ICT model, and this pairing puts both dimensions on one chart.
Frequently Asked Questions
Are the windows DST-aware?
No — they are fixed UTC, which keeps them deterministic and identical for every user. The practical consequence: the New York equities open sits at 13:30 UTC in summer and 14:30 UTC in winter, so traders who anchor to the NYSE bell shift the NY windows by an hour twice a year in settings. Crypto-native traders mostly leave the defaults alone.
Why do killzones matter in a market that never closes?
Because participation is not flat. CME futures, ETF creations, and institutional desks operate on traditional hours, and crypto volume measurably concentrates inside them. The sessions are when the players big enough to cause displacement are actually active.
Can I set an overnight window like 22:00–02:00?
Not in the current version — windows are clamped to a single UTC day, and an inverted start/end pair is swapped rather than wrapped. If your Asia definition starts the prior evening, anchor it at 00:00 UTC (the default) instead.
Which timeframes should I use it on?
Intraday charts — 1-minute through 1-hour. Session membership is evaluated from each candle's open time, so on 4-hour or daily charts the bars are too coarse to resolve a 2–4 hour window and sessions can vanish entirely. The bands are built for the timeframes killzone trading actually happens on.
Trade the hours that matter
ICT Killzones is available on every Crodl terminal chart — add it from the indicator picker and the Asia, London, and New York windows are painted on your pair in one click, alongside live trading on six exchanges.
This article is for educational purposes only and is not financial advice. Leveraged trading carries substantial risk of loss. Always do your own research and never risk more than you can afford to lose.

Ready to automate your trading?
Connect your exchange, set up automations, and start trading smarter — all from one platform.
Start Trading Free