
Auto Channel: Parallel Trend Channels That Draw Themselves
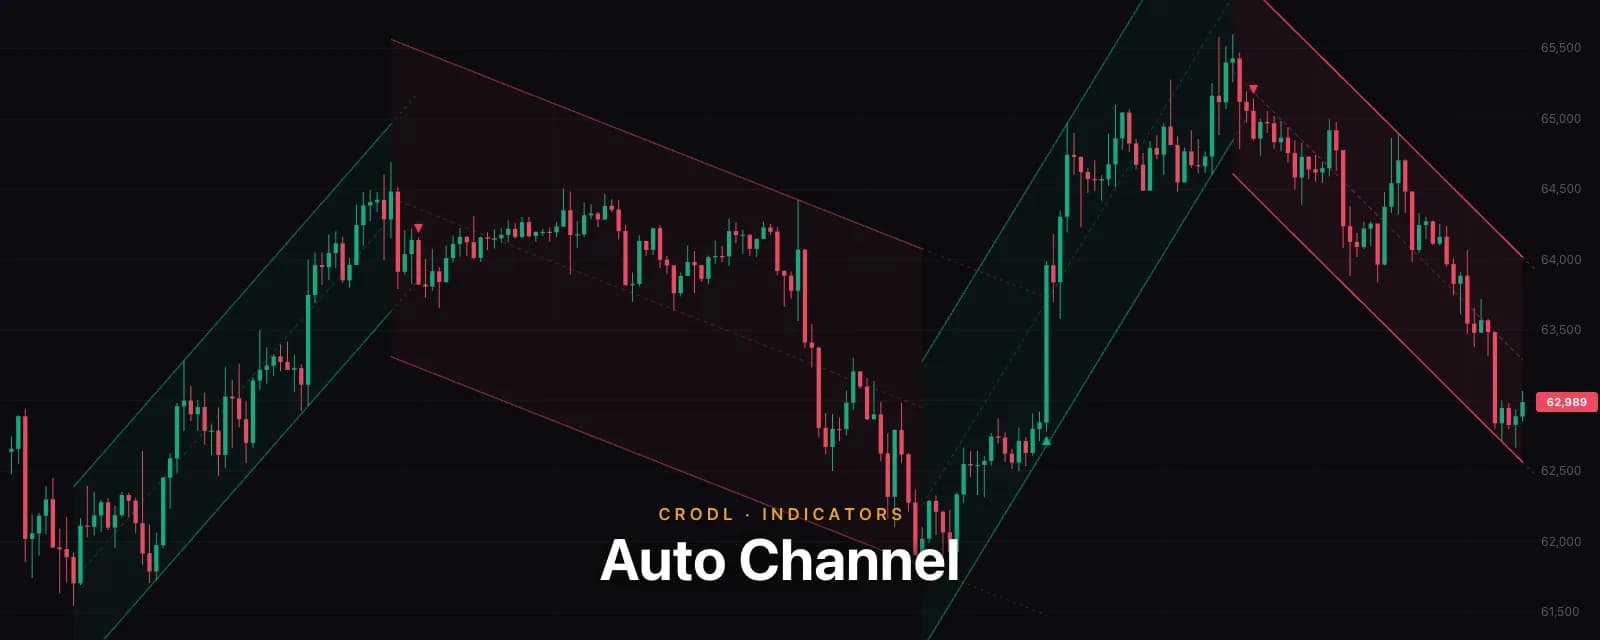
The Auto Channel indicator segments price into trend legs with an ATR zigzag and pins a parallel channel to each one — anchored like a hand drawing, with a break marker when the trend ends.
Every trader has drawn this channel: two parallel lines wrapped around a trend leg, price respecting both walls until, one candle, it doesn't. The problem was never reading the channel — it was maintaining it. Hand-drawn channels go stale the moment the market prints a new extreme, and redrawing them is subjective enough that two traders on the same chart rarely agree where the walls sit.
Auto Channel on the Crodl terminal draws them for you, and — the part that matters — draws them the way you would: pinned to the bars they came from. This is not a rolling envelope that slides along with price. Each channel is anchored to a specific trend leg, exactly like a drawing you placed yourself, and it stays put while you pan, zoom, and scroll back through history.
What it shows
- Trend legs, found automatically. Price action is segmented zigzag-style: a leg ends when price retraces more than a multiple of ATR (default 3×) from the leg's running extreme. Big swings survive; noise doesn't get its own channel.
- A parallel channel per leg. Through each leg a least-squares line is fitted, and the two walls run parallel to it, pushed out to the leg's extreme deviations — so the channel contains the leg, touching its outermost wicks. Up-legs draw in teal, down-legs in rose, with a faint fill and a dashed midline between the walls.
- The forming leg, live. The current, unfinished trend carries its own channel that updates as candles arrive and projects to the right edge — the two rails price is running between right now.
- The break. After a completed leg, the walls project forward as dashed lines, and the first candle that closes outside them gets a direction triangle. That marker is the channel's exit interview: the moment the trend formally stopped containing price.
Everything within your lookback (default 500 bars) gets its channel, so scrolling back reads as a map of the market's recent structure: leg, break, leg, break.
Anchored, not chasing
The design decision worth explaining: Auto Channel derives its legs from the price data, never from what happens to be on screen. A viewport-driven channel re-fits itself every time you pan — it always looks impressive and can never be traded, because the "channel" you saw five minutes ago no longer exists. An anchored channel is falsifiable. The wall either holds or it breaks, and the break happened at a specific bar that is still marked when you come back to it.
Completed legs are frozen: appending new candles does not move them. Only the forming leg updates live — which is honest, because that trend genuinely is still being written.
How traders use it
Trade the walls while the leg lives
Inside an up-channel, the lower wall is the trend's discount rail — the highest-quality pullback entry the leg offers — and the midline is where mean-reversion trades take profit. In a down-channel, mirror everything. The wall touch is the entry cue; the channel's slope keeps you honest about which direction you should be trading at all.
Treat the break as the regime event
The projection-and-break design turns "the trend ended" from a feeling into a bar index. A close above a down-channel's upper wall — the green triangle — is the earliest structural evidence the decline is done, printed before any moving average has flipped. Pairing the break with a level from Liquidity Zones or a reclaimed trendline is a classic reversal confluence stack.
Read the lookback as structure
With several channels on screen, alternating teal and rose, the chart tells you what kind of market this is at a glance: long clean legs with quick breaks (trending, trade continuation) versus short overlapping stubs (chop, stand down). It is the same read a market-structure tool gives, but with the channel geometry — slope and width — visible per leg.
Settings that matter
- Reversal (× ATR) (default 3.0) — the leg-cutter. Higher values merge minor swings into fewer, larger legs; lower values slice finer structure. This is the first knob to tune per timeframe.
- Min leg length (default 12 bars) — legs shorter than this never get a channel, keeping micro-swings out.
- Lookback (default 500 bars) — how far back legs qualify. Max channels (default 10) caps clutter if a small reversal setting slices the lookback finely.
- Wall placement — Extremes (default) contains the leg exactly, touching its extreme wicks; Stdev bands places walls at ±2σ of the fit residuals instead, which stays calmer when a single blow-off wick would otherwise balloon the channel.
- Midline / Project forward / Break marker — each independently toggleable; colors for up- and down-channels are editable.
An honest note
A channel is only knowable in full once its leg has ended — that is the nature of the object, not a flaw in the detection. The forming channel updates as its leg grows (a new extreme re-fits it), and the zigzag confirms a reversal only after price has already retraced the threshold, so fresh legs appear with a delay. Extremes-mode walls are defined by single wicks by design; if one anomalous candle is setting your wall where you don't believe it, that is what Stdev mode is for. And a parallel channel assumes the leg trends at a roughly constant rate — parabolic moves will leave any straight channel behind.
Frequently Asked Questions
How is this different from Donchian or Keltner Channels?
Donchian and Keltner channels are rolling envelopes: recomputed every bar over a fixed window, always present, always sliding with price. Auto Channel is a drawing: it exists only where a trend leg exists, is pinned to that leg's bars, slopes with the trend, and stops updating once the leg completes. Envelopes describe recent volatility; Auto Channel describes structure.
Does it repaint?
Completed channels never move — panning, zooming, or new candles leave them bit-identical. Two things do update by construction: the forming leg's channel re-fits as its trend grows, and a leg only becomes "completed" once the ATR-retrace confirms the reversal, so the newest channel appears with that confirmation delay. Both are disclosed above; neither rewrites history.
Why did two swings I can see get merged into one channel?
The reversal between them didn't retrace 3× ATR, so the zigzag treated them as one leg. Lower Reversal (× ATR) to cut finer legs — at the cost of more, smaller channels.
When should I switch walls to Stdev mode?
When wicky markets make the extremes walls too wide to be useful — one liquidation wick and the whole channel inflates to contain it. Stdev walls hug the body of the trend instead, at the cost of the strict "everything inside" guarantee (and the break scan then uses those tighter walls, so breaks fire earlier).
Channels without the drawing tool
Auto Channel is one click away in the indicator picker on every Crodl terminal chart. Drop it on a trending pair, watch the walls hold twice, and the third touch will feel like information instead of a guess.
This article is for educational purposes only and is not financial advice. Leveraged trading carries substantial risk of loss. Always do your own research and never risk more than you can afford to lose.

Ready to automate your trading?
Connect your exchange, set up automations, and start trading smarter — all from one platform.
Start Trading Free