
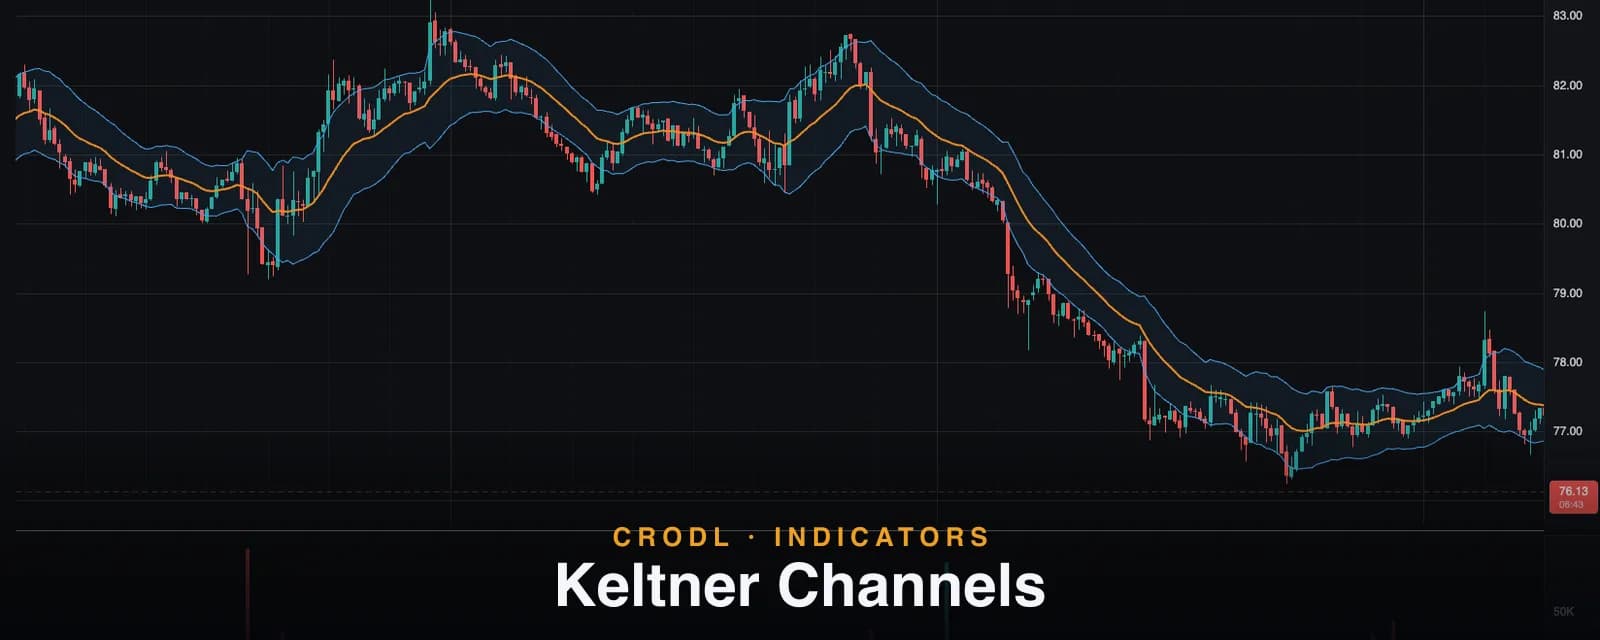
Keltner Channels
Keltner Channels wrap a 20-period EMA in ATR-based bands — a smoother volatility channel than Bollinger Bands. How the Crodl preset works and how traders use it.
Every volatility channel makes the same promise — show me where price is relative to normal — but the yardstick it uses determines its personality. Standard-deviation channels flare violently on a single outsized candle. Range-based channels built on Average True Range breathe more evenly, because ATR is smoothed by construction and treats a gap or a long wick as information rather than an outlier to overreact to.
Keltner Channels are the definitive ATR channel: an exponential moving average with bands offset by a multiple of ATR. Chester Keltner sketched the idea in the 1960s and Linda Raschke's modern formulation — EMA basis, ATR width — is what nearly every platform ships today, including the Crodl terminal's preset.
The result is a channel that hugs trends gracefully. Where Bollinger Bands snap wide the moment volatility spikes, Keltner Channels expand smoothly, which makes them the tool of choice for one specific job: separating orderly trend pullbacks from genuine breaks. This post covers the mechanics of the Crodl preset and the ways traders lean on that smoothness.
What Keltner Channels show
Three lines. The basis is an EMA — the market's short-term consensus price. The upper and lower bands sit a fixed number of ATRs above and below it, so the channel's width is a direct read of recent true range: wide channel, energetic tape; narrow channel, quiet tape.
Because ATR changes gradually, the channel forms a stable "lane" for price. In a healthy trend, price occupies the upper or lower half of the lane and pulls back to the basis without crossing it decisively. That stability is exactly what standard-deviation bands sacrifice for sensitivity — and it is why the two channels together (Bollinger inside Keltner) form the classic squeeze signal.
How Keltner Channels work on the Crodl terminal
The Crodl preset is a CRODL Rune script — you can open the source in the Rune editor, audit the handful of lines it takes, and fork your own version. The computation each bar:
basis = EMA(close, EMA Length)— default 20span = ATR(ATR Length) × Multiplier— defaults 10 and 1.5upper = basis + span,lower = basis − span
EMA Length accepts 1–500, ATR Length 1–200, and Multiplier 0.1–10 in 0.1 steps. The basis draws in Crodl orange at width 2 with its live value shown on the price axis; the bands draw in blue at width 1, and a Show Fill toggle (on by default) tints the channel interior at a quiet 7% opacity. Colors are all adjustable in the settings dialog's Style group.
The 20/10/1.5 defaults are the standard modern configuration. Two common variants are worth knowing: multiplier 2.0–2.5 turns the channel into a wider extreme-detector (fewer, more meaningful band tags), and a longer 50-period EMA turns it into a swing-trading lane on higher timeframes.
How traders use Keltner Channels
The pullback lane
The signature Keltner trade is trend continuation. In an uptrend, price rides the upper half of the channel; pullbacks that hold at or above the basis are entries with the trend, targeting a return to the upper band. The channel defines the whole trade: entry zone (basis), invalidation (a decisive close through the opposite band), and target (the trend-side band). The mirror applies in downtrends.
Breakout confirmation
A close outside a Keltner band is rarer and more meaningful than a close outside a Bollinger Band, because ATR width does not collapse in quiet tape the way standard deviation does. Momentum traders treat a strong close beyond the band — especially from a tight channel — as expansion confirmation rather than an overbought warning.
The squeeze, from the other side
The famous squeeze setup is defined by Keltner Channels: when Bollinger Bands contract inside the Keltner Channel, volatility is critically compressed and a directional move is loading. The Squeeze Momentum indicator automates that comparison, but plotting both channels makes the geometry visible on the chart itself.
Choosing your channel
| Channel | Midline | Width driver | Character |
|---|---|---|---|
| Keltner Channels | 20 EMA | ATR(10) × 1.5 | Smooth, stable trend lane |
| Bollinger Bands | 20 SMA | Stdev × 2.0 | Fast-reacting; flares on shocks |
| ATR Bands | 21 double-smoothed EMA | ATR(21) × 2.618 | Wide multi-tier extreme detector |
| Donchian Channels | Range midpoint | 20-bar high/low | Steps only on new extremes |
If you want the multi-tier version of the ATR approach — half, quarter, and phi bands nested inside a 2.618 ATR envelope — see ATR Bands; for the pure breakout channel, see Donchian Channels.
Frequently Asked Questions
Why an EMA and ATR instead of an SMA and standard deviation?
The EMA weights recent price more heavily, so the basis tracks trend shifts faster. ATR is a smoothed measure of true range — including gaps and wicks — so the width evolves gradually instead of jumping on one large candle. Both choices trade raw sensitivity for stability, which is the entire point of the indicator.
What does the 1.5 multiplier actually mean?
The bands sit one and a half average true ranges from the EMA. If ATR(10) on your pair is $200, the channel is $300 wide on each side. Because it is denominated in the pair's own volatility, the same setting is directly comparable across BTC, ETH, and any alt.
Do Keltner Channels repaint?
No. EMA and ATR use only current and past bars. The forming candle's values update live until it closes — normal for every moving-average study — and closed bars never change.
Which timeframes work best?
The channel is timeframe-agnostic since ATR normalizes width, but its smooth character shines on swing timeframes — 1h to daily — where the pullback-to-basis rhythm is cleanest. Scalpers using it intraday often pair a shorter EMA with a slightly higher multiplier to keep signals meaningful.
Trade the lane, not the noise
Keltner Channels are one click away on every Crodl terminal chart — add the preset from the indicator picker, tune the EMA and multiplier to your style, and you have a stable volatility lane drawn live across six exchanges.
This article is for educational purposes only and is not financial advice. Leveraged trading carries substantial risk of loss. Always do your own research and never risk more than you can afford to lose.

Ready to automate your trading?
Connect your exchange, set up automations, and start trading smarter — all from one platform.
Start Trading Free