
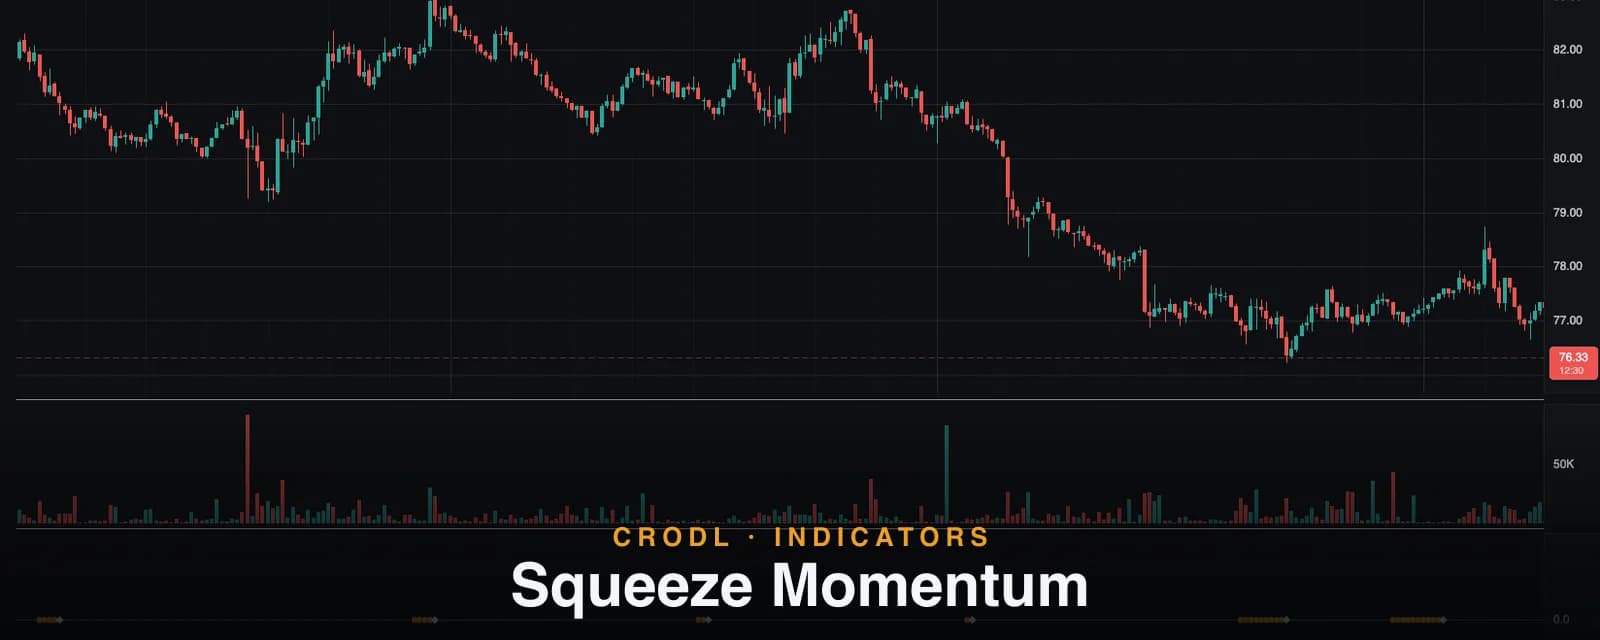
Squeeze Momentum
How Crodl's Squeeze Momentum preset works: Bollinger(20,2)-inside-Keltner(20,1.5) squeeze dots, a four-state momentum histogram, and alerts when the squeeze fires.
Markets breathe. Volatility compresses into tight, quiet ranges, then expands violently — and the tighter the coil, the harder the release. That cycle is one of the most reliable structural facts in trading, and it's the entire premise of the squeeze: detect the compression while it's happening, then catch the expansion when it fires.
The idea was popularized by John Carter's TTM Squeeze and reached most retail charts through LazyBear's famous open-source formulation, which became one of the most-used community indicators ever published. The Squeeze Momentum preset on the Crodl terminal is a faithful port of that formulation: Bollinger Bands compressing inside Keltner Channels to flag the squeeze, and a four-state momentum histogram to tell you which way the pressure is building. This post covers the theory, the exact mechanics of our implementation, and how traders trade the release.
What Squeeze Momentum shows
The indicator answers two questions in one pane. First: is the market coiling? Bollinger Bands are built from standard deviation, so their width collapses when closes cluster tightly. Keltner Channels are built from true range, which stays comparatively wide as long as bars have any span at all. When volatility compresses hard enough that the Bollinger Bands slip entirely inside the Keltner Channel, that's a statistically unusual level of quiet — the squeeze is on, marked by dots along the zero line.
Second: which way is pressure building? A momentum histogram — a linear-regression measure of how far price has pulled away from its recent equilibrium — oscillates around zero, colored by both direction and acceleration. The squeeze tells you a move is loading; the histogram tells you which side is likely to win the release.
How it works on the Crodl terminal
The preset is a Rune script (squeezeMomentum) in its own pane. The defaults match the classic LazyBear settings:
- BB Length — 20, BB Mult — 2.0
- KC Length — 20, KC Mult — 1.5
- Momentum Smoothing — 1 (raw by default)
The implementation details matter, and ours are deliberate:
- Bollinger Bands: 20-period SMA basis ± 2.0 × standard deviation, using population standard deviation for parity with TradingView's
ta.stdev— so readings match what you'd see on the original script. - Keltner Channels: LazyBear-style — 20-period SMA basis ± 1.5 × the 20-period SMA of true range, not Wilder's smoothed ATR. This is the variant the original indicator used, and it makes the squeeze threshold slightly different from a textbook Keltner.
- Squeeze state: the squeeze is ON while both Bollinger Bands sit fully inside the Keltner Channel (lower BB above lower KC and upper BB below upper KC). An amber dot prints on the zero line for every bar the squeeze is on. The ON→OFF flip is the fire, marked with a distinct white diamond on the release bar. There are deliberately no dots during off bars — at chart density they'd merge into a slab that paints over small histogram bars.
- Momentum: price's distance from equilibrium — the close minus the midpoint of the Donchian middle and the 20-SMA — pushed through a linear-regression endpoint (computed via the exact LSMA identity, 3×WMA − 2×SMA). With smoothing at the default 1 the histogram is raw, matching the classic; raising it applies an EMA for a calmer, laggier plot.
The histogram renders as four mutually exclusive colored states, mirroring the TTM-style read:
| State | Condition | Default color | Read |
|---|---|---|---|
| Up & rising | Above zero, increasing | Bright green | Bullish thrust — momentum accelerating |
| Up & falling | Above zero, decreasing | Pale green | Still bullish, but decelerating |
| Down & falling | Below zero, decreasing | Bright red | Bearish thrust — momentum accelerating |
| Down & rising | Below zero, increasing | Pale red | Still bearish, but fading |
Two alerts ship with the preset: squeeze_started when compression begins, and squeeze_fired on the release bar — so you can be flat and patient, and still never miss the moment the coil lets go.
How traders use it
Stalk the squeeze, trade the fire
The core playbook: when amber dots appear, stop trading and start preparing. Compression itself is not a signal — it's a countdown. When the diamond prints, take the direction the histogram is showing at the release: bright green fire, look long; bright red fire, look short. The longer the dot sequence, the more energy the range has stored, and the more room the expansion tends to have.
Use the fade colors to manage the trade
The two-tone histogram is a built-in exit manager. A position entered on a bright-green fire is in its best state while the bars stay bright; the first pale-green bar means momentum is decelerating — time to trail stops or take partials, well before the histogram actually crosses zero. Waiting for the zero cross gives back too much; the color flip is the earlier tell.
Layer a trend filter
Squeezes fire in both directions, and counter-trend fires are the ones that fail. Filtering releases by higher-timeframe trend — only taking bullish fires above the MACD zero line, for instance — cuts the whipsaws substantially. It also pays to understand the components: our guides to Bollinger Bands and Keltner Channels cover what each band is actually measuring and why their interaction defines the squeeze.
Frequently Asked Questions
Is this the same as John Carter's TTM Squeeze?
Same concept, LazyBear's formulation. Carter's original is proprietary; the open version this preset ports uses an SMA-of-true-range Keltner Channel and a linear-regression momentum, which behave near-identically in practice. The default 20/2.0/20/1.5 parameters are the classic settings.
Why did the amber dots disappear?
The squeeze released. Dots print only while the Bollinger Bands are fully inside the Keltner Channel; the white diamond marks the exact release bar, and after that the zero line stays clean until the next compression begins. No dots means no squeeze — by design, not a rendering issue.
Should I raise Momentum Smoothing?
The default of 1 leaves the histogram raw, matching the classic indicator — that's the right choice for most traders, since the two-tone coloring already encodes acceleration. Raising it applies an EMA that calms the color flips at the cost of lag on exactly the bars where timing matters most.
What timeframes does it work on?
All of them, with a tradeoff: low timeframes produce frequent small squeezes with noisier fires, while 4H and daily squeezes are rare but precede the moves that define the week. A common approach is to spot the squeeze on the higher timeframe and time the entry on a lower one.
Catch the release, not the chop
Squeeze Momentum is available on every Crodl terminal chart — add it from the indicator picker, set the alerts, and let the market tell you when it's coiled instead of guessing, with execution on six exchanges one click away.
This article is for educational purposes only and is not financial advice. Leveraged trading carries substantial risk of loss. Always do your own research and never risk more than you can afford to lose.

Ready to automate your trading?
Connect your exchange, set up automations, and start trading smarter — all from one platform.
Start Trading Free