
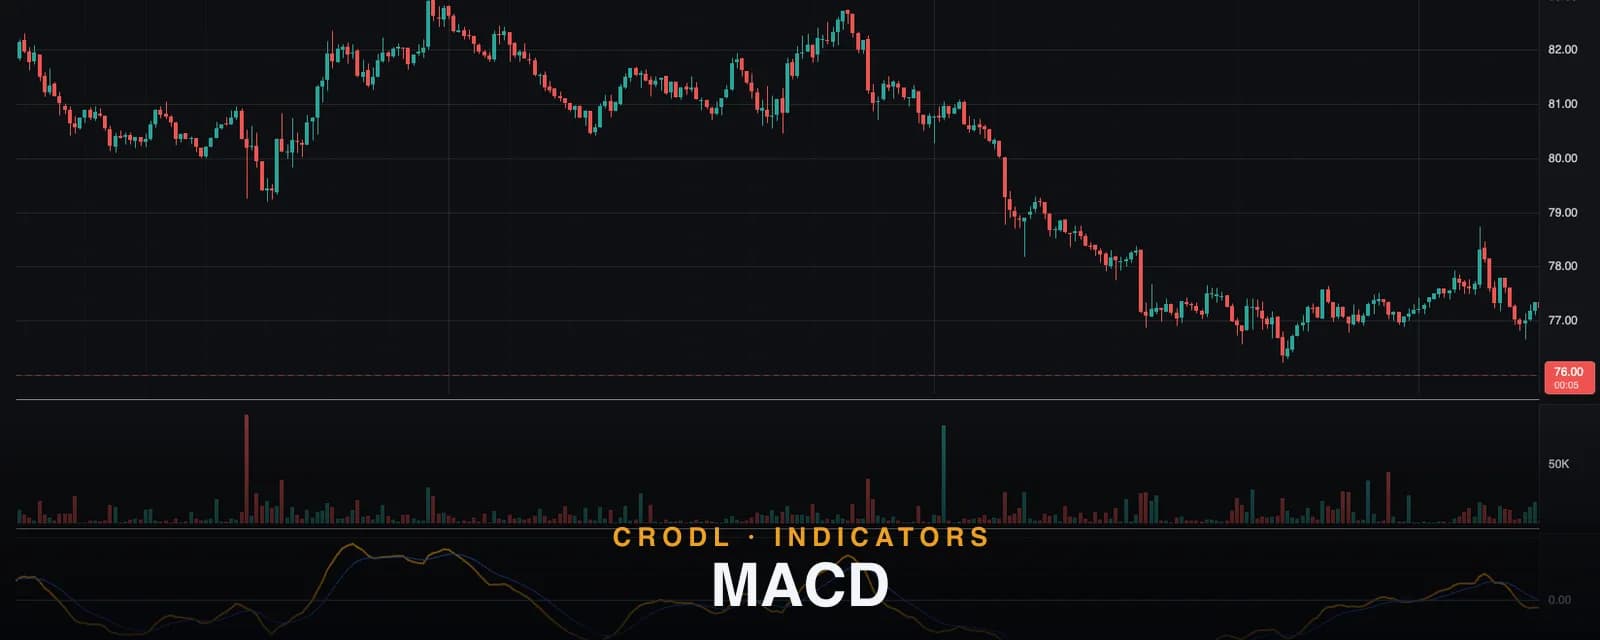
MACD
The classic 12/26/9 MACD on Crodl's terminal: how the line, signal, and bicolor histogram are computed, the four built-in crossover alerts, and how traders use each.
Moving averages tell you where the trend is; the distance between two of them tells you where it's going. That's the insight behind Moving Average Convergence Divergence — MACD — developed by Gerald Appel in the late 1970s, with the histogram added by Thomas Aspray in 1986. Half a century on, the 12/26/9 MACD is still arguably the most-watched momentum indicator in existence, which alone makes it worth having on your chart: levels and crossovers matter partly because everyone sees them.
The MACD preset on the Crodl terminal renders the full classic package in its own pane — MACD line, signal line, a bicolor histogram, and a dashed zero line — with four crossover alerts wired in and a live context panel showing the current reading. This post covers how each piece is built, exactly what our implementation plots, and the three distinct ways traders read it.
What MACD shows
The construction is three steps, each feeding the next. The MACD line is the 12-period EMA of price minus the 26-period EMA — when the fast average pulls above the slow one, recent momentum is outrunning the established trend, and the line rises above zero. The signal line is a 9-period EMA of the MACD line itself: a smoothed shadow that turns momentum shifts into crossovers. The histogram is the gap between the two — it shrinks as a move loses steam and flips sign at every crossover, making it the earliest-moving (and noisiest) component.
The result is one pane that reads at three speeds: the histogram turns first, the signal cross confirms second, and the zero cross — the slowest, most reliable read — marks the actual regime change.
One caveat worth internalizing: unlike RSI, MACD is unbounded and denominated in price units. A MACD of 500 means nothing on its own — it depends entirely on the asset's price — so you compare MACD against its own recent history, never across symbols.
How it works on the Crodl terminal
The preset is a Rune script (macdOscillator) in a dedicated pane. The parameters are the Appel classics:
- Fast Length — default 12 (range 1–200)
- Slow Length — default 26 (range 1–400)
- Signal Length — default 9 (range 1–100)
- MACD Color — default amber, for the main line
The engine computes the MACD line, signal line, and histogram from exponential moving averages of the close. The histogram is bicolor: bars at or above zero render green, bars below render red, both at moderate opacity so the lines stay readable on top. The MACD line draws at two-pixel weight in the accent color with its live value tracked on the scale; the signal line is thinner, in blue; and a dashed zero line anchors the pane. A context panel shows the live MACD value as a number, with a "bull" status chip while it's positive.
Four alerts ship with the preset — the complete set of crossings traders actually act on:
| Alert | Fires when | Typical use |
|---|---|---|
| bull_cross | MACD crosses above the signal line | With-trend long timing |
| bear_cross | MACD crosses below the signal line | Exiting longs, short timing |
| zero_up | MACD crosses above zero | Regime turns bullish |
| zero_down | MACD crosses below zero | Regime turns bearish |
Set them once and the pane watches itself — no staring at a histogram waiting for a flip.
How traders use it
Signal crossovers, filtered by regime
The signal cross is MACD's classic entry trigger, and its well-known flaw is chop: in a sideways market it crosses constantly and profitlessly. The standard fix is to trade crossovers only in the direction of the zero line — take bull crosses when MACD is above zero (momentum joining an uptrend), bear crosses below zero. That single filter converts the MACD from a whipsaw machine into a pullback-continuation tool.
The zero line as a trend filter
The zero cross means the 12-EMA has crossed the 26-EMA on price itself — a genuine trend event, not just a momentum wiggle. Many traders use it purely as a bias switch: long setups only while MACD holds above zero, shorts only below. It's slow by design; pairing it with a bounded oscillator like RSI for timing gives you regime and trigger from two independent constructions.
Histogram inflections — the early, noisy tell
Aspray added the histogram precisely because it moves first: the bars peak and start shrinking before the signal cross prints. A shrinking green histogram during an uptrend says the thrust is decelerating — useful for tightening stops or taking partials ahead of the crossover. The cost of that earliness is noise, which is why histogram reads work best as trade management, not trade entry. Traders who want compression-and-release context around these inflections often run Squeeze Momentum in the next pane.
Divergence
A new price high with a lower MACD high means the second leg had less momentum than the first — bearish divergence, one of the strongest warnings the indicator gives. Grading and trading these setups is covered in depth in our divergence guide.
Frequently Asked Questions
Why 12, 26, and 9?
They're artifacts of the six-day trading week Appel worked with — roughly two weeks, one month, and a week and a half of sessions. Crypto trades 24/7, so the calendar logic no longer applies, but the defaults remain the settings the entire market watches, and self-fulfilling behavior is real. All three lengths are editable in the preset if you want a faster or slower study.
Should I use MACD or RSI?
Both — they answer different questions. MACD is unbounded and trend-following: it tells you which regime you're in and when momentum joins or leaves the trend. RSI is bounded and mean-reverting: it tells you when a move is stretched. The classic pairing uses MACD for direction and RSI for timing; when both agree, the signal quality jumps.
Is a green histogram a buy signal?
No — green only means the MACD line is above its signal line right now. A tall green bar late in an extended rally is often closer to an exit than an entry. Read the histogram's direction of change (growing versus shrinking) and its context relative to the zero line, not its color alone.
How do I deal with MACD's lag?
You don't eliminate it — every moving-average construction lags — you allocate it. Use the slow, reliable zero line for regime, the medium-speed signal cross for entries, and the fast histogram for management. Shortening the lengths reduces lag but multiplies false crosses; most traders keep 12/26/9 and add filters instead.
Put the classic to work
The MACD preset is available on every Crodl terminal chart — add it from the indicator picker, wire up the four alerts, and trade the crossovers with execution on six exchanges in the same window.
This article is for educational purposes only and is not financial advice. Leveraged trading carries substantial risk of loss. Always do your own research and never risk more than you can afford to lose.

Ready to automate your trading?
Connect your exchange, set up automations, and start trading smarter — all from one platform.
Start Trading Free