
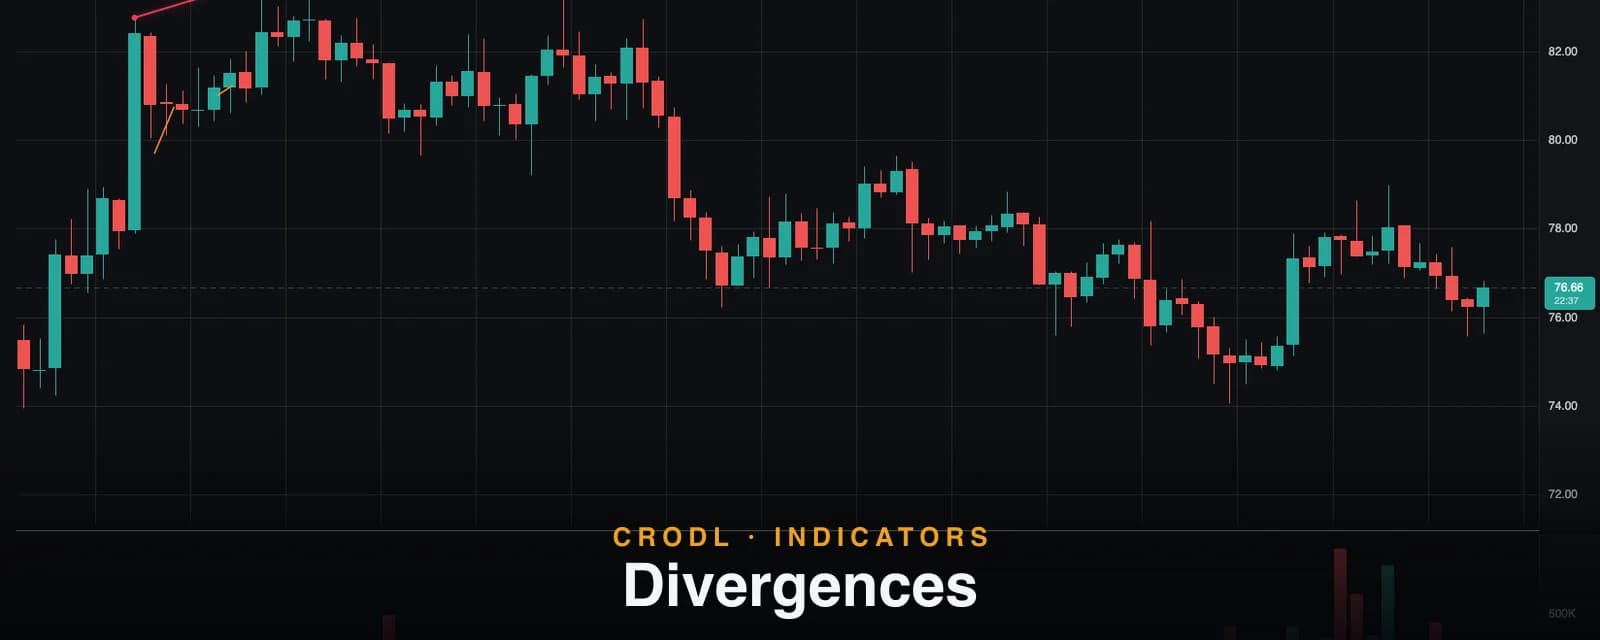
Divergences: Auto-Detected RSI, MACD and OBV Divergences on Your Chart
How Crodl's Divergences indicator finds regular and hidden RSI, MACD and OBV divergences between confirmed swing pivots and draws them pivot-to-pivot on price.
Divergence is one of the few oscillator signals with a genuinely sound premise: when price makes a new extreme but momentum refuses to confirm it, the move is running on fewer buyers or sellers than the last one. The problem has never been the concept — it is the workload. Scanning every swing pair against an oscillator, on every pair you trade, is exactly the kind of repetitive pattern-matching humans do badly and inconsistently.
The Divergences indicator on the Crodl terminal does the scan for you. It computes RSI, MACD histogram, or OBV under the hood, finds confirmed price swing pivots, compares consecutive pivot pairs against the oscillator, and draws every qualifying divergence directly on the price chart as a line connecting the two pivots — labeled, color-coded, and detected with strict no-lookahead rules.
You never see the oscillator itself unless you want to. The divergence is drawn where you trade: on price.
What the Divergences indicator shows
Each detected divergence is a sloped line between two price pivots — under the swing lows for bullish divergences (green by default), over the swing highs for bearish ones (red). Regular divergences draw solid; hidden divergences draw dashed. Small dots mark both anchor pivots, and a compact tag near the second pivot names the signal: Bull Div, Bear Div, or with an H prefix for hidden variants.
The freshest divergence in each direction gets a subtle glow so the current signal stands out from history, and the chart keeps at most Max drawn divergences (default 6) — the most recent across all types — so the study never buries the candles.
How it works on the Crodl terminal
- Compute the oscillator. Your pick of RSI (Wilder smoothing, default length 14), MACD histogram (the standard 12/26/9 EMAs), or OBV (on-balance volume). The setting is Oscillator; RSI length applies only to RSI — MACD's periods are fixed and OBV has no parameter.
- Find strict price pivots. A swing high must be the sole maximum across ±
Pivot strengthbars (default 5); swing lows mirror. A pivot is confirmed onlyPivot strengthbars after it prints. - Compare consecutive pivot pairs. For each pair of same-side pivots between 5 and
Max bars between pivots(default 60) bars apart, the indicator reads the oscillator extreme within ±2 bars of each price pivot — momentum extremes rarely land on the exact price bar, so a small tolerance window prevents missed signals. - Classify. Higher high in price with a lower high in the oscillator is regular bearish; lower low with a higher low is regular bullish. The hidden variants (lower high with higher oscillator high; higher low with lower oscillator low) are detected only when Hidden divergences is enabled.
- Stamp the detection bar. A divergence officially exists at the second pivot's confirmation bar. Nothing after that bar is consulted — the ±2-bar oscillator window closes before confirmation — so the detection is causally clean and backtest-honest.
Each divergence also carries a strength score — the oscillator gap between the two pivots, normalized by the oscillator's full range — which nudges the line's opacity so bigger momentum gaps read slightly bolder.
| Type | Price is making | Oscillator is making | Typically read as |
|---|---|---|---|
| Regular bullish | Lower low | Higher low | Downtrend losing force — reversal watch |
| Regular bearish | Higher high | Lower high | Uptrend losing force — reversal watch |
| Hidden bullish | Higher low | Lower low | Pullback in an uptrend — continuation |
| Hidden bearish | Lower high | Higher high | Bounce in a downtrend — continuation |
The settings that matter
- Oscillator — RSI (default), MACD histogram, or OBV. Different lenses: RSI measures relative momentum, MACD histogram measures momentum-of-momentum, OBV brings volume into the comparison.
- Pivot strength — swing significance and confirmation lag (default 5 bars).
- Max bars between pivots — the widest pivot pair considered (default 60). Wider catches slower divergences; narrower keeps signals tactically tight.
- Hidden divergences — off by default; enable it if you trade continuation setups.
- Max drawn — how many recent divergences stay on the chart (default 6).
How traders use it
Reversal watch at exhausted extremes
The classic play: a regular divergence forming at a meaningful level — a Visible S/R zone or a high-timeframe boundary — is a signal to stop chasing and start watching for reversal structure. Divergence marks the conditions for a turn; the entry still comes from price.
Continuation filtering with hidden divergences
Hidden divergences lean the other way: they appear on pullbacks within trends and argue for continuation. Trend traders enable them and treat a hidden bullish signal on a retrace as a filter that favors re-entry over exit.
Confluence with momentum and exhaustion tools
Divergence rarely stands alone. Pairing it with RSI overbought/oversold context tells you whether momentum is stretched and fading; pairing it with a Candle Countdown 9 stacks slowing momentum on top of an extended run — two independent exhaustion reads agreeing at the same place.
Choosing the oscillator per market
RSI is the general-purpose default. OBV divergences are useful when you specifically care about volume drying up into new extremes. The MACD histogram flags fading acceleration earliest but is also the twitchiest of the three.
Honest limitations
Confirmation lag is inherent: the divergence is only detected Pivot strength bars after the second pivot prints (5 bars at defaults), so you will never catch the exact top or bottom tick — the design trades immediacy for signals that never redraw. And divergence is a condition, not a trigger: strong trends can print divergence after divergence while price keeps running. The strength score and the drawn cap help, but nothing here removes the need for a confirming entry.
Frequently Asked Questions
Does it repaint?
No. Detection happens at the second pivot's confirmation bar using only data available at that bar. Once drawn, a divergence line never moves; new signals appear as new pivots confirm, and the oldest drop off when Max drawn is exceeded.
Why don't I see any divergences?
The filters are deliberately strict: pivot pairs must be 5–60 bars apart (at defaults), both pivots must be strict swings, and hidden divergences are off by default. Widen Max bars between pivots, lower Pivot strength, or enable Hidden divergences to see more.
Which oscillator should I use?
Start with RSI — it is the default and the most widely-referenced divergence oscillator. Switch to OBV when volume confirmation matters to your process, or to the MACD histogram if you want the earliest read on fading acceleration and can tolerate more noise.
Are hidden divergences worth turning on?
If you trade trend continuation, yes — that is exactly the regime they describe. If you only trade reversals, leaving them off keeps the chart focused on regular signals.
Stop scanning, start reading
The Divergences indicator ships on every Crodl terminal chart — add it from the indicator picker and every RSI, MACD, or OBV divergence draws itself on price, on every pair, alongside live trading on six exchanges.
This article is for educational purposes only and is not financial advice. Leveraged trading carries substantial risk of loss. Always do your own research and never risk more than you can afford to lose.

Ready to automate your trading?
Connect your exchange, set up automations, and start trading smarter — all from one platform.
Start Trading Free