
RSI
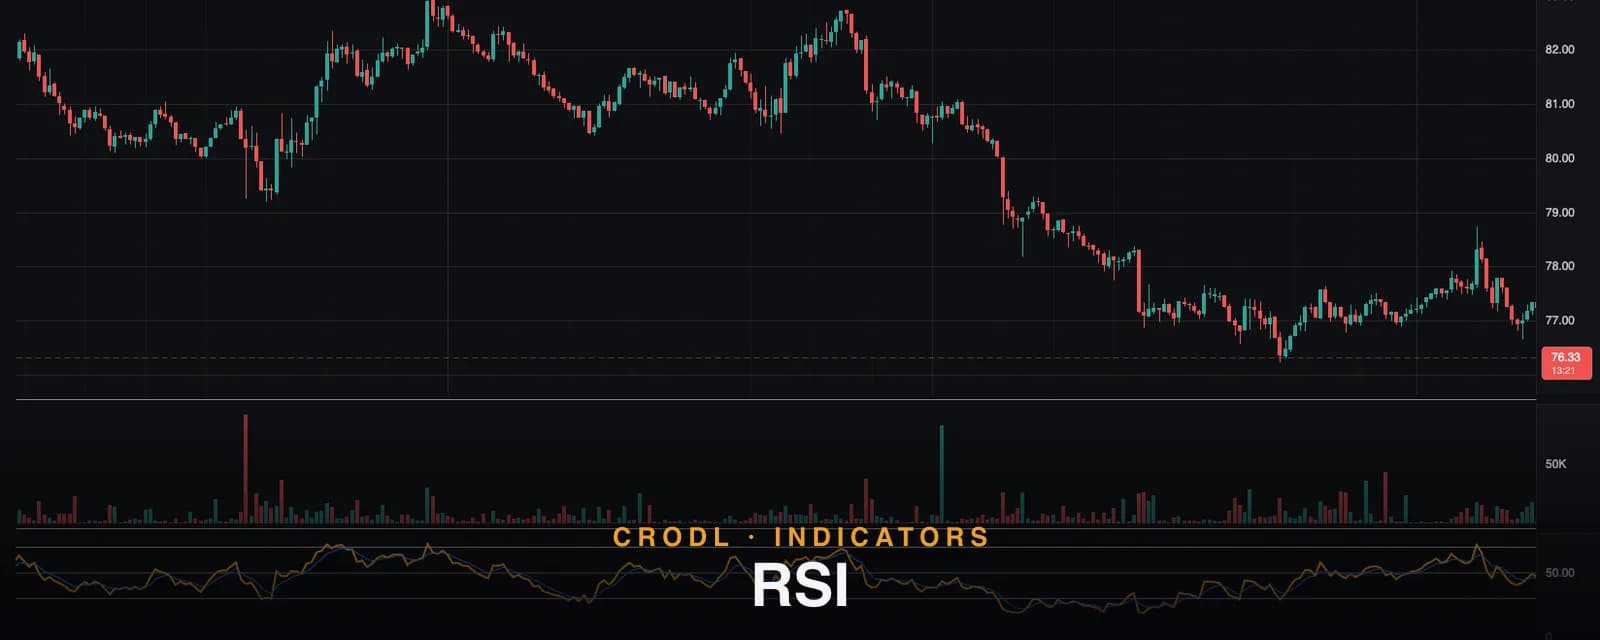
How the RSI preset on Crodl's terminal works: 14-period RSI in its own pane with a 5-period EMA signal line, a midline histogram, 70/30 bands, and crossover alerts.
If you learn one oscillator, it's this one. The Relative Strength Index — introduced by J. Welles Wilder in his 1978 book New Concepts in Technical Trading Systems — compresses the tug-of-war between recent gains and recent losses into a single bounded line from 0 to 100. Nearly fifty years later it remains the most-watched momentum indicator in every market, crypto very much included.
The RSI preset on the Crodl terminal renders the classic oscillator in its own pane beneath the chart, and adds three things to Wilder's original: an EMA signal line for crossover timing, a momentum histogram around the 50 midline, and a live context panel with the current reading and state. This post covers how the number is built, exactly what our implementation plots, and how traders actually use each piece.
What RSI shows
RSI measures the relative strength of up-moves against down-moves over a lookback window. Average the gains and the losses over the last N bars (Wilder used his own smoothing, equivalent to a slow EMA), take the ratio, and normalize it onto a 0–100 scale: RSI = 100 − 100 / (1 + avg gain / avg loss). When every bar closes higher, RSI pushes toward 100; when sellers dominate, it sinks toward 0; a balanced tape reads near 50.
Because the scale is bounded, the same reading means the same thing on any symbol and any timeframe — which is what makes the classic zones portable:
| Zone | Reading | Typical interpretation |
|---|---|---|
| Overbought | Above 70 | Rally stretched — risk of pullback, or strength if it holds |
| Bullish | 50–70 | Buyers in control, healthy uptrend territory |
| Neutral | Around 50 | Equilibrium — no side in control |
| Bearish | 30–50 | Sellers in control, downtrend territory |
| Oversold | Below 30 | Decline stretched — risk of bounce, or weakness if it holds |
The zones are the famous part, but the 50 line is the underrated one: it's the boundary between average gains exceeding average losses and the reverse, which makes it a genuine trend filter rather than just a midpoint.
How it works on the Crodl terminal
The preset is a Rune script (rsiOscillator) that renders in a dedicated pane with its own scale. Two lengths are configurable:
- Length — default 14 (range 1–100). The RSI lookback, Wilder's original setting.
- Signal Length — default 5 (range 1–50). The EMA smoothing applied to RSI to form the signal line.
Four elements draw in the pane. The RSI line plots in the accent color (amber by default, configurable) at two-pixel weight, with its live value tracked on the scale. The signal line is a 5-period EMA of the RSI itself, drawn thinner in blue — a smoothed shadow of the oscillator that turns momentum shifts into clean crossovers. The momentum histogram plots RSI − 50 around a zero baseline at low opacity, so the distance from the midline reads as bars: above zero means bullish regime, and growing bars mean strengthening momentum. Dashed guide lines mark 70, 50, and 30.
The signal line is an addition to Wilder's original — it exists to give the oscillator objective timing. Two alerts are wired to it out of the box: a bull alert when RSI crosses above its signal, and a bear alert when it crosses below. If you prefer a pure classic RSI, set Signal Length to 1 and the signal collapses onto the RSI line itself.
The preset also ships a context panel — the live RSI value as a number, a "bull" status chip while RSI holds above 50, and a "stretched" warning chip whenever the reading is above 70 or below 30 — so you can read the state without eyeballing the plot.
How traders use it
The 50 line as a regime filter
Before anything else, RSI answers "who's in control?" Holding above 50 across pullbacks is the signature of an uptrend; repeated failures at 50 from below are the signature of a downtrend. Many traders take long setups only while RSI sits above 50 — a one-line filter that keeps them from fading strong trends. Pair it with a MACD zero-line read for a two-vote regime check.
Overbought and oversold — with the honest caveat
Fading 70/30 works beautifully in ranges and fails expensively in trends. In a strong crypto uptrend, RSI can pin above 70 for days while price grinds higher — "overbought" becomes evidence of strength, not a short signal. The practical rule: fade the bands only when the higher-timeframe structure is a range, and in trends treat a dip toward 50 (not 30) as the pullback zone.
Signal crosses for timing
The stretched zones tell you where a reversal is plausible; the signal cross tells you when momentum actually turned. An RSI cross up through its signal from below 30 is a much better-timed long trigger than "it's oversold" alone — the built-in alerts fire on exactly these crosses so you don't have to watch the pane. For faster-cycling entries some traders run a Stochastic alongside, which reaches its extremes more readily than RSI.
Divergence
When price prints a lower low but RSI prints a higher low, the selling pressure behind the new low is weaker than the last one — classic bullish divergence, and one of the highest-quality signals the oscillator produces. We cover spotting and grading these setups in the divergence guide.
Frequently Asked Questions
Why does RSI stay overbought in strong trends?
Because the average gain genuinely stays that much larger than the average loss — the reading is accurate, the "overbought means reversal" interpretation is what breaks. Bounded oscillators saturate in persistent trends. That's why the 50-line regime read matters more than the bands whenever the market is trending.
What length works best for crypto?
The default 14 is the standard and the crowd-watched setting. Scalpers sometimes drop to 7–9 for a faster, noisier line; swing traders stretch to 21 for a smoother one. Changing the length changes what "70" means, though — a 7-period RSI hits the bands constantly — so re-calibrate your zones if you move off 14.
What is the signal line? I don't see it on other platforms.
It's Crodl's addition: a 5-period EMA of the RSI, giving the oscillator an objective crossover trigger (and powering the built-in bull/bear alerts). Wilder's original has no signal line, and many charting packages omit it. Set Signal Length to 1 to effectively disable it.
Is RSI the same as Stochastic RSI?
No. RSI is an oscillator on price; Stochastic RSI applies the stochastic formula to RSI itself, making it far twitchier. They're separate presets on the Crodl terminal — Stochastic RSI suits traders who want more signals, plain RSI suits those who want fewer, cleaner ones.
Read momentum in one glance
The RSI preset is available on every Crodl terminal chart — add it from the indicator picker, and you get the oscillator, signal line, midline histogram, and live alerts running alongside trading on six exchanges.
This article is for educational purposes only and is not financial advice. Leveraged trading carries substantial risk of loss. Always do your own research and never risk more than you can afford to lose.

Ready to automate your trading?
Connect your exchange, set up automations, and start trading smarter — all from one platform.
Start Trading Free