
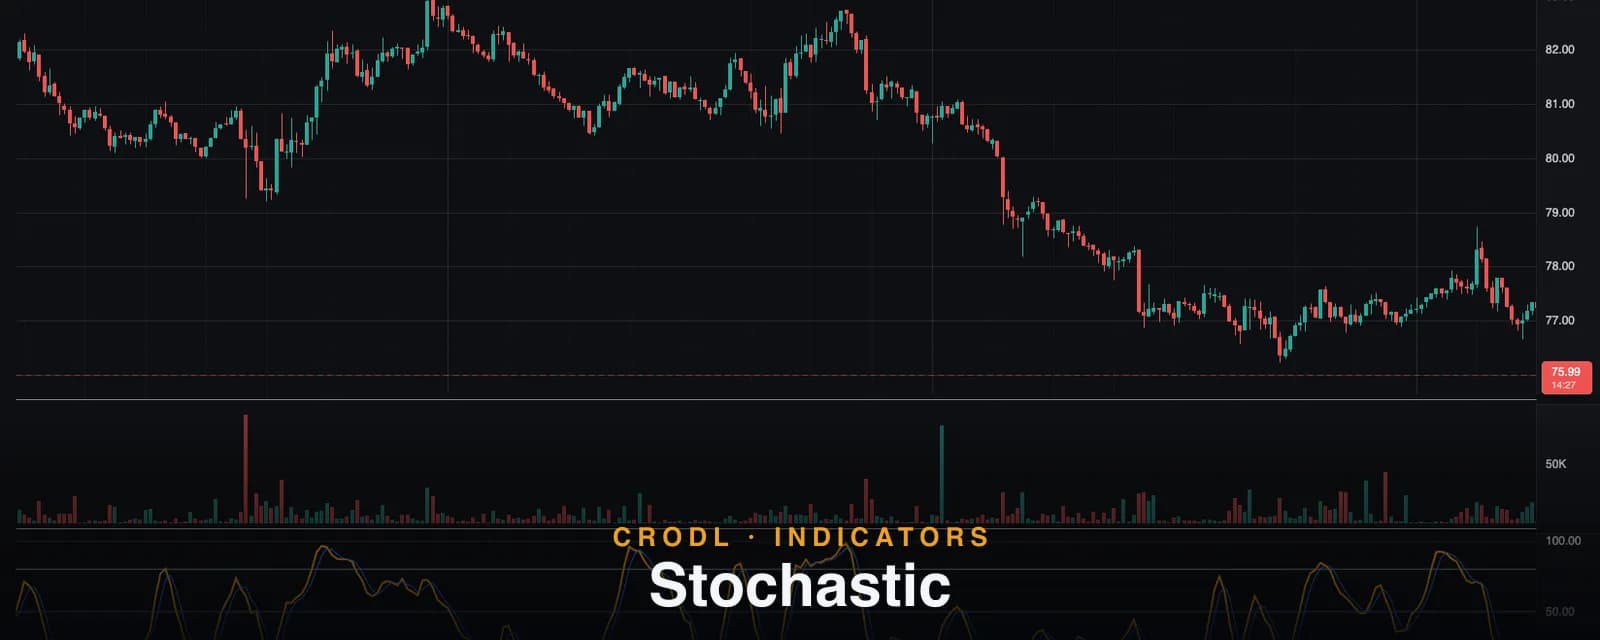
Stochastic
The Stochastic oscillator shows where price closed inside its recent range. How Crodl's 14-3-3 %K/%D preset works and how crypto traders use the 80/20 bands.
Momentum fades before price turns. That is the observation George Lane built the Stochastic oscillator around in the 1950s, and it is just as true on a BTC perpetual chart as it was on commodity futures: in an advance, closes cluster near the top of the recent range — and as the move exhausts, closes start slipping toward the middle of the range even while price is still grinding higher.
The Stochastic oscillator turns that into a single number between 0 and 100: where did this bar close relative to the highest high and lowest low of the lookback window? Near 100 means price is closing at the top of its range; near 0, the bottom. Two smoothed lines — %K and %D — cross each other around those extremes, and those crosses are among the oldest timing signals in technical analysis.
This guide covers what the oscillator actually measures, the exact defaults behind Crodl's Stochastic preset, and the ways crypto traders get real use out of it — including the one mistake that costs stochastic traders the most money.
What the Stochastic oscillator measures
The raw calculation is range position:
- Raw %K = 100 × (close − lowest low) ÷ (highest high − lowest low), over the lookback window
- %K = a moving average of raw %K (the "slow" smoothing)
- %D = a moving average of %K (the signal line)
Because the output is bounded between 0 and 100, it behaves the same on a $0.30 altcoin and a $100,000 BTC chart. Readings above 80 are conventionally called overbought — price is closing pinned to the top of its recent range — and readings below 20 oversold.
The key nuance: the Stochastic measures range position, not value. Overbought does not mean expensive. It means buyers have been strong enough to close price at the highs — which in a trending market is a feature of the trend, not a sell signal. That distinction drives everything in the usage section below.
How it works on the Crodl terminal
Crodl's Stochastic is a Rune preset — add it from the indicator picker and it opens in its own oscillator pane with the classic slow-stochastic configuration:
- %K Length: 14 — the highest-high/lowest-low window (adjustable 1–200).
- %K Smoothing: 3 — raw %K is smoothed with a 3-period SMA. This is what makes it the "slow" stochastic; set it to 1 and you have the fast version.
- %D Smoothing: 3 — %D is a 3-period SMA of %K.
- Bands at 80 / 50 / 20 — dashed guide lines for the overbought zone, midline, and oversold zone.
%K is drawn as the bold orange line (with its live value tracked on the price axis), %D as the thinner blue signal line. If the market goes completely flat — highest high equals lowest low over the window — the preset pins the reading at a neutral 50 instead of dividing by zero, so the line never gaps or spikes on dead-volume altcoin candles.
The preset also ships with a Stochastic Context panel showing the live %K value and an overbought status flag when %K is above 80, plus four built-in alert conditions you can route to notifications:
| Alert | Fires when |
|---|---|
bull_cross | %K crosses above %D |
bear_cross | %K crosses below %D |
leave_oversold | %K crosses up through 20 |
leave_overbought | %K crosses down through 80 |
The two "leave" alerts are deliberately the exit of the zone, not the entry — momentum turning out of an extreme has historically been the higher-quality event than momentum reaching it.
How traders use it in crypto
Mean reversion inside a range
The textbook use, and it genuinely works — inside a confirmed range. When price is chopping between support and resistance, a %K/%D bullish cross below 20 near range support is a clean long trigger, with the mirror cross above 80 at range resistance for shorts. The oscillator is doing exactly what it was built for: flagging closes at range extremes just as they lose momentum.
Pullback timing inside a trend
The higher-win-rate application. In an established uptrend, ignore overbought entirely and use only the oversold side: each dip that drags %K below 20 and then produces a bullish cross is a pullback entry in the direction of the larger flow. Trend direction can come from structure, a moving average, or a slower confirmation tool like the RSI on a higher timeframe.
The embedding trap
The mistake that hurts: shorting because the Stochastic reads 85. In a strong crypto trend, %K can sit embedded above 80 for dozens of bars while price doubles — pinned overbought is what a powerful trend looks like by definition. If you want an extreme reading you can actually fade, demand confluence: divergence (price makes a higher high, %K makes a lower high), a level, or a shift in structure.
Pairing with related oscillators
The Stochastic reads range position of price. Its faster cousin, the Stochastic RSI, runs the same formula on RSI values instead and turns more cycles per week — useful when the standard Stochastic barely leaves the midzone. Williams %R is the same range-position math on an inverted 0 to −100 scale with no smoothing at all, for traders who want the raw reading.
Frequently Asked Questions
What is the difference between the fast and slow Stochastic?
Only the %K smoothing. Fast Stochastic plots raw %K directly (smoothing of 1); slow Stochastic smooths it — Crodl's default of 3 gives the classic 14-3-3 slow configuration. Slow is the standard because raw %K whipsaws violently on noisy crypto candles.
What are the best Stochastic settings for crypto?
Start with the 14-3-3 defaults — they are the reference configuration everyone else is watching, which matters for self-fulfilling levels. Scalpers sometimes drop the length to 9 or 5 for faster turns at the cost of noise; swing traders on 4h/1D charts often leave it untouched and simply demand more confluence per signal.
How is the Stochastic different from RSI?
RSI measures the speed of price changes (average gain versus average loss); the Stochastic measures where price closed within its range. They often agree, but the Stochastic is snappier and hits its extremes far more often. Many traders use RSI for regime and divergence, and the Stochastic for entry timing within that regime.
Does the Stochastic repaint?
No. Each value is computed from completed highs, lows, and closes. The current live bar updates until it closes — as with any indicator — but historical values never change.
Put it on a chart
The Stochastic is one click away on every Crodl terminal chart — add it from the indicator picker, tune the 14-3-3 defaults if you want, and wire its crossover alerts straight into your workflow, alongside live trading on six exchanges.
This article is for educational purposes only and is not financial advice. Leveraged trading carries substantial risk of loss. Always do your own research and never risk more than you can afford to lose.

Ready to automate your trading?
Connect your exchange, set up automations, and start trading smarter — all from one platform.
Start Trading Free