
Stochastic RSI
Stochastic RSI runs the stochastic formula on RSI instead of price, giving a faster cycle-timing tool. Crodl's 14/14/3/3 preset, the 80/20 bands, and how to trade it.
The complaint every RSI trader eventually has: the thing barely moves. On a trending crypto chart, RSI can spend weeks oscillating between 45 and 65 — never touching 70 or 30, never giving a signal — while price swings 20% in each direction underneath it.
The Stochastic RSI was built to fix exactly that. Instead of asking "where is RSI on its absolute 0–100 scale?", it asks "where is RSI relative to its own recent range?" It applies the stochastic formula to RSI values rather than price, so even a modest RSI wiggle from 48 to 58 can register as a full swing from 0 to 100 if that is the whole range RSI has covered lately. The result is an indicator that cycles fast, hits its extremes constantly, and hands you far more timing signals than RSI ever will.
That sensitivity is a double-edged sword — more signals means more noise — so this guide covers what the Stoch RSI actually computes, the exact defaults in Crodl's preset, and how crypto traders filter its speed into something tradable.
What the Stochastic RSI measures
It is an indicator of an indicator, computed in two stages:
- Compute RSI on closing prices over the RSI length.
- Run the stochastic formula on those RSI values: 100 × (RSI − lowest RSI) ÷ (highest RSI − lowest RSI), over the stochastic lookback window.
The output is bounded 0–100. A reading of 100 means RSI is at the very top of its recent range — momentum is as stretched as it has locally been — and 0 means the bottom. Like the classic Stochastic, it is then smoothed into a %K line and a %D signal line whose crosses provide the timing.
The crucial mental model: Stoch RSI measures momentum relative to recent momentum, two derivatives away from price. That makes it exquisitely sensitive to turns and completely blind to absolutes — a Stoch RSI of 100 tells you nothing about whether RSI itself is at 55 or 85. It is a timing tool, not a strength gauge.
How it works on the Crodl terminal
Crodl's Stochastic RSI is a Rune preset that opens in its own oscillator pane with four tunable inputs:
| Parameter | Default | Range |
|---|---|---|
| RSI Length | 14 | 1–200 |
| Stochastic Length | 14 | 1–200 |
| %K Smoothing | 3 | 1–50 |
| %D Smoothing | 3 | 1–50 |
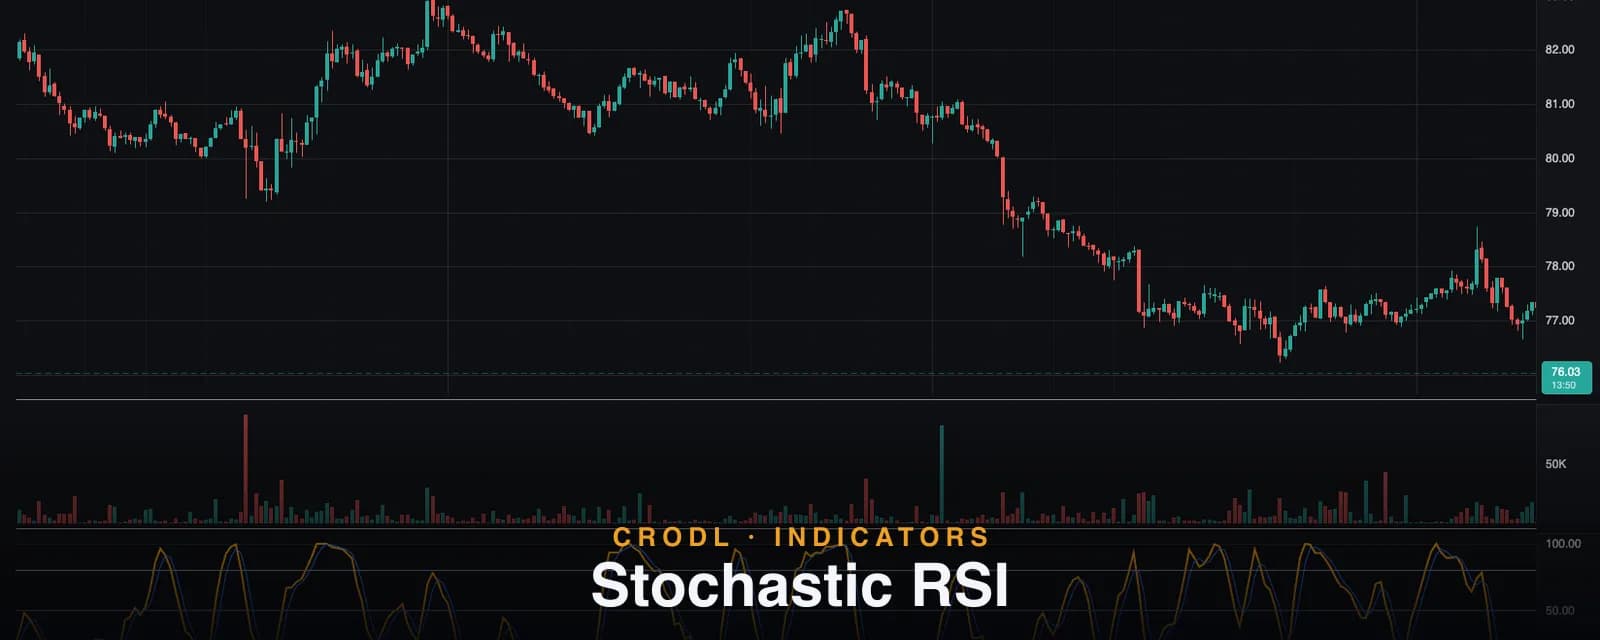
That is the standard 14/14/3/3 configuration: a 14-period RSI, a 14-period stochastic window over it, then 3-period SMA smoothing for %K and again for %D. %K draws as the bold orange line with its live value tracked on the axis; %D is the thinner blue signal line. Dashed guide bands sit at 80, 50, and 20.
Two guard behaviors keep the lines clean on real crypto data: during the RSI warm-up period the output stays null instead of plotting garbage, and if RSI goes perfectly flat over the stochastic window (zero range — it happens on dead altcoin pairs), the reading pins to a neutral 50 rather than dividing by zero.
The preset also ships a Stoch RSI Context panel that displays the live underlying RSI value — a genuinely useful touch, since Stoch RSI's biggest blind spot is not knowing where RSI actually is — plus a "stretched" warning status whenever that RSI is above 70 or below 30. Four alert conditions are built in: bull_cross and bear_cross for %K/%D crossovers, leave_oversold when %K crosses up through 20, and leave_overbought when %K crosses down through 80.
How traders use it in crypto
Cycle timing when RSI is silent
The core use case. When RSI is drifting in the 40–60 dead zone and giving nothing, Stoch RSI is still swinging full range — every local momentum ebb and flow becomes a visible cycle. Ranging majors and slow accumulation phases are where it earns its place on the chart.
Trend-filtered crosses only
Raw Stoch RSI crosses are too frequent to trade blind. The standard filter: establish a bias from structure or a higher-timeframe tool, then take only the crosses that agree. In an uptrend, that means longs on bullish %K/%D crosses below 20 — pullback exhaustion — and ignoring every bearish cross above 80, because in a strong trend Stoch RSI pins to 100 constantly and each pin is just the trend breathing.
The pinning problem
This is the failure mode that empties accounts: Stoch RSI at 100 is not a short signal. Because the scale is relative to recent RSI range, a healthy trend produces reading after reading at the extreme. If you fade an extreme, demand real confluence — bearish divergence on the underlying RSI, a key level, or a structural break. The context panel's RSI value helps here: Stoch RSI at 100 with RSI at 58 is a trend behaving normally; with RSI at 88 it is a market that is genuinely stretched.
Layering with slower oscillators
A common stack: RSI (or the classic Stochastic) for regime, Stoch RSI for the trigger. Some traders swap the trigger role to Williams %R when they want raw range-position without the double-derivative sensitivity.
Frequently Asked Questions
Why does my Stoch RSI hit 0 and 100 so often?
By design. It normalizes RSI against its own recent range, so whenever RSI makes a new 14-period high or low — which happens constantly — Stoch RSI prints 100 or 0. The extremes are common events, which is precisely why they need a trend filter or confluence before they are tradable.
Is Stochastic RSI better than RSI?
Different job. RSI measures momentum on an absolute scale and is the better divergence and regime tool; Stoch RSI measures momentum relative to recent momentum and is the better timing tool. Most traders who use Stoch RSI keep RSI in the stack — Crodl's context panel even surfaces the underlying RSI value for exactly this reason.
What are the best Stoch RSI settings for crypto?
The 14/14/3/3 defaults are the reference everyone watches. If it feels too jumpy on low timeframes, raise the smoothing (%K to 5) before touching the lengths — smoothing kills noise without shifting the cycle. Lengthening RSI to 21 slows the whole indicator for swing timeframes.
Does Stochastic RSI repaint?
No. Values are computed from completed closes; the live bar updates until it closes, and history never changes. The early bars of a freshly loaded chart stay empty until the RSI warm-up completes, which is correct behavior rather than missing data.
Put it on a chart
Stochastic RSI is one click away on every Crodl terminal chart — add it from the indicator picker, keep an eye on the underlying RSI in its context panel, and route its crossover alerts into your workflow, alongside live trading on six exchanges.
This article is for educational purposes only and is not financial advice. Leveraged trading carries substantial risk of loss. Always do your own research and never risk more than you can afford to lose.

Ready to automate your trading?
Connect your exchange, set up automations, and start trading smarter — all from one platform.
Start Trading Free