
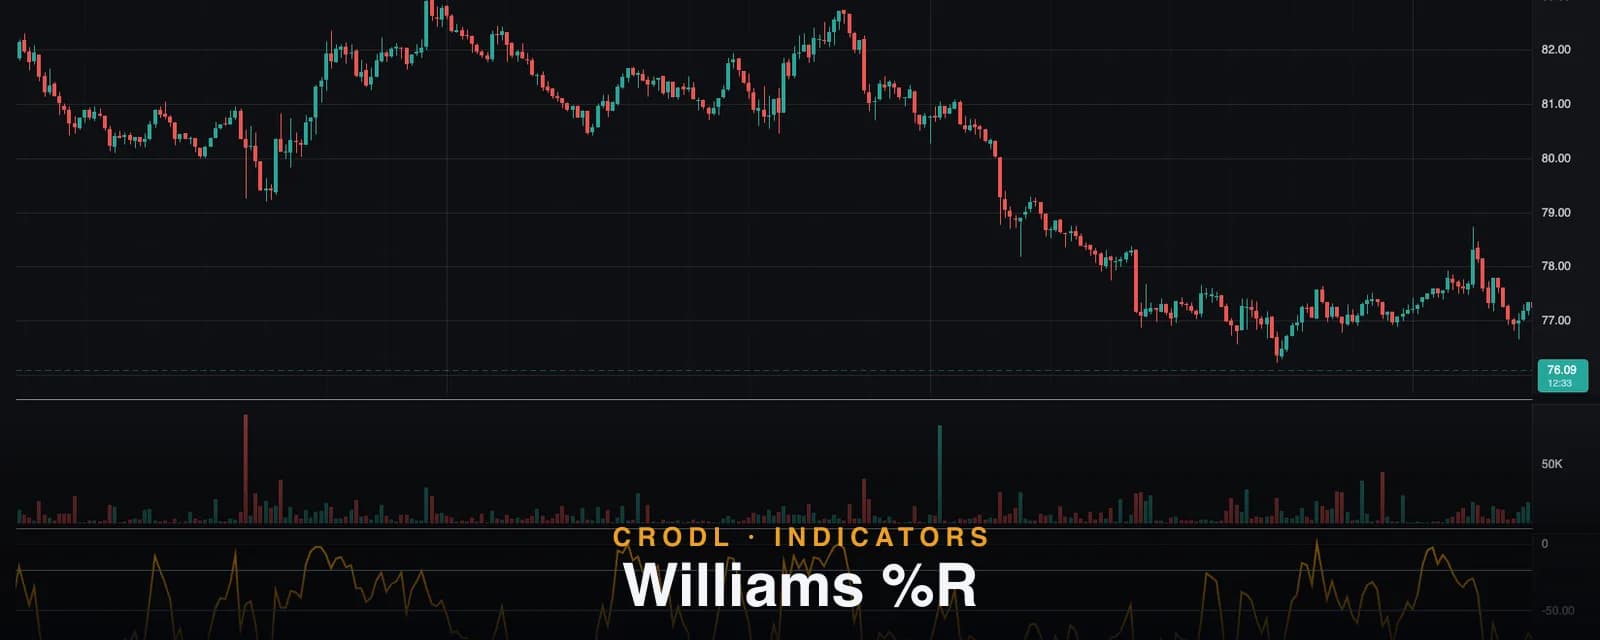
Williams %R
Williams %R measures how close price closed to the top of its 14-bar range on an inverted 0 to -100 scale. Crodl's preset, the -20/-80 zones, and how to trade it.
Larry Williams famously turned $10,000 into over $1.1 million in a single trading year, and the oscillator carrying his name is one of the tools he did it with. Williams %R asks one blunt question every bar: how far below the recent high did price just close?
The answer comes on an inverted scale from 0 to −100. A reading of 0 means price closed at the highest high of the lookback window; −100 means it closed at the lowest low. Everything about the indicator follows from that inversion — overbought lives near the top at −20, oversold near the bottom at −80, and the line itself is deliberately raw: no smoothing, no signal line, just the unfiltered range position of every close.
That rawness is the point. Where the Stochastic smooths its reading twice before you see it, %R shows you momentum the instant it shifts — which makes it one of the fastest exhaustion detectors you can put on a crypto chart, provided you respect what "fast" costs in noise.
What Williams %R measures
The formula is a mirror image of the stochastic %K:
%R = −100 × (highest high − close) ÷ (highest high − lowest low), over the lookback window.
If price closes at the top of its 14-bar range, the numerator is zero and %R reads 0. Close at the very bottom and it reads −100. Mathematically, %R equals the raw stochastic %K minus 100 — the same information, unsmoothed, flipped onto a negative scale.
What it is really tracking is closing strength. Sustained closes near range highs (%R hugging 0 to −20) are the signature of buyers in control; closes sagging to range lows (−80 to −100) show sellers pressing. And because there is no smoothing, %R reacts on the exact bar that closing strength changes — one bar earlier than a slow stochastic, several bars earlier than RSI.
How it works on the Crodl terminal
Crodl's Williams %R is a Rune preset that opens in its own oscillator pane with a deliberately minimal surface:
- Length: 14 — the highest-high/lowest-low lookback (adjustable 1–200). Fourteen is Williams' classic default.
- Zone lines at −20 / −50 / −80 — dashed guides marking the overbought zone, midline, and oversold zone.
- One orange line — %R itself, drawn bold with its live value tracked on the price axis. No signal line, no smoothing inputs: the preset keeps the indicator as Williams designed it.
If the market flatlines — highest high equals lowest low across the window, which real altcoin pairs do manage — the preset returns a neutral −50 instead of dividing by zero, so the plot never breaks on dead candles.
A Williams %R Context panel shows the live reading plus an oversold status flag whenever %R is below −80. Two alert conditions are built in, and both fire on zone exits rather than entries: leave_oversold when %R crosses up through −80, and leave_overbought when %R crosses down through −20. Exit-of-zone is the higher-quality event — it marks the moment stretched momentum actually lets go, not merely the moment it becomes stretched.
How traders use it in crypto
The zones read as follows — with the critical caveat that zone behavior changes with regime:
| %R reading | Zone | In a range | In a strong trend |
|---|---|---|---|
| 0 to −20 | Overbought | Fade candidate at resistance | Normal uptrend behavior — not a short |
| −20 to −50 | Upper neutral | Drifting bullish | Healthy pullback floor in uptrends |
| −50 to −80 | Lower neutral | Drifting bearish | Healthy pullback ceiling in downtrends |
| −80 to −100 | Oversold | Fade candidate at support | Normal downtrend behavior — not a long |
Range-extreme reversals
Inside a defined range, %R is a precision fade tool: a push below −80 at range support followed by a cross back up through −80 is a long trigger with a natural invalidation just below the low. The Crodl alert conditions map exactly onto this pattern.
Reading trend strength from the overbought side
Williams' own counterintuitive insight: in a genuine uptrend, %R staying pinned between 0 and −20 is a strength signal, not a sell signal. Strong trends close near their highs repeatedly. Some trend traders use the failure of that behavior as their exit — when %R stops reaching −20 on rallies and starts printing lower peaks while price grinds to marginal new highs, closing strength is thinning underneath the trend.
Failure swings
A momentum divergence pattern that needs no second indicator: %R drops below −80, bounces, then on the next price low fails to reach −80 again. Sellers could not close price at range lows even on a retest — a classic early-reversal tell, and the mirror version applies at −20 for tops.
Pairing with slower tools
Because %R is raw, most traders pair it with something steadier for context: CCI or RSI for regime and divergence, %R for the entry-timing bar. If you find yourself wanting a smoothed %R with a signal line, that is literally the slow Stochastic — use it instead.
Frequently Asked Questions
What is the difference between Williams %R and the Stochastic?
Same numerator logic, two differences: %R measures distance from the high (inverted 0 to −100 scale) while %K measures distance from the low (0 to 100), and %R is unsmoothed while the slow Stochastic smooths twice and adds a %D signal line. %R = raw %K − 100. Choose %R for speed, the Stochastic for cleaner crosses.
Why is the scale negative?
Convention from Williams' original design: the indicator measures how far price closed below the range high, so the values run from 0 (at the high) down to −100 (at the low). Flip the sign mentally and it reads like any other range-position oscillator.
What are the best Williams %R settings for crypto?
The default 14 is the standard reference. Shortening to 10 or even 7 makes it a scalping trigger at the cost of more whipsaw; lengthening toward 20–28 turns it into a swing tool whose −80/−20 touches become rarer but more meaningful. Adjust the zones themselves (−10/−90) if you trade very trendy pairs where the defaults trigger too often.
Does Williams %R repaint?
No. Every value is computed from completed highs, lows, and closes. The live bar's reading updates until that bar closes, and historical values never change.
Put it on a chart
Williams %R is one click away on every Crodl terminal chart — add it from the indicator picker, watch the −20/−80 zone exits, and route the built-in alerts into your workflow, alongside live trading on six exchanges.
This article is for educational purposes only and is not financial advice. Leveraged trading carries substantial risk of loss. Always do your own research and never risk more than you can afford to lose.

Ready to automate your trading?
Connect your exchange, set up automations, and start trading smarter — all from one platform.
Start Trading Free