
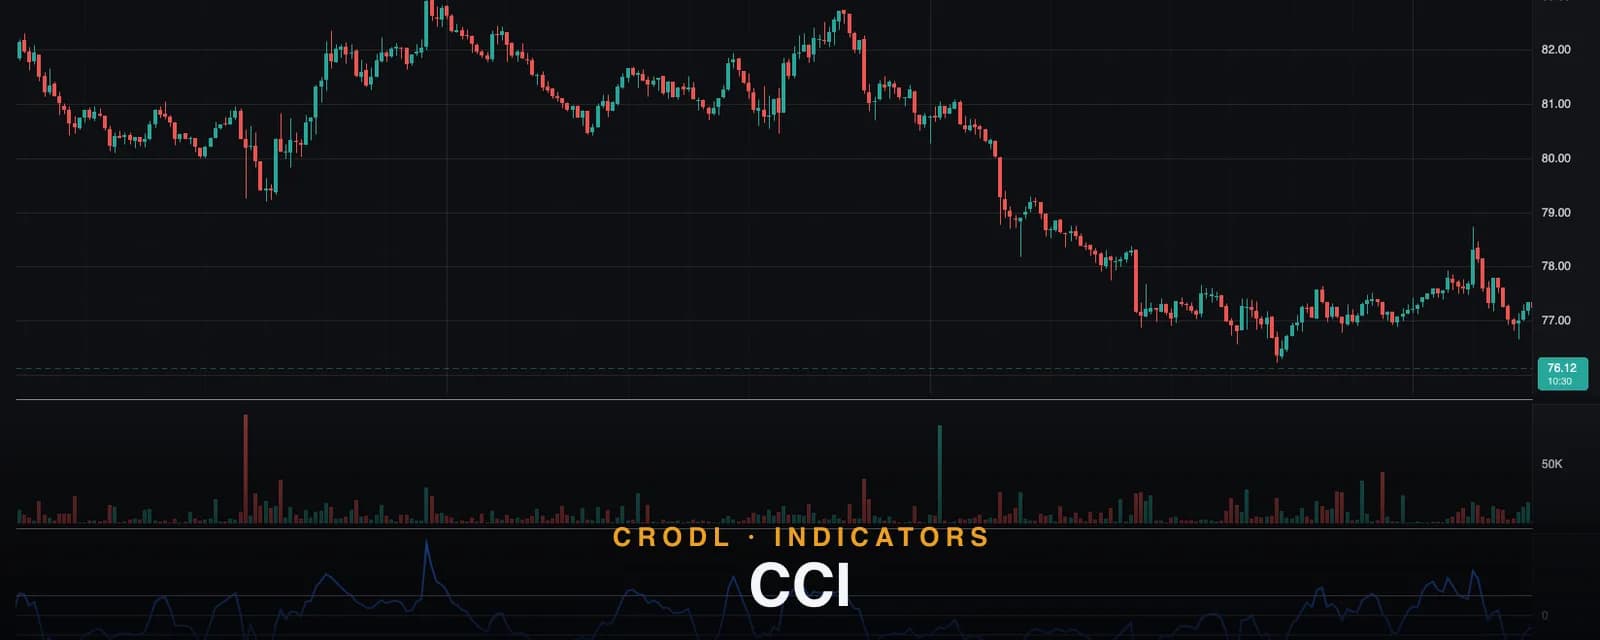
CCI
CCI measures how far typical price has stretched from its 20-period average, scaled by mean deviation. Crodl's preset, the ±100 bands, and how crypto traders use it.
Most oscillators are bounded — RSI and the Stochastic live inside hard 0–100 walls, which means they can only ever tell you "very stretched" and nothing beyond it. The Commodity Channel Index (CCI) takes the opposite design decision: no ceiling, no floor. It measures how far price has strayed from its own average, in units of how far it typically strays, and it will happily print +250 or −400 when a crypto market truly dislocates.
Donald Lambert published the CCI in 1980 for commodity cycles, but the mechanism is asset-agnostic: take the typical price of each bar, compare it to its moving average, and scale the difference by the mean deviation. The scaling constant is chosen so that roughly 70–80% of readings land between −100 and +100. Everything outside those bands is, statistically, unusual strength or unusual weakness — and the entire craft of trading CCI is deciding whether "unusual" means breakout or overdone.
This guide covers the actual computation, the defaults behind Crodl's CCI preset (including a correctness detail most charting implementations get wrong), and both of the opposing ways crypto traders put the ±100 bands to work.
What the CCI measures
Three steps per bar:
- Typical price = (high + low + close) ÷ 3 — a fuller representation of the bar than close alone.
- Distance from average: typical price minus its simple moving average over the lookback window.
- Normalize: divide by 0.015 × the mean deviation of typical price over the same window.
The mean deviation is the average absolute distance of each window value from the current average — a robust volatility measure, less spike-sensitive than standard deviation. Lambert's 0.015 constant is pure scaling: it places the bulk of readings inside ±100 so the bands mean the same thing on any asset.
Read it as a statistical stretch gauge: CCI at +100 says typical price is sitting unusually far above its recent mean, given how volatile the instrument has recently been. Because the volatility normalization adapts, +100 on a quiet market and +100 on a wild one represent the same degree of "unusual."
How it works on the Crodl terminal
Crodl's CCI is a Rune preset that opens in its own oscillator pane:
- Length: 20 — the window for both the typical-price SMA and the mean deviation (adjustable 2–200). Twenty is Lambert's classic default.
- Bands at +100 / 0 / −100 — dashed guides marking the unusual-strength zone, the midline, and the unusual-weakness zone.
- One blue line — the CCI itself, drawn bold with its live value tracked on the price axis.
One implementation detail worth knowing: Crodl computes the mean deviation the canonical way — every value in the window is measured against the current bar's SMA, matching the TradingView ta.dev and TA-Lib reference implementations. Shortcut implementations that measure each window term against its own bar's SMA produce a materially different (and wrong) indicator; Crodl's preset was specifically corrected to the canonical form. A guard also pins CCI to 0 when the mean deviation is exactly zero (a perfectly flat window), so dead altcoin candles never produce a divide-by-zero spike.
Two alert conditions are built in and map onto the momentum-entry playbook: cross_above_100 when CCI pushes up through +100, and cross_below_neg100 when it breaks down through −100.
How traders use it in crypto
CCI supports two opposite playbooks, and knowing which regime you are in decides which one applies:
| CCI reading | Momentum playbook (trending) | Reversion playbook (ranging) |
|---|---|---|
| Crosses above +100 | Long — unusual strength emerging | Stand aside; wait for extension |
| +100 falling back below | Exit longs — thrust exhausted | Short trigger at range resistance |
| Crosses below −100 | Short — unusual weakness emerging | Stand aside; wait for extension |
| −100 rising back above | Cover shorts | Long trigger at range support |
The Lambert playbook: trade the breakout
Lambert's original system treats ±100 as entry lines, not fade lines: a cross above +100 signals an emerging move strong enough to be statistically unusual — you buy strength, and exit when CCI drops back inside the bands. In crypto this maps naturally onto breakout trading, where the +100 cross confirms that a range break has real thrust behind it rather than being a low-momentum drift through a level. Pairing the cross with a volume check or a ROC zero-line confirmation filters the deadest fakeouts.
The reversion playbook: fade the extension
The opposite trade works at genuine extremes in ranging conditions. Because CCI is unbounded, it distinguishes stretched from very stretched — readings beyond ±200 are rare and mark true dislocations, the panic wicks and short squeezes crypto specializes in. Range traders wait for those extended prints at a meaningful level, then trigger on CCI hooking back toward the bands. Fading a mere ±100 in a trending market, by contrast, is the classic way to get run over.
Zero-line bias and divergence
Between the bands, the zero line carries trend information: CCI persistently positive means typical price is holding above its average — a drifting long bias. And like RSI or Williams %R, CCI prints tradable divergences: price making a new high while CCI prints a lower high at a weaker extreme is thinning momentum, most meaningful when the first peak was beyond +200.
Frequently Asked Questions
What do CCI values actually mean?
They are normalized distances from the mean: 0 means typical price sits exactly at its 20-period average, +100 means unusually far above it (relative to recent volatility), and beyond ±200 is a genuine statistical dislocation. Roughly 70–80% of all readings fall inside ±100 by design.
Is CCI better than RSI?
Different geometry. RSI is bounded 0–100 and saturates at extremes; CCI is unbounded and keeps differentiating — it can tell a strong move from a parabolic one. RSI tends to be the cleaner divergence tool, CCI the better dislocation detector. Many traders run RSI for regime and CCI for extension.
What are the best CCI settings for crypto?
The default 20 is the reference configuration. Shorter (14) makes ±100 crosses frequent enough for intraday momentum entries; longer (30–50) reserves the bands for bigger swings. If you fade extremes, consider acting only beyond ±200 on crypto — the ±100 bands are crossed far too routinely in volatile markets to fade on their own.
Does CCI repaint?
No. Each value is computed from completed bars' highs, lows, and closes. The live bar updates until close, and historical values never change.
Put it on a chart
CCI is one click away on every Crodl terminal chart — add it from the indicator picker, set your ±100 alerts, and trade the breakouts or the dislocations with live execution on six exchanges.
This article is for educational purposes only and is not financial advice. Leveraged trading carries substantial risk of loss. Always do your own research and never risk more than you can afford to lose.

Ready to automate your trading?
Connect your exchange, set up automations, and start trading smarter — all from one platform.
Start Trading Free