
ROC
Rate of Change turns momentum into a simple percentage: how far price moved over the last 12 bars. Crodl's zero-baseline ROC preset and how crypto traders read it.
Strip every momentum oscillator down to its engine and you find the same part: a comparison between price now and price then. Rate of Change (ROC) is that part, with nothing bolted on — the percentage change between the current close and the close a fixed number of bars ago. No smoothing, no normalization, no bounded scale. If BTC closed 4.2% higher than it closed 12 bars ago, ROC reads 4.2.
That bluntness is precisely its value. Because ROC is a raw percentage, it means the same thing on every chart: ROC of 8 on SOL and ROC of 8 on a $0.004 meme coin describe identical momentum, something no price-scaled indicator can offer. And because it has a natural zero line — price up versus price down over the window — it doubles as the simplest regime filter in technical analysis.
This guide covers what ROC measures and why its unbounded scale matters, the exact defaults behind Crodl's preset, and the ways crypto traders use it for regime, thrust confirmation, and cross-coin comparison.
What ROC measures
One formula:
ROC = 100 × (close − close N bars ago) ÷ close N bars ago
It is the N-bar percentage return, plotted continuously. Three properties follow:
- The zero line is a real boundary. ROC above zero means price is higher than it was N bars ago — the window's net momentum is up. Crossing zero is not a stylized signal; it is the literal moment the lookback return flips sign.
- It is unbounded. Like CCI, ROC has no ceiling. A 40% twelve-bar pump prints 40 — it can always distinguish a strong move from a parabolic one, where bounded oscillators like RSI saturate and flatline at their extremes.
- It is comparable across assets and time. Percentages are the universal unit. You can line up ROC panes on a multi-chart layout and read relative momentum across coins directly.
The trade-off for zero smoothing: ROC inherits every wick. It is also worth knowing that ROC "drops" old bars — a huge candle N bars ago falling out of the window moves today's ROC even if today's price does nothing. That is a property of every fixed-lookback momentum tool, but ROC shows it undisguised.
How it works on the Crodl terminal
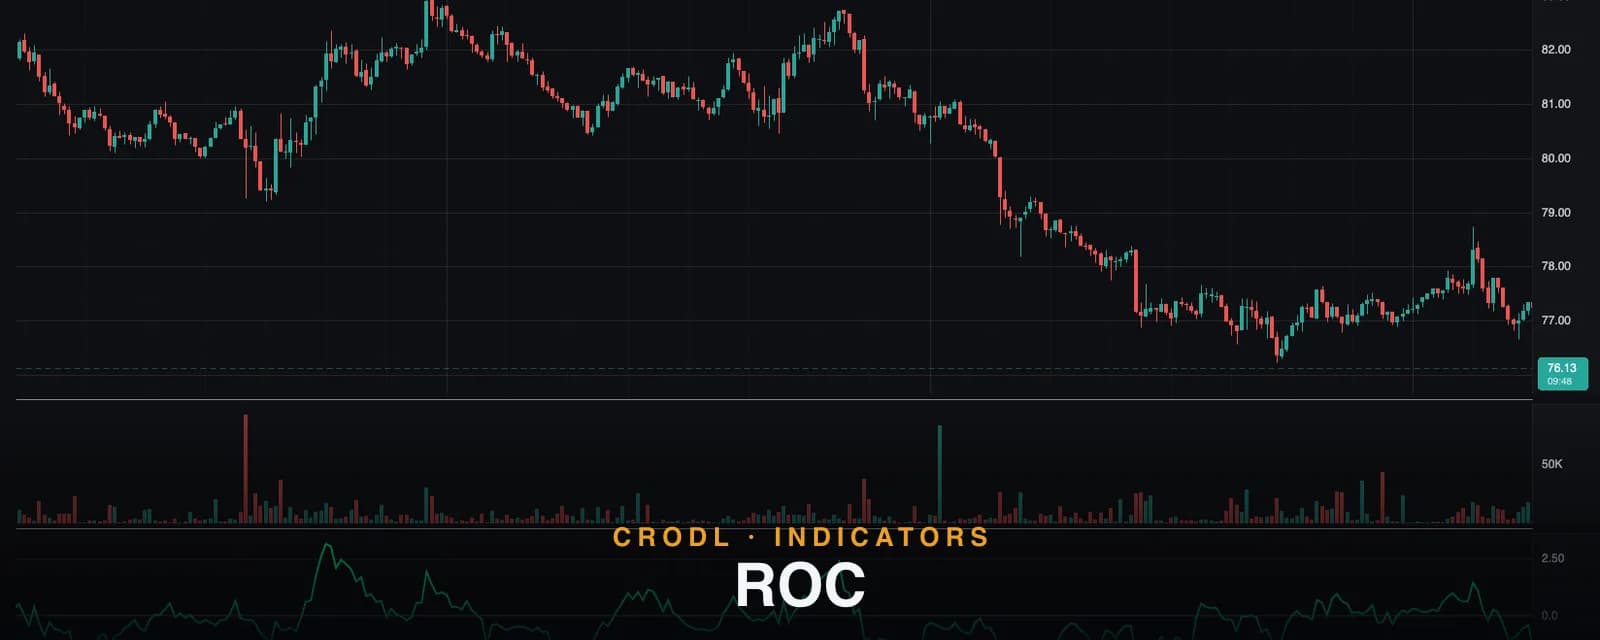
Crodl's ROC is a Rune preset that opens in its own oscillator pane with an intentionally small surface:
- Length: 12 — the lookback (adjustable 1–200). Twelve is the classic default: roughly half a day of hourly candles or twelve sessions on a daily chart.
- Zero baseline — a dashed guide at 0, the only level ROC needs.
- Dual rendering — ROC draws twice from one series: a bold green line with its live value tracked on the price axis, plus a translucent histogram filling from the zero baseline. The histogram makes regime legible at a glance — blocks above zero, blocks below — while the line gives you precise turns and divergence geometry.
Two alert conditions are built in and mirror the indicator's core event: cross_above_zero and cross_below_zero. Route either into your notifications and you have an automatic regime-flip ping for any pair you track.
How traders use it in crypto
Zero line as a regime filter
The most durable use. ROC above zero: the lookback return is positive, longs are trading with the window's momentum. Below: against it. Traders use this as a permission layer — a 4h ROC above zero gates long setups from faster tools like the Stochastic, cutting out counter-trend entries mechanically. Whipsaw around zero in chop is the known cost; a longer length or a higher timeframe is the standard remedy.
Thrust confirmation on breakouts
A level break with ROC surging to multi-week highs has real displacement behind it; a break where ROC barely lifts off zero is drift — the kind that fills back. Because ROC is unbounded, "multi-week high in ROC" is a meaningful, checkable event, and it pairs naturally with a CCI +100 cross for confirmation.
Divergence at extremes
Price makes a marginal new high; ROC peaks lower than the prior push. Each leg is gaining less ground per bar — thrust decaying even as price ticks higher. ROC divergences are blunt but honest, since nothing is smoothed away, and they carry the most weight after an extended reading (a spike well outside the recent envelope) rather than in mid-range noise.
Cross-coin momentum ranking
The percentage scale makes ROC a relative-strength tool: identical settings across a layout of majors gives you an at-a-glance answer to "what is actually leading this move?" Rotating toward the coins with the strongest positive ROC — momentum rotation — is a strategy family of its own.
Reference table for the zero-baseline reads:
| ROC behavior | What it means | Typical action |
|---|---|---|
| Crosses above zero | Lookback return turns positive | Long bias enabled / short bias off |
| Rising well above zero | Accelerating upside thrust | Breakout confirmation, hold runners |
| Falling but above zero | Momentum decaying, trend intact | Tighten stops, no new adds |
| Crosses below zero | Lookback return turns negative | Short bias enabled / long bias off |
Frequently Asked Questions
What is the difference between ROC and Momentum?
The classic Momentum indicator is the raw price difference (close minus close N bars ago); ROC divides by the old close and multiplies by 100, turning it into a percentage. The shapes are near-identical on one chart — but ROC's percentage scale stays meaningful across assets and across time, which is why it is the more useful form for crypto's wildly different price magnitudes.
What are the best ROC settings for crypto?
The default 12 suits intraday-to-swing use. Shorter (9) tightens it into a faster trigger with more zero-line whipsaw; longer (25–50) turns it into a smoother regime gauge for position trading. Whatever you pick, keep it identical across coins if you use ROC for relative-strength comparison — that consistency is the entire point.
Is ROC a leading or lagging indicator?
Both, honestly. The value itself is a lagging computation over the window, but ROC's divergences and deceleration often lead price turns, because thrust typically decays before direction flips. Treat zero crosses as confirmation events and divergences as early warnings.
Does ROC repaint?
No. Each value compares two completed closes. The live bar's reading updates until that bar closes; historical values never change.
Put it on a chart
ROC is one click away on every Crodl terminal chart — add it from the indicator picker, wire the zero-cross alerts, and read regime and thrust at a glance, alongside live trading on six exchanges.
This article is for educational purposes only and is not financial advice. Leveraged trading carries substantial risk of loss. Always do your own research and never risk more than you can afford to lose.

Ready to automate your trading?
Connect your exchange, set up automations, and start trading smarter — all from one platform.
Start Trading Free