
Bollinger Bands
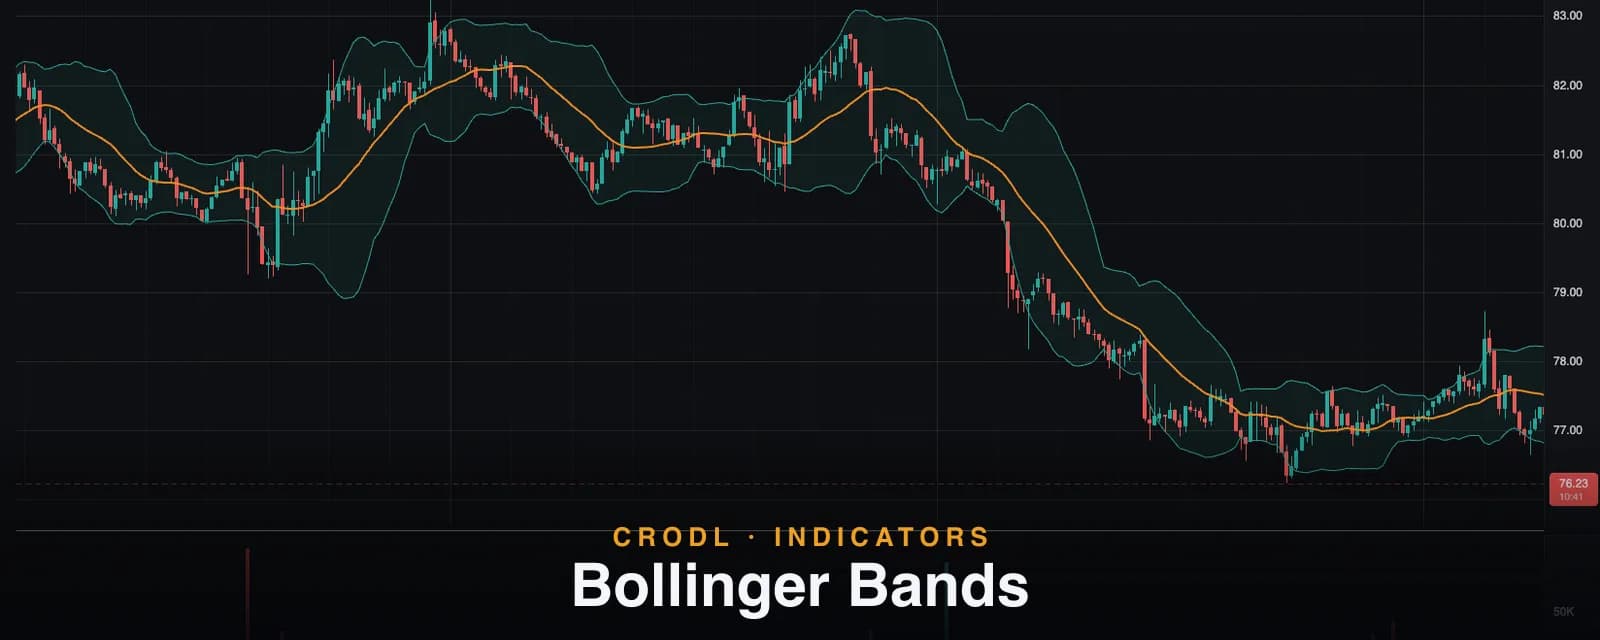
Bollinger Bands wrap a 20-period SMA in bands two standard deviations wide, breathing with volatility. How the Crodl preset works and how traders actually read it.
Some indicators survive every market cycle because they encode a truth about how markets move rather than a pattern that eventually stops working. Bollinger Bands are the canonical example: price oscillates around an average, and the size of those oscillations — volatility — clusters, compresses, and expands in waves. John Bollinger drew that as a moving average with bands a set number of standard deviations away, and half a century of quant research since has not made the picture less useful.
Crypto is arguably the best market the bands have ever met. Volatility regimes here are extreme in both directions — weeks of dead drift punctuated by 20% days — and a tool whose entire job is to show where price sits relative to its recent statistical range earns its keep daily.
The Bollinger Bands preset on the Crodl terminal is the classic study, implemented as an open CRODL Rune script you can inspect and modify. This post covers what the bands measure, exactly how the preset computes them, and the readings professional traders actually take from them.
What Bollinger Bands show
Three lines: a basis (the moving average) and an upper and lower band offset from it by a multiple of the standard deviation of price. Because standard deviation grows when candles get large and shrinks when they get small, the bands act as a self-adjusting envelope — roughly speaking, the zone where "normal" price action should live.
The two readings that follow are the entire foundation of band trading:
- Position — where price sits inside the envelope. Hugging the upper band is strength; oscillating around the basis is equilibrium; a spike outside a band is a statistically stretched move.
- Width — how far apart the bands are. Narrow bands mean compressed volatility, and compressed volatility precedes expansion. The squeeze is the most famous band signal precisely because it predicts that something will happen without pretending to know which way.
How Bollinger Bands work on the Crodl terminal
The preset is a Rune script — Crodl's indicator language — so beyond the settings dialog you can open the source in the Rune editor, read every line of the computation, and fork your own variant.
The math is faithful to the original. Each bar, the script takes your chosen Source (Open, High, Low, or Close — default Close), computes a simple moving average over Length (default 20) as the basis, then measures the standard deviation of the same source over the same window and multiplies it by StdDev Mult (default 2.0):
basis = SMA(source, 20)upper = basis + stdev(source, 20) × 2lower = basis − stdev(source, 20) × 2
Length accepts 1–500 and the multiplier 0.1–10 in 0.1 steps, so everything from a tight 1.5σ scalping envelope to a slow 50-period macro channel is a settings change away. The basis draws in Crodl orange at width 2 with its live value on the price axis, the bands in teal at width 1, and a Show Fill toggle (on by default) tints the space between the bands at a subtle 8% opacity so the envelope reads instantly without burying the candles.
How traders use Bollinger Bands
The classic mistake is treating band touches as automatic reversal signals. The bands describe volatility; the trade comes from combining position and width with context:
| Pattern | What it looks like | Typical read |
|---|---|---|
| Squeeze | Bands pinch to a multi-week narrow | Volatility expansion imminent; direction unknown |
| Band walk | Repeated closes riding the upper band | Strong trend — strength, not "overbought" |
| Tag and reject | Wick beyond a band, close back inside | Mean-reversion candidate in ranging conditions |
| W-bottom / M-top | Second low holds inside the lower band | Reversal structure with a defined invalidation |
The squeeze
When band width compresses to its tightest level in weeks, the market is coiling. Traders mark the squeeze, wait for the breakout candle, and trade the expansion — often confirming with the Squeeze Momentum indicator, which formalizes exactly this setup by checking when the Bollinger Bands slip inside the Keltner Channels.
Band walks in trends
In a real trend, price walks the band: close after close riding the upper band while the basis slopes up beneath it. Shorting that because it "looks overbought" is the most expensive misreading of this tool. The trend read is the opposite — stay long while the walk continues, and treat a close back below the basis as the first genuine warning.
Tag-and-reject in ranges
When the basis is flat and price is rotating, a stretch beyond a band that immediately closes back inside is a reversion setup toward the basis. The same print during a band walk means nothing — context decides, which is why band traders always check the basis slope first.
Frequently Asked Questions
Do the bands contain 95% of price action?
That figure comes from normal-distribution theory, and market returns are not normal — fat tails are the rule, especially in crypto. In practice 2σ bands contain most price action, but breaches are more common than the textbook says. Treat them as a stretch gauge, not a probability guarantee.
What settings work best for crypto?
The 20/2 defaults remain the standard and are the right starting point. Some crypto traders widen to 2.5σ on low-cap alts where fat tails are fattest, or shorten the length toward 10 for scalping. Change one parameter at a time and judge on replayed history, not memory.
Bollinger Bands or Keltner Channels?
Standard deviation reacts sharply to single large candles, so Bollinger Bands flare on shocks and pinch hard in quiet tape — ideal for squeeze detection. Keltner Channels use ATR and stay smoother, which suits trend-pullback trading. Many traders run both; the interplay is the squeeze signal. If you want the underlying dispersion math as its own plot, see the Standard Deviation indicator.
Can I change the calculation itself?
Yes — this preset is an editable Rune script on Crodl. Open it in the Rune editor and you can swap the SMA basis for an EMA, add a second band pair at 1σ, or change the fill logic entirely. The preset is a starting point, not a black box.
Put the envelope on your chart
Bollinger Bands ship with every Crodl terminal chart — add the preset from the indicator picker, set your length and multiplier, and you have the market's own volatility envelope drawn live on six exchanges' worth of pairs.
This article is for educational purposes only and is not financial advice. Leveraged trading carries substantial risk of loss. Always do your own research and never risk more than you can afford to lose.

Ready to automate your trading?
Connect your exchange, set up automations, and start trading smarter — all from one platform.
Start Trading Free