
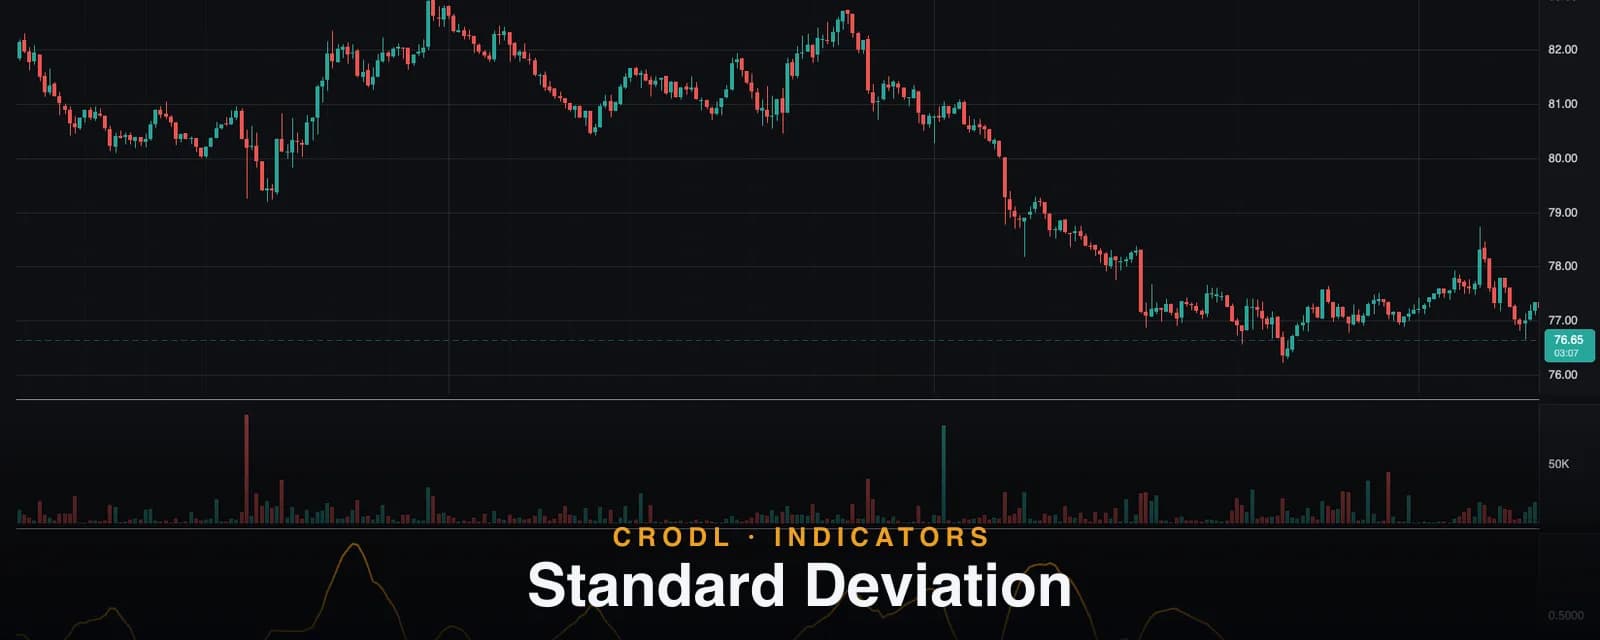
Standard Deviation
Standard Deviation is the purest volatility gauge: a rolling stdev of closing prices. Crodl's 20-period preset and how traders use quiet readings to front-run expansion.
Some indicators are elaborate machines. Standard Deviation is a single moving part borrowed straight from statistics: how widely have closing prices been scattered around their own average lately? Tight cluster, low reading. Wild dispersion, high reading. That is the entire indicator — and that minimalism is why it sits inside half the volatility tools you already use.
If you have ever traded a Bollinger Bands squeeze, you were trading standard deviation with a moving average drawn through it — the bands are literally the basis plus and minus two of these values. Plotting the raw statistic in its own pane strips away the wrapper and shows you the volatility cycle directly: the long quiet floors where dispersion dries up, and the vertical spikes when a range finally resolves.
For crypto specifically, that cycle is the market's heartbeat. Volatility clusters — quiet begets quiet until it violently doesn't — and the traders who track dispersion directly are the ones positioned before the expansion instead of chasing it.
What Standard Deviation measures
The rolling sample dispersion of closes:
- Take the closing prices over the lookback window.
- Compute their mean.
- Standard deviation = the square root of the average squared distance of each close from that mean.
The output is in price units: a reading of 320 on ETH means closes over the window have typically strayed a few hundred dollars from their average. Squaring the distances before averaging gives outliers extra weight, which makes stdev a fast responder to dislocations — one violent close moves it more than the same distance spread across several bars would.
Two properties frame how to read it:
- It is direction-blind. A trending market and a whipsawing one can print the same dispersion. Standard Deviation tells you how much movement, never which way.
- It only sees closes. Wicks, gaps between bars, and intrabar chaos are invisible to it. That is not a flaw so much as a lens — and it is the precise difference between this indicator and ATR, covered below.
How it works on the Crodl terminal
Crodl's Standard Deviation is a Rune preset that opens in its own oscillator pane, and it is intentionally the most minimal oscillator in the library:
- Length: 20 — the rolling window over closing prices (adjustable 1–200). Twenty matches the classic Bollinger basis length, so the reading corresponds directly to the band width you would see from default Bollinger Bands on the same chart.
- One orange line — the rolling stdev of close, drawn bold with its live value tracked on the price axis and shown in the pane legend.
No bands, no signal line, no alert conditions — by design. Unlike bounded oscillators, raw dispersion has no universal levels: what counts as "high" is entirely relative to the market and timeframe in front of you. The preset gives you the clean statistic and leaves the thresholds to context, which is genuinely how the tool is meant to be used. If you want dispersion pre-packaged with levels, that is what Bollinger Bands and ATR Bands are for — this preset is the raw ingredient.
Reading it is pattern recognition against its own history: multi-week floors mark compression regimes, steep rises mark active expansion, and spikes into territory the line has not visited in months mark dislocation.
How traders use it in crypto
Front-running expansion from the quiet floor
The highest-value read. Volatility clustering means extended low-dispersion periods resolve into expansion — and the stdev line makes those periods unmistakable: it flattens into a floor at multi-week lows. Traders treat that floor as a get ready condition: tighten watchlists, prepare breakout levels, size the plan. The line itself will not tell you the direction; structure and order flow do. What it tells you is that the spring is loaded.
Regime-filtering your other tools
Mean-reversion oscillators like the Stochastic perform best in quiet, rangebound dispersion regimes and get steamrolled in expansions; breakout systems are the reverse. A glance at the stdev pane — is the line near its floor, climbing, or spiking? — is a one-second regime check that decides which playbook is even allowed to run today.
Sanity-checking stop width and size
Because the reading is in price units, it converts directly into risk arithmetic: a stop tighter than roughly one standard deviation of close sits inside ordinary dispersion — noise will find it. During expansion phases, the same logic forces position sizes down if the dollar risk is to stay constant. ATR is the more common sizing input, but stdev gives an independent second opinion from close-to-close data.
Spotting climax and cooling
Dispersion spikes into uncharted territory accompany capitulations and blow-off tops — forced flows, not orderly trend. And after the spike, the stdev line rolling over is the statistical signature of a market cooling into digestion, often the earliest tell that a fade-the-extremes regime is returning.
Standard Deviation vs ATR
The two volatility gauges answer subtly different questions, and the differences decide which to reach for:
| Standard Deviation | ATR | |
|---|---|---|
| Input | Closing prices only | Full bar range plus gaps from prior close |
| Measures | Dispersion of closes around their mean | Average per-bar travel |
| Outlier response | Fast — squared distances amplify shocks | Damped — Wilder's RMA smooths shocks |
| Blind spot | Wicks and intrabar violence | Slow to register regime shifts |
| Natural role | Squeeze detection, statistical context | Stop distance, position sizing |
A market printing huge wicks around a flat close looks calm to stdev and violent to ATR; a market whose closes drift far from the mean on small candles shows the reverse. Running both panes costs nothing and covers each one's blind spot.
Frequently Asked Questions
What is a "high" Standard Deviation reading?
There is no universal number — the value is in price units and scales with the asset, its price level, and your timeframe. It is read relative to its own recent history: against the floors and spikes visible in the pane. Months-low readings signal compression; readings above anything in recent memory signal dislocation.
Why 20 periods?
Twenty is the statistical convention popularized by Bollinger Bands, which use a 20-period basis with bands at two standard deviations. Keeping Crodl's default at 20 means the pane reading maps one-to-one onto default Bollinger width on the same chart. Shorter windows react faster with noisier floors; longer windows suit position-trading regime analysis.
Should I use Standard Deviation or ATR?
Both, ideally — they disagree in informative ways. Use ATR for the operational decisions (stop distance, sizing) since it sees wicks and gaps; use Standard Deviation for squeeze detection and statistical context on closes. When both hit multi-week lows together, the compression signal is at its strongest.
Does Standard Deviation repaint?
No. Each value is computed from the completed closes in its window. The live bar's reading updates until that bar closes, and historical values never change.
Put it on a chart
Standard Deviation is one click away on every Crodl terminal chart — add it from the indicator picker, watch for the quiet floors, and be positioned before the expansion instead of after it, alongside live trading on six exchanges.
This article is for educational purposes only and is not financial advice. Leveraged trading carries substantial risk of loss. Always do your own research and never risk more than you can afford to lose.

Ready to automate your trading?
Connect your exchange, set up automations, and start trading smarter — all from one platform.
Start Trading Free