
ATR Bands
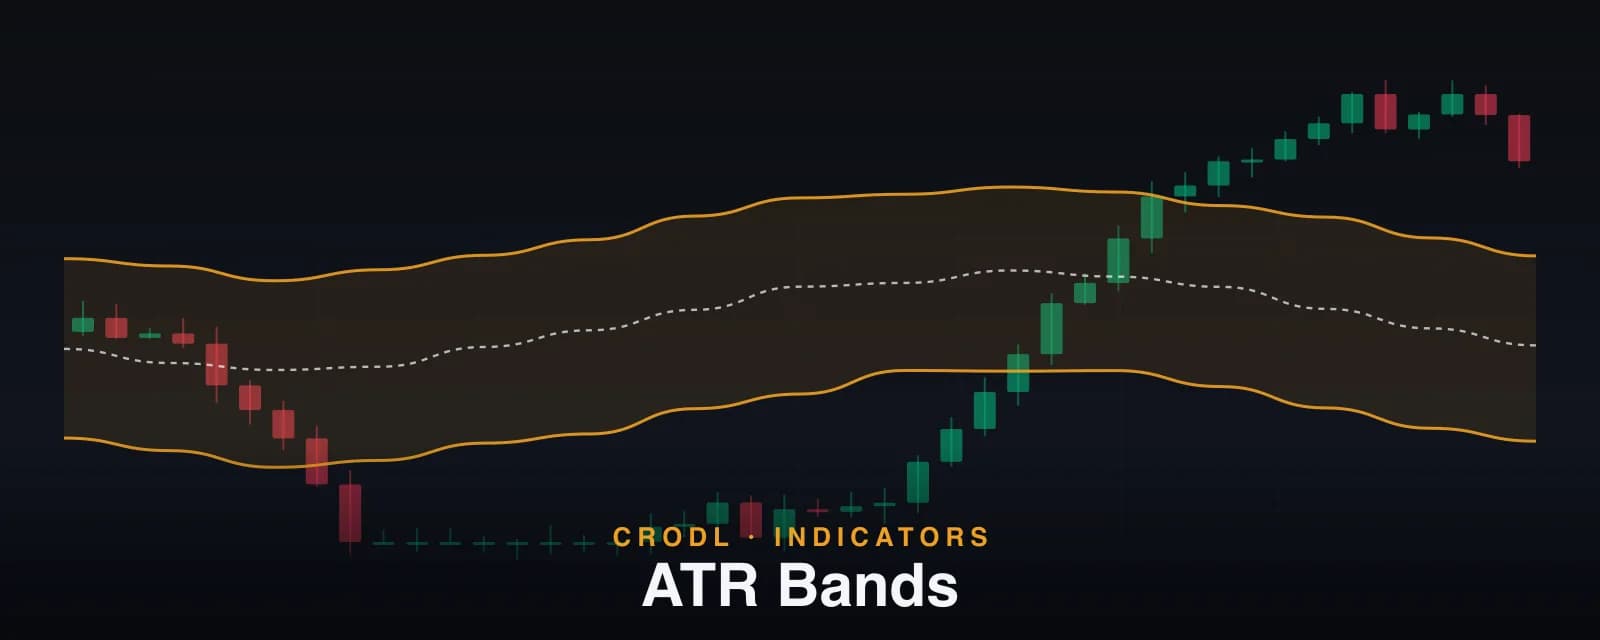
ATR Bands wrap a double-smoothed EMA in Wilder ATR envelopes, with half, quarter, and phi tiers inside the 2.618 outer bands. How it works and how traders use it.
Volatility in crypto is a moving target. The 2% move that means nothing during a hot trending week is a monster candle in quiet conditions, and any tool that draws fixed-width envelopes around price ends up mistuned in one regime or the other. That is why volatility-adaptive bands earn a permanent place on so many charts: the envelope breathes with the market instead of arguing with it.
ATR Bands on the Crodl terminal take that idea further than the usual single pair of lines. The study wraps a double-smoothed EMA basis in envelopes measured in Average True Range — an outer band at 2.618 ATR by default, plus optional half, quarter, and phi tiers nested inside it — and colors its baseline by trend so you can read stretch and direction in a single glance.
This post covers what the bands measure, exactly how the Crodl implementation computes them, and the practical ways traders put the tiers to work.
What ATR Bands show
ATR Bands answer one question continuously: how far has price traveled from its own average, measured in units of its own recent volatility? The basis line is the average; the Average True Range is the yardstick. A close at the outer band means price sits 2.618 ATRs from basis — a genuinely rare stretch — while a close drifting between the quarter and half bands is ordinary rotation that deserves no reaction at all.
Because the yardstick is ATR rather than a fixed percentage or a standard deviation of closes, the bands account for gaps and wicks (true range includes them) and widen or tighten as realized volatility changes. The same chart template stays honest on a slow-grinding majors pair and a violent low-cap alt.
How ATR Bands work on the Crodl terminal
ATR Bands ships as a built-in study — add it from the indicator picker and every input below lives in the settings dialog's Inputs card, with line and fill styling on the Style tab.
The basis line
The basis starts as an EMA of closes (EMA length, default 21) and is then smoothed a second time with a fixed 3-period EMA. That double smoothing is deliberate: it removes the last of the single-EMA jitter so band touches reflect price stretching away from the average, not the average twitching toward price.
The baseline is also trend-aware. Behind the scenes the study runs a fast/mid/slow EMA stack (4, 14, and 21 periods) on closes: when the stack is fully bullish (4 above 14 above 21) the basis paints green, fully bearish paints red, and anything mixed paints neutral grey. You get a regime read without adding a second indicator.
The band stack
ATR is computed as Wilder's smoothing (RMA) of true range over ATR length (default 21). Each band pair sits at a fraction of the headline Multiplier (default 2.618), and every band line is additionally smoothed with a short SMA (Band smoothing, default 3) so the envelope stays clean:
| Band | Distance from basis | Default | Typical read |
|---|---|---|---|
| Quarter bands | 0.25 × multiplier (≈0.65 ATR) | Off | Ordinary drift — noise, not signal |
| Half bands | 0.5 × multiplier (≈1.31 ATR) | On | First real stretch; trend pullback zone |
| Phi bands | 0.618 × multiplier (≈1.618 ATR) | Off | Golden-ratio tier between half and outer |
| Outer bands | 1 × multiplier (2.618 ATR) | On | Statistical extreme — exhaustion territory |
The defaults lean on the golden ratio twice: the outer multiplier of 2.618 is phi squared, and the phi tier at 0.618 of that lands almost exactly on 1.618 ATR. A translucent fill between the outer bands (on by default) keeps the full envelope visible without cluttering the chart.
Settings that matter
- EMA length (default 21, 1–500) — how slow the basis is.
- ATR length (default 21, 1–500) — the volatility lookback.
- Multiplier (default 2.618, 0.1–20) — outer band width; every inner tier scales off it.
- Band smoothing (default 3, 1–100) — SMA applied to each band line.
- Toggles — baseline, half bands, quarter bands, phi bands, and fill can each be switched independently.
How traders use ATR Bands
Fading the outer band
The outer band is the mean-reversion tier. In ranging or gently trending conditions, a wick through 2.618 ATR that closes back inside is a classic exhaustion print — the move has outrun what current volatility supports. Traders fade it back toward the phi or half band rather than all the way to basis, taking the high-probability portion of the reversion.
Riding trends with the baseline and half bands
In a trend, the colored baseline is the filter and the half bands are the map. While the baseline is green, pullbacks into the lower half band are continuation entries, not reversal signals — the same logic Keltner Channel traders apply, but with an explicit trend color built in. Price walking along the upper half band is strength; only the outer band flags true overextension.
Volatility-aware stops
Because the bands are denominated in ATR, they double as a stop-placement ruler. A stop half a multiplier beyond your entry tier scales automatically with conditions — wider when the market is violent, tighter when it is quiet — which is exactly what a fixed-percentage stop fails to do. This is the same reasoning behind ATR trailing stops, expressed as a visible envelope.
Reading regime from band width
The distance between the outer bands is a live volatility gauge. Compression to multi-week narrows precedes expansion, the same premise the Squeeze Momentum indicator formalizes; watching ATR Band width tighten tells you a resolution is loading even before direction shows its hand.
Frequently Asked Questions
Why 2.618 as the default multiplier?
It is phi squared, sized so the outer band marks genuinely rare stretch rather than routine movement. With the phi tier enabled you get a Fibonacci-flavored ladder — 0.65, 1.31, 1.618, and 2.618 ATRs — but the multiplier is fully adjustable from 0.1 to 20 if you prefer a conventional 2 or 3 ATR envelope.
How are ATR Bands different from Bollinger Bands or Keltner Channels?
Bollinger Bands measure the standard deviation of closes; Keltner Channels use a single ATR multiple around an EMA. ATR Bands are the extreme-detection sibling: a wider default envelope, a double-smoothed and trend-colored basis, and a stack of inner tiers so one study covers noise, pullback, and exhaustion zones at once.
Do ATR Bands repaint?
No. Basis, ATR, and the band smoothing all use only current and past bars. The values on the forming candle update live as that candle builds — standard for any moving-average tool — but closed bars never change.
Which timeframes do they work on?
All of them, because ATR normalizes the width to each timeframe's own volatility. Scalpers often enable the quarter bands for finer intraday tiers; swing traders typically run the defaults and treat outer-band closes on the 4h or daily as significant events.
Put a volatility ruler on your chart
ATR Bands are available on every Crodl terminal chart — add the study from the indicator picker, tune the tiers to your style, and every chart you open comes with a built-in measure of stretch, trend, and exhaustion, right beside live trading on six exchanges.
This article is for educational purposes only and is not financial advice. Leveraged trading carries substantial risk of loss. Always do your own research and never risk more than you can afford to lose.

Ready to automate your trading?
Connect your exchange, set up automations, and start trading smarter — all from one platform.
Start Trading Free