
ATR
ATR measures true volatility bar by bar using Wilder's RMA smoothing. Crodl's 14-period preset, and why ATR should be setting your stop distance and position size.
Every indicator covered on this blog so far tries to tell you which way price might go. The Average True Range (ATR) refuses to play that game entirely. It answers a different question — how much does this market move per bar right now? — and that single number quietly does more for long-term survival than any directional signal, because it is the input that stop distances and position sizes should be built from.
J. Welles Wilder introduced ATR in 1978 alongside RSI and the Parabolic SAR, and his insight was that the bar's high-minus-low range lies to you whenever price gaps or whips: a candle can have a tiny body and a small range while still sitting 5% away from the previous close. So Wilder defined the true range — the greatest of the current bar's range and its distance from the prior close in either direction — and smoothed it with his own moving average, the RMA.
The result is a line that rises when the market gets violent and decays when it goes quiet. On a leveraged crypto book, that line is arguably the most consequential indicator you can run.
What ATR measures
Two definitions stacked together:
True range = the greatest of: high − low, |high − previous close|, |low − previous close|.
ATR = Wilder's RMA of true range over the length. RMA is an exponential-style smoothing with factor 1/length — deliberately slower and steadier than a standard EMA, so ATR reflects the sustained volatility regime rather than reacting fully to every single wild candle.
ATR is expressed in price units: an ATR of 850 on BTC means the market has recently been covering about $850 of true range per bar on your current timeframe. It carries no direction whatsoever — a brutal dump and a vertical squeeze both raise ATR. What it gives you is a live, self-updating answer to "what is a normal move here?" — and by extension, what stop distance is inside the noise, and what move is genuinely abnormal.
How it works on the Crodl terminal
Crodl's ATR is a Rune preset that opens in its own oscillator pane:
- Length: 14 — Wilder's classic default for the true-range RMA (adjustable 1–200).
- Show RMA Smoothing: on — a second line, an RMA of the ATR itself, with its own Smoothing Length: 14 (adjustable 1–200). You can toggle it off in settings.
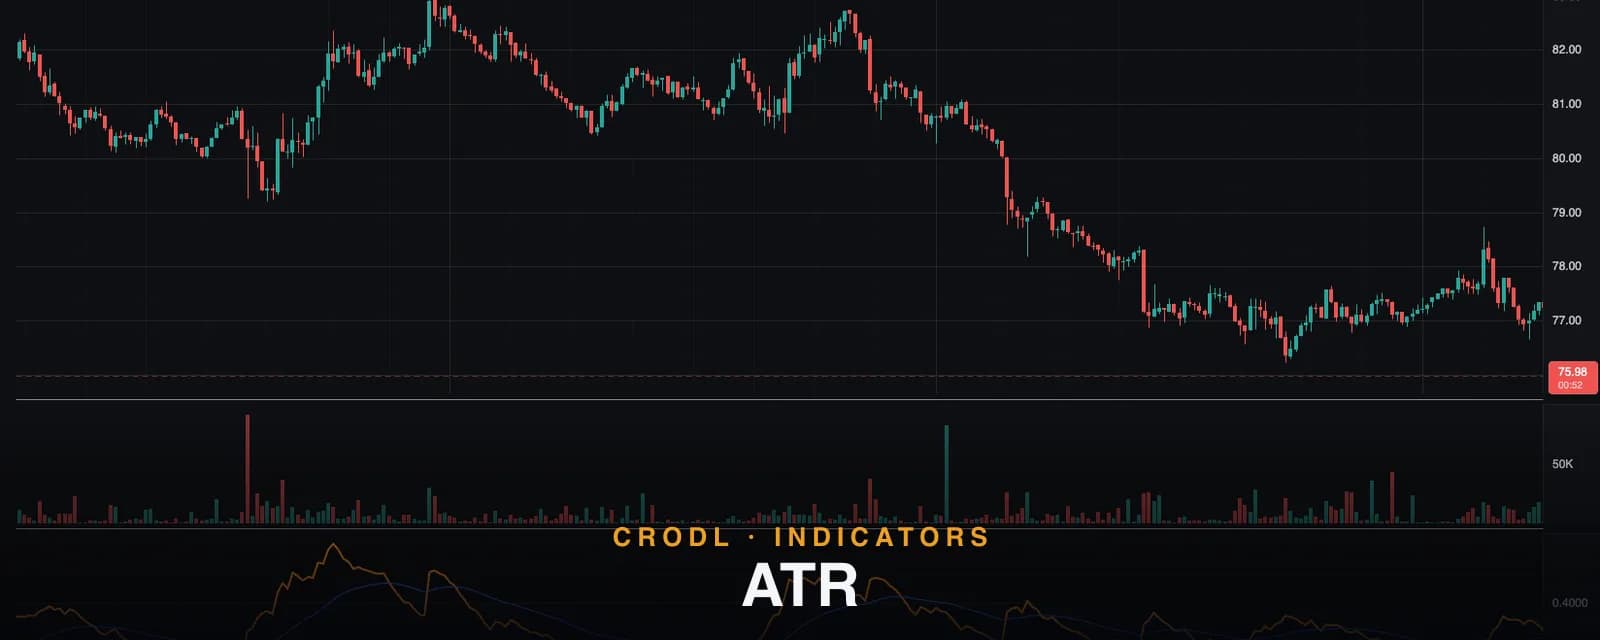
- Rendering — ATR draws as the bold orange line with its live value tracked on the price axis; the smoothing overlay is a thinner blue line.
The smoothing line deserves a note, because it turns ATR into a regime tool: when the orange ATR crosses above its blue smoothed baseline, current volatility is running above its own recent norm — expansion. Below it, contraction. That single relationship — is volatility above or below its baseline — is a cleaner expansion/contraction read than eyeballing the raw line, and it is on by default.
Because ATR reads in price units, its absolute level is only comparable to the same market and timeframe — which is exactly how it should be used: against its own history, and as an input to the risk math below.
How traders use it in crypto
Stops placed outside the noise
The foundational use. A stop closer to entry than the market's normal per-bar movement is not risk management — it is a donation to whoever runs the wicks. The standard practice is a stop at a multiple of ATR from entry (commonly 1.5×–2× for swing entries), so the stop scales automatically: tight when the market is quiet, wide when it is violent. Fixed-percentage stops cannot do this — 2% might be five ATRs on a calm major and a fifth of one ATR on a volatile alt.
Position sizing: risk first, size second
This is where ATR earns its keep. Decide the dollar risk per trade, derive the stop from ATR, and then compute size:
Position size = account risk ÷ stop distance
| Account risk per trade | ATR (4h) | Stop at 2× ATR | Position size |
|---|---|---|---|
| $100 | $600 | $1,200 | 0.083 BTC-equivalent |
| $100 | $1,500 | $3,000 | 0.033 BTC-equivalent |
| $100 | $300 | $600 | 0.167 BTC-equivalent |
Same dollar risk on every row — the size breathes with volatility instead of the risk. This is the single mechanism that keeps a volatility spike from turning one loss into a account-defining one, and it is why sizing off ATR matters more than any entry signal you will ever add.
Trailing exits and abnormal-move detection
A trailing stop held N ATRs behind the highest close since entry (the "chandelier" approach) gives a trend room to breathe in proportion to current volatility. Separately, a candle covering 3× ATR is objectively abnormal — traders use that both as a chase filter (late entry after an outsized bar is buying someone else's exit) and as a climax tell.
Squeeze watching
Multi-week ATR lows mark compression, and compression precedes expansion. Crypto's biggest directional moves routinely launch from ATR droughts. The same regime logic drives ATR Bands, which project ATR as an envelope around price, and mirrors the Bollinger Band squeeze — with the difference that ATR sees gap-and-wick volatility that close-based measures like Standard Deviation miss.
Frequently Asked Questions
What is a "good" ATR value?
There is none in absolute terms — ATR is in price units and scales with the asset and timeframe. It is only meaningful relative to its own history: versus the smoothed baseline (Crodl draws this by default), versus its recent range, or as a ratio of price. The question is never "is 900 high?" but "is ATR high for this market lately?"
Why does ATR use RMA instead of a normal moving average?
RMA is Wilder's original smoothing — an exponential average with factor 1/length, slower than a standard EMA of the same length. The intent is stability: ATR should describe the volatility regime, not flinch at every outlier candle. Using SMA or EMA instead produces visibly different values, which is why implementations that deviate from RMA disagree with reference ATR.
What ATR multiple should I use for stops?
Common practice: 1.5×–2× for swing entries, up to 3× for position trades on higher timeframes, and tighter multiples only for scalps where the entry logic is equally fast. The honest answer is that the multiple matters less than the discipline: derive size from the stop, never the reverse.
Does ATR work on all timeframes?
Yes — it simply describes per-bar true range at whatever resolution you give it. A useful habit is checking the ATR of your execution timeframe for stops and the ATR of one timeframe higher for context on whether the regime is expanding or contracting.
Put it on a chart
ATR is one click away on every Crodl terminal chart — add it from the indicator picker, watch it against its smoothed baseline, and let it size your next position instead of your gut, alongside live trading on six exchanges.
This article is for educational purposes only and is not financial advice. Leveraged trading carries substantial risk of loss. Always do your own research and never risk more than you can afford to lose.

Ready to automate your trading?
Connect your exchange, set up automations, and start trading smarter — all from one platform.
Start Trading Free