
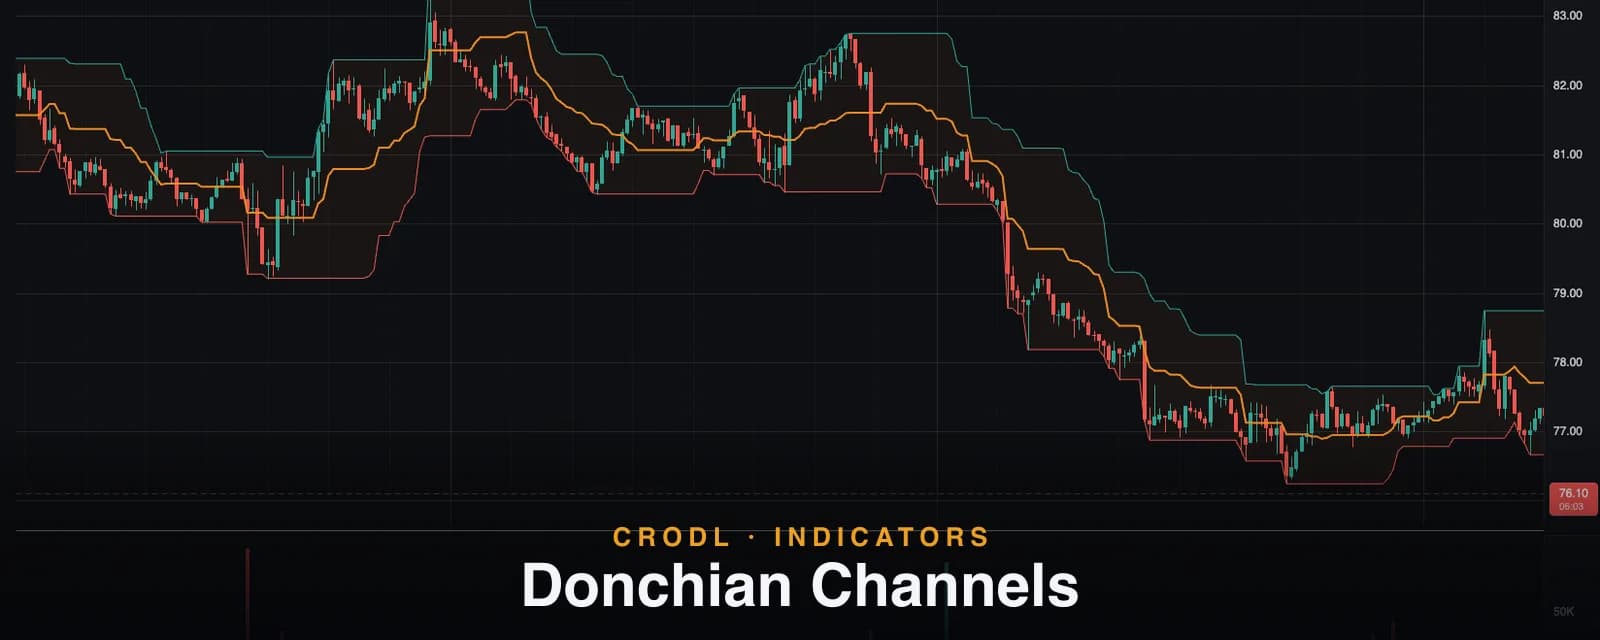
Donchian Channels
Donchian Channels track the highest high and lowest low of the last 20 bars — the classic turtle breakout channel. How the Crodl preset works and how traders use it.
Most volatility channels are built from statistics — moving averages, standard deviations, smoothed ranges. Donchian Channels are built from something blunter and, for one style of trading, better: the actual extremes. The upper band is the highest high of the last N bars, the lower band is the lowest low, and the midline splits the difference. No smoothing, no distribution assumptions — just the range the market has genuinely traded.
That bluntness is why the indicator has the most storied track record in trend following. Richard Donchian built his "four-week rule" around it in the mid-1900s, and in the 1980s the Turtle Traders — Richard Dennis's famous experiment in teachable trading — used Donchian breakouts as the entry engine of a system that turned novices into profitable traders. Buy the 20-day high, exit on the 10-day low. The rules fit on an index card.
The Donchian Channels preset on the Crodl terminal is that same channel, implemented as an open CRODL Rune script. This post covers what the channel shows, how the preset computes and draws it, and the playbooks — breakout entry, trailing exit, midline bias — that traders still run on it today.
What Donchian Channels show
The channel is a rolling window of truth: over the last N bars, this is the highest price anyone paid and the lowest price anyone accepted. Three readings fall straight out of that:
- Breakouts are unambiguous. Price touching the upper band is an N-bar high — not an approximation of one. There is no threshold to debate; the event either happened or it did not.
- The channel steps, not slides. Bands only move when a new extreme prints or an old one ages out of the window, producing the characteristic staircase. Flat band segments are consolidation made visible.
- The midline is a bias line. Halfway between the extremes, it marks the center of the recent range; which side price lives on is a simple, robust trend filter.
How Donchian Channels work on the Crodl terminal
The preset is a Rune script, so the entire computation is open — add it from the indicator picker, or open the source in the Rune editor to audit and fork it. Each bar it computes:
upper = highest(high, Length)lower = lowest(low, Length)mid = (upper + lower) / 2
Length defaults to the classic 20 and accepts 1–500. The upper band draws in teal and the lower in red at width 1 — matching the sides you'd break through in each direction — while the midline draws in Crodl orange at width 2, and all three show their live values on the price axis. A Show Fill toggle (on by default) tints the channel interior at a whisper-quiet 5% opacity so the staircase structure stays readable behind the candles. All colors are adjustable in the Style group.
Length is the entire personality of the indicator:
| Length | Style | What it captures |
|---|---|---|
| 10 | Fast swing / exits | Recent extremes; the classic turtle exit channel |
| 20 | The default | Donchian's four-week rule on the daily; the turtle entry |
| 55 | Slow trend entry | The turtles' second system — major breakouts only |
| 100+ | Position trading | Macro range boundaries |
How traders use Donchian Channels
Breakout entries
The core play is unchanged since the turtles: buy a close (or touch, for the strictest version) of the upper band, short the lower band, on the premise that new extremes attract continuation in trending markets. Crypto suits this style unusually well — its trends run long and its breakouts frequently extend — but the system's honesty cuts both ways: in chop, breakouts fail repeatedly, and the strategy only survives because winners are allowed to run far beyond the losers.
Trailing exits with a second window
The turtle system's exit was a Donchian channel too, just faster: enter on the 20-bar breakout, exit when price takes out the 10-bar low. Running two lengths — one slow for entries, one fast as the trailing stop — turns the indicator into a complete trend-following system with no other tools required. On Crodl you can simply add the preset twice with different lengths.
Midline bias and range trading
When the channel is flat, the market is ranging, and the midline becomes the mean-reversion anchor: fade the band edges back toward it. When the channel steps steadily in one direction, the same midline flips roles and becomes the pullback zone — a close through it against the trend is an early exit warning. Pairing the channel with a smoothed lane like Keltner Channels makes the regime distinction easier to see at a glance.
Sizing the breakout
The channel tells you a breakout happened; it says nothing about how far price can stretch. Trend followers commonly size stops and targets in ATR terms using ATR Bands or a plain ATR stop, so position risk scales with the volatility of the move they just joined.
Frequently Asked Questions
Why do the bands look like staircases?
Because they track extremes, not averages. The upper band only rises when price prints a new N-bar high, and only falls when the current highest bar ages out of the lookback window. The flat treads are consolidations; each riser is a new extreme.
Do Donchian Channels repaint?
No — closed-bar values are fixed history. On the forming candle the bands can extend live if price makes a new extreme intra-bar, which is standard for any high/low-based tool. A closed candle beyond the band is the conservative signal.
Donchian, Keltner, or Bollinger?
They answer different questions. Donchian marks actual extremes — the breakout tool. Keltner Channels draw a smoothed ATR lane — the trend-pullback tool. Bollinger Bands measure statistical dispersion — the volatility-regime tool. Trend followers often run Donchian for triggers with one of the others for context.
What length should I use for crypto?
Start with 20 — it remains the reference setting on every timeframe, not just the daily. If you get chopped up in ranges, lengthen toward 55 so only major breakouts trigger; if you trade fast swings, a 10-bar channel works as the exit rail exactly as the turtles used it.
Trade the breakout that actually happened
Donchian Channels are one click away on every Crodl terminal chart — add the preset from the indicator picker, pick your length, and every N-bar extreme on six exchanges' worth of pairs is marked the moment it prints.
This article is for educational purposes only and is not financial advice. Leveraged trading carries substantial risk of loss. Always do your own research and never risk more than you can afford to lose.

Ready to automate your trading?
Connect your exchange, set up automations, and start trading smarter — all from one platform.
Start Trading Free