
Shift + Daily VWAP: The Two-Line Bias Read
One trend-colored EMA, one daily-anchored VWAP, nothing else. How the Shift + Daily VWAP indicator compresses intraday bias into two lines and how to trade their agreement.
Most charts die of accumulation: a band here, a ribbon there, three oscillators below, and suddenly the candles are decoration. The fix is usually not another indicator — it is fewer, chosen so each answers a different question.
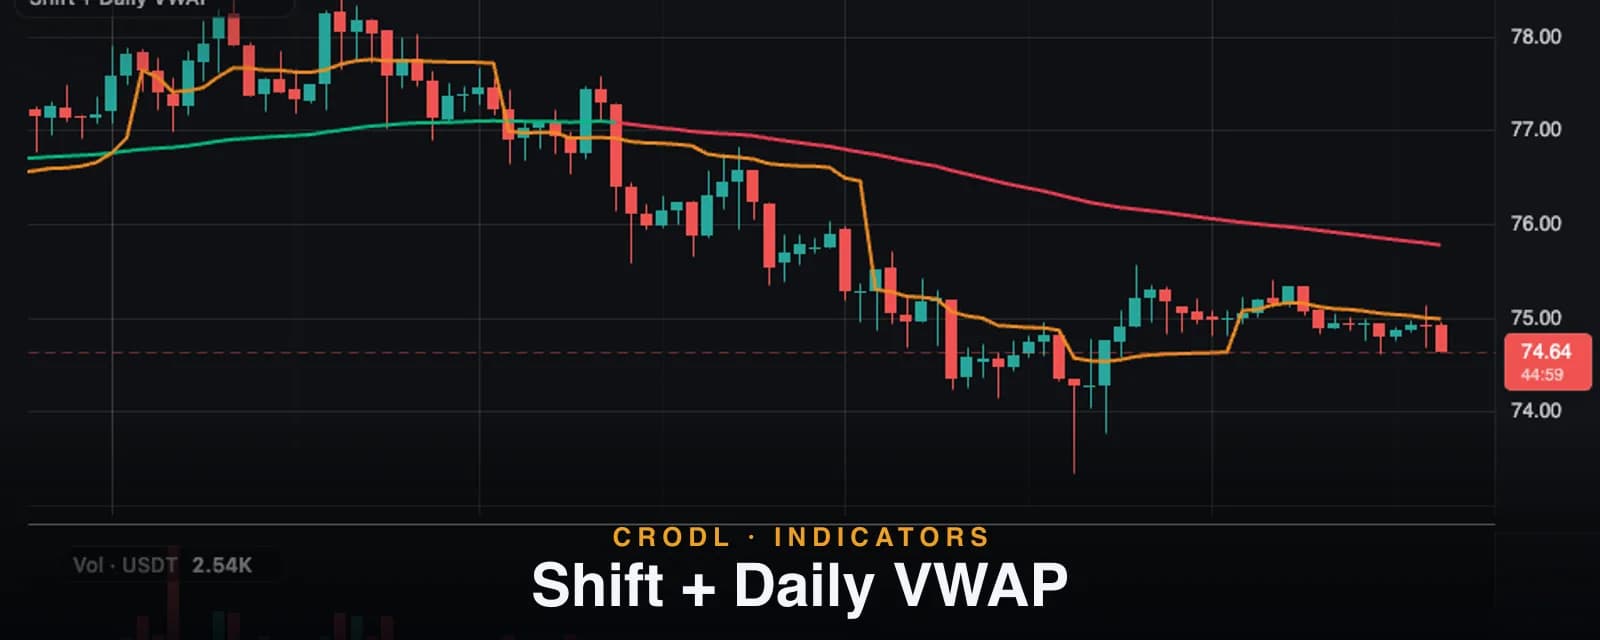
Shift + Daily VWAP on the Crodl terminal is that idea shipped as a preset: exactly two lines. The first is the trend-colored EMA from the Volume Shift indicator — green while the market's regime is bullish, red while it is bearish, with a hysteresis rule that refuses to flip on noise. The second is the Daily VWAP — the session's volume-weighted fair-value line, re-anchored on every daily candle. Regime and fair value, one glance, and the chart stays candles.
What it shows
- The Shift EMA — an EMA (default length 100) drawn in bull teal or bear rose. The color is not "price above or below the average": it is a state machine. Around the EMA sits an invisible ATR-sized deadband, and the state only flips when price closes beyond the opposite edge of that band. Inside the band, the previous state holds — which is exactly why the line does not strobe colors through chop the way a naive EMA cross does.
- The Daily VWAP — the orange line: the current UTC day's volume-weighted average price, from the daily candle open to now, resetting when the next day begins. It is the line intraday participants are benchmarked against, which is why price respects it so often.
The deadband itself, the flip markers, and the VWAP's σ-bands are all deliberately not drawn. Both parent indicators exist for when you want the full detail; this preset is the minimal cut.
Why these two lines together
Each line answers a question the other cannot.
The Shift EMA speaks on the swing horizon: with a 100-bar memory and a flip rule that demands real displacement, its color changes rarely and means something when it does. But it says nothing about today — a market can be in a red regime while today's tape is being bought all session.
The Daily VWAP speaks on the session horizon: above it, today's average participant is in profit and the intraday lean is long; below it, the reverse. But it forgets everything at midnight — it cannot tell a one-day bounce from a trend.
Read together, they form a simple grid:
| Shift EMA | Price vs Daily VWAP | Read |
|---|---|---|
| Green | Above | Aligned bullish — trend and session agree; pullbacks to VWAP are buyable dips |
| Red | Below | Aligned bearish — the mirror; rallies into VWAP are fade candidates |
| Green | Below | Conflict — a dip inside an uptrend, or the first crack in it; wait for VWAP to be reclaimed |
| Red | Above | Conflict — a bounce inside a downtrend; the burden of proof is on the buyers |
The aligned rows are where trend-following entries earn their keep. The conflict rows are the honest "not yet" — and having the chart say not yet clearly is worth more than most signals.
How traders use it
The alignment filter
The simplest protocol: only take longs when the EMA is green and price is above the daily VWAP; only shorts on the full mirror. One glance replaces a checklist, and the two-horizon agreement filters out both counter-trend session noise and dead-trend chop. Structure tools like Session Levels then handle the where.
VWAP pullbacks inside the regime
In an aligned market the highest-quality intraday entry is usually the pullback to the VWAP line itself — the trend's fair-value discount. The green EMA below acts as the deeper backstop: a pullback that holds VWAP is routine; one that loses VWAP but holds the EMA is stretched-but-alive; one that closes through both is the regime change the color flip will shortly confirm.
The flip plus reclaim
The strongest regime-change signal this pair produces is the sequence: EMA flips color, then price reclaims the daily VWAP in the new direction. The flip alone is the deadband speaking (real displacement happened); the VWAP reclaim confirms the new session is being transacted on the new side. The preset declares both flips as alerts — Bull shift and Bear shift — so the terminal can watch for the first half server-side while you are away.
Settings that matter
- EMA Length (default 100) — the regime memory. Shorter lengths flip faster and suit lower timeframes; longer ones turn the line into a pure swing filter.
- ATR Length / Trend Deadband (defaults 14 / 1.0) — the flip-resistance. A wider deadband demands a bigger displacement to change color: fewer, later, more meaningful flips. At 0 the hysteresis is off and you have a plain EMA-cross color.
- Colors — bull, bear, and the VWAP line, all editable. The VWAP anchor is pinned to the UTC day on purpose — that is the Daily VWAP design, and it matches the exchanges' own daily candles.
An honest note
Two lines cannot say everything. The Shift EMA is a lagging regime filter by construction — the deadband that saves it from whipsaw also means it flips after the turn, never at it. The Daily VWAP's early-session readings are built from a handful of bars and firm up as volume accumulates, and at each midnight the line steps to its new anchor by design. Neither line knows about news, liquidity, or the level directly overhead. The preset's claim is not completeness — it is that these are the two most decision-relevant lines per pixel of ink an intraday chart can carry.
Frequently Asked Questions
How is this different from just adding Volume Shift and Daily VWAP separately?
The ingredients are identical — same trend state machine, same VWAP. The preset is the curation: no deadband lines, no flip markers, no σ-bands, one settings card, one legend chip. Add the parents instead when you want their full detail; add this when you want the chart quiet.
Why did the EMA stay green through a pullback below it?
Because of the deadband. Price closing below the EMA — even a few times — is not a flip; only a close beyond the opposite deadband edge (EMA minus one ATR by default) changes the state. That refusal to flinch inside the band is the entire point of the hysteresis design.
Which timeframes does it suit?
The daily anchor makes the VWAP line most meaningful intraday — 5m to 4h. The Shift EMA scales anywhere, but on daily-and-up charts a daily-reset VWAP hugs price closely and adds little; there, the configurable VWAP preset with a weekly or monthly anchor pairs better.
Do the alerts fire when price crosses the VWAP?
This preset's declared alerts are the regime flips — Bull shift and Bear shift. For VWAP-cross alerts, add the Daily VWAP indicator, which declares crosses above and below the line; the two presets stack cleanly if you want both alert sets active.
Two lines, whole picture
Shift + Daily VWAP is one click away in the indicator picker on every Crodl terminal chart. Put it on a clean chart, trade one session only in the aligned rows of the grid, and you will feel how much decision-noise the other twenty lines were adding.
This article is for educational purposes only and is not financial advice. Leveraged trading carries substantial risk of loss. Always do your own research and never risk more than you can afford to lose.

Ready to automate your trading?
Connect your exchange, set up automations, and start trading smarter — all from one platform.
Start Trading Free