
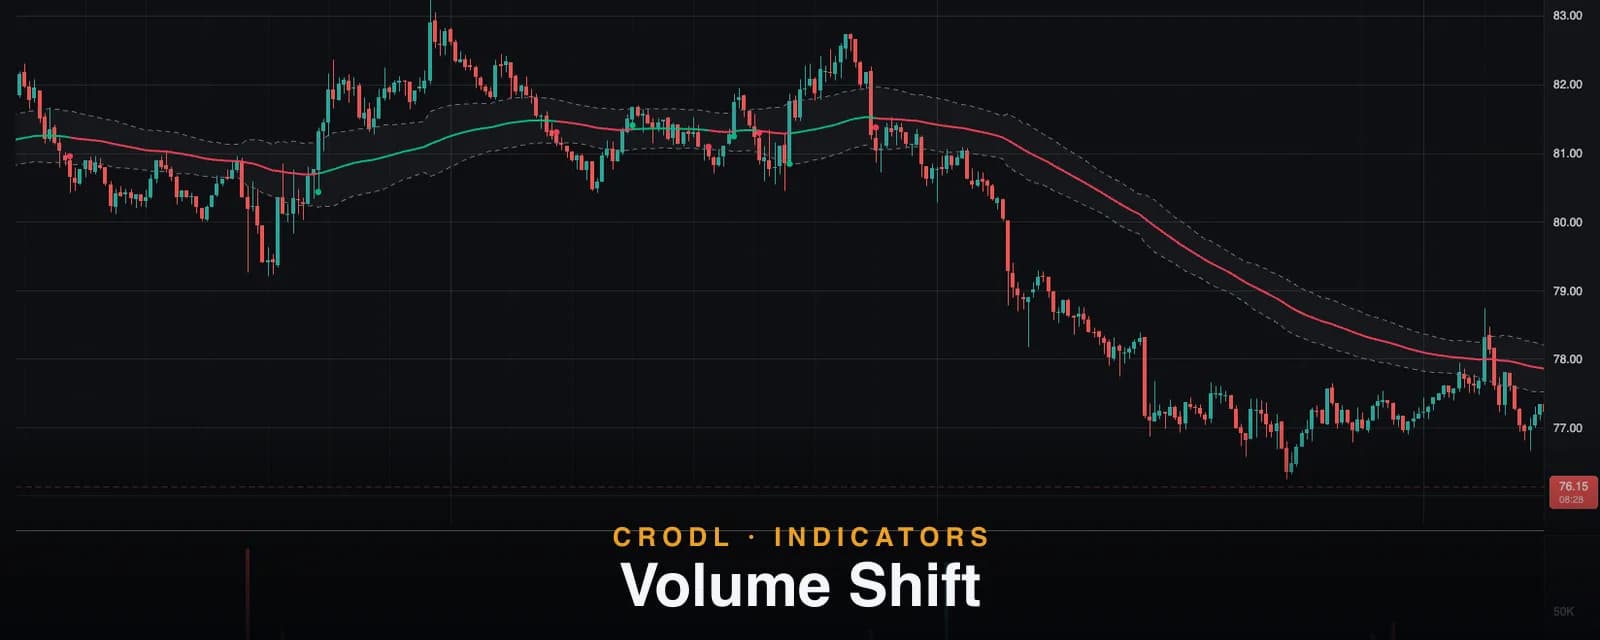
Volume Shift
How Crodl's Volume Shift indicator wraps an ATR deadband around a 100 EMA and flips trend only on a close beyond the opposite band — hysteresis that kills chop.
Every trend-following system dies the same death: chop. An EMA cross looks brilliant on a trending chart, then bleeds you dry in a range — flipping long and short every few bars while price saws back and forth across the average. The problem is rarely the moving average itself. It is the flip condition. If your trend state changes the instant price crosses a line, every wobble becomes a signal.
Volume Shift, a CRODL original on the Crodl terminal, attacks that problem with hysteresis. It wraps a deadband around a 100-period EMA — a neutral zone scaled by ATR — and refuses to change its mind until price closes beyond the opposite side of that zone. Inside the band, nothing happens. The trend you had is the trend you keep.
The indicator was built as the visual half of CRODL's volume-bar trading model, and it reads especially cleanly on volume-based chart types where every candle carries equal participation — but it works exactly the same on ordinary time candles. This post covers what it draws, the precise flip mechanics, and how traders put it to work.
What Volume Shift shows
On the chart you get one clean structure:
- A colored EMA basis — the 100-period EMA of closes, painted green while the trend state is bullish and red while it is bearish, with the live value tracked on the price axis.
- The deadband — dashed upper and lower threshold lines at EMA ± 1.0 × ATR, with a faint fill between them. This is the zone where the indicator deliberately does nothing.
- Shift markers — a triangle under the candle that flips the state bullish, and a triangle above the candle that flips it bearish.
- Alert conditions —
bull_shiftandbear_shiftfire on the flip bars, so you can be notified instead of watching.
That is the whole surface. No oscillator pane, no histogram — a single line whose color you can trust at a glance because of how expensive it is to change.
How it works on the Crodl terminal
Volume Shift ships as a Rune preset — add it from the indicator picker and the full script is yours to inspect or edit. The mechanics are three lines of math and one state machine.
First, the geometry. The basis is EMA(close, 100) (EMA Length, 2–500). Around it, the indicator computes ATR(14) (ATR Length, 1–200) and builds two thresholds:
- Upper band = EMA + 1.0 × ATR
- Lower band = EMA − 1.0 × ATR
The Trend Deadband (ATR) multiplier (default 1.0, range 0–10) controls the width. Because the band is ATR-scaled, it breathes with the market: quiet conditions pull the thresholds in tight, volatile conditions push them out. That is the same self-scaling logic covered in our ATR guide, applied as a filter instead of a stop.
Then the state machine — this is the part that makes Volume Shift different from an EMA cross:
| Current state | Bar close lands... | New state |
|---|---|---|
| Neutral (warm-up ends) | At or above the EMA | Bullish |
| Neutral (warm-up ends) | Below the EMA | Bearish |
| Bullish | Anywhere above the lower band | Still bullish |
| Bullish | Below the lower band | Flips bearish |
| Bearish | Anywhere below the upper band | Still bearish |
| Bearish | Above the upper band | Flips bullish |
Read the middle rows again, because they are the whole indicator. In a bullish state, price can cross under the EMA — it can close under the EMA — and the state holds, as long as the close stays above the lower band. Only a close a full ATR-multiple below the basis flips it. The flip threshold is always the opposite band, which means the distance between "flip bullish" and "flip bearish" is two full deadbands: 2 × multiplier × ATR of price movement, on a closing basis, before the indicator changes its opinion twice.
That asymmetry between crossing and flipping is textbook hysteresis, and it is exactly what an EMA cross lacks. Range-bound price action lives inside the band and generates zero signals.
How traders use it
As a regime filter
The simplest and arguably best use: only take longs while the EMA is green, only shorts while it is red. Volume Shift's reluctance to flip makes it a genuinely stable filter — you are not going to get five regime changes in an afternoon of chop the way you do with a raw cross.
Timing pullbacks into the deadband
In an established uptrend, the deadband doubles as a value zone. Price pulling back from above into the band — without closing through the far side — is a pullback the indicator has explicitly classified as noise. Traders fade those dips back in the trend direction, with a stop beyond the opposite threshold, because a close past that line is by definition the end of the state.
Trading the shifts themselves
The triangles mark closes beyond the opposite band — a meaningful displacement from the average, not a graze. Some traders treat a fresh shift as a momentum entry, especially when it lines up with a structural break. If you want the flip gated by actual market structure instead of distance, that is precisely what Block Shift — Volume Shift's sibling — does with swing-high and swing-low blocks.
Automating the flips
Because bull_shift and bear_shift are declared as alert conditions in the script, the flips can drive notifications rather than screen time. Given how rarely a 1-ATR deadband flips on higher timeframes, these are alerts worth acting on when they arrive.
New: want every flip traded mechanically — entry at the flip close, stop at the previous swing low/high, target at 1:4, daily discipline stops and a win-rate scoreboard? That's Volume Shift Strategy, built on this exact state machine.
Settings that matter
- EMA Length (100) — the trend anchor. Shorter tracks swings; longer defines regime.
- ATR Length (14) — how quickly the band adapts to volatility changes.
- Trend Deadband (1.0 ATR) — the sensitivity dial. Raise it and flips become rarer and later; lower it toward 0 and the indicator degrades into a plain EMA cross.
- Show Deadband — hide the threshold lines if you only want the colored EMA.
Frequently Asked Questions
Does Volume Shift repaint?
Closed bars never change. On the live, still-forming candle the state is evaluated against the current price, so the color can flicker while the bar is open — standard for any close-based indicator. Once the candle closes, the state is final.
How is this different from a plain EMA cross?
A cross flips at the EMA itself, so every touch of the average is a potential signal. Volume Shift flips at the opposite band — price must close a full ATR-multiple past the far side of the zone. Crossing the EMA does nothing; only displacement flips the state.
Why is it called Volume Shift?
It was designed as the visual half of CRODL's volume-bar 1:1 trading model, where it is read on charts whose candles each represent equal traded volume — the "shift" is the trend shift on those bars. The overlay itself is chart-type agnostic and works identically on time candles.
What timeframes does it work on?
All of them, but the character changes. On low timeframes with the default 100 EMA it is a patient intraday regime tool; on 4h and daily it flips a handful of times per quarter and behaves like a position-trading bias. A slower, consensus-based cousin for pure regime work is the Deadband indicator.
Put a deadband between you and the chop
Volume Shift is available on every Crodl terminal chart — add it from the indicator picker and the colored basis, deadband, and shift alerts are live in one click, alongside trading on six exchanges.
This article is for educational purposes only and is not financial advice. Leveraged trading carries substantial risk of loss. Always do your own research and never risk more than you can afford to lose.

Ready to automate your trading?
Connect your exchange, set up automations, and start trading smarter — all from one platform.
Start Trading Free