
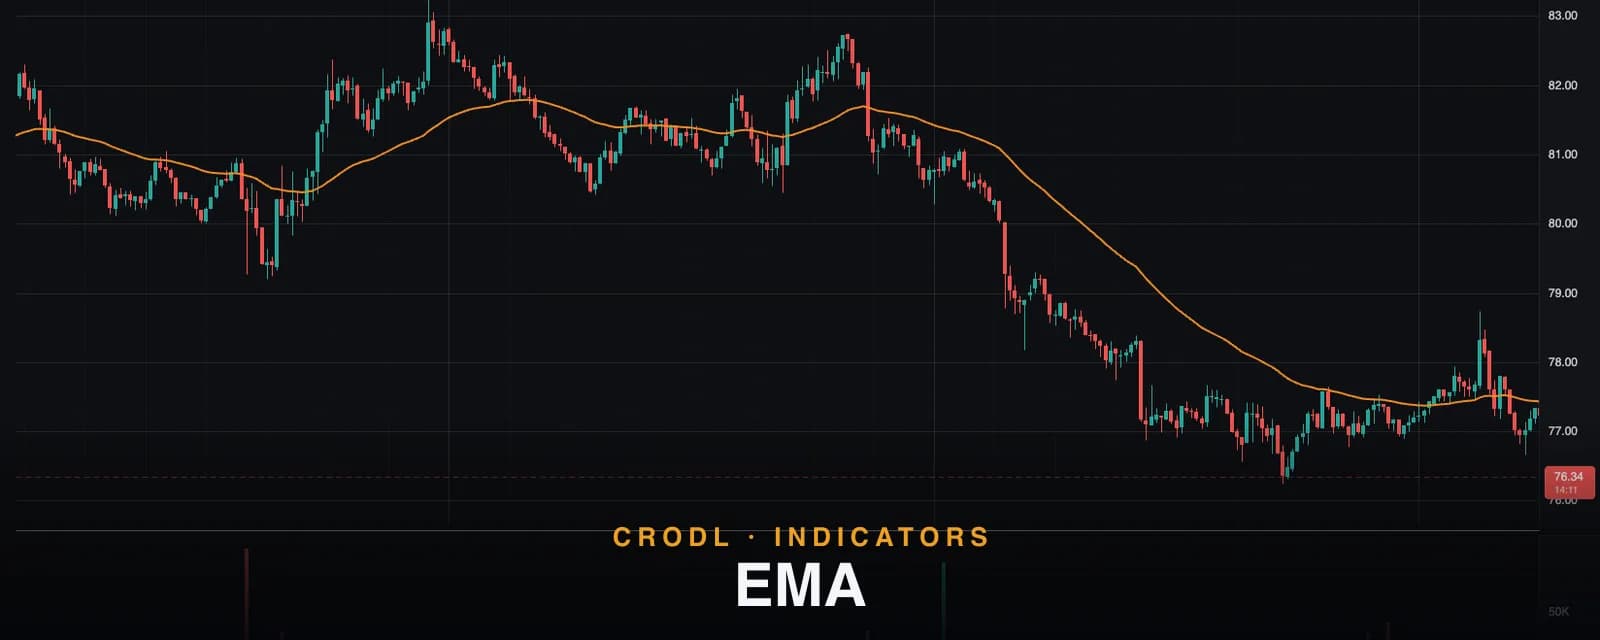
EMA
The exponential moving average is the most-watched trend line in crypto. How Crodl's EMA indicator works, its six smoothing modes, and how traders build multi-EMA stacks.
Every trend tool on your chart — ribbons, trailing stops, adaptive bands — is built on the same primitive: a moving average that follows price. The exponential moving average is the version the crypto market actually watches. It weights recent candles more heavily than old ones, so it turns when the market turns instead of three days later.
The EMA indicator on the Crodl terminal is a single, fully parameterized EMA line. That sounds minimal, and it is deliberately minimal: because every setting is exposed and you can add the indicator to the chart as many times as you like, one preset becomes a 21/50/200 stack, a crossover system, or a Bollinger-wrapped signal line — whatever your process needs.
This post covers what an EMA actually measures, exactly how the Crodl preset is configured, and the handful of ways traders get real mileage out of it.
What the EMA shows
A simple moving average treats every bar in its window equally: the candle from 50 bars ago moves the line as much as the candle that just closed. An EMA applies exponential decay instead — each bar gets a weight, and the weights shrink geometrically as you go back in time. The practical result is a line that hugs current price more closely and reacts to reversals sooner, at the cost of being slightly easier to whipsaw in chop.
That responsiveness is why the EMA, not the SMA, became the default trend reference in crypto. Markets that move 10% in a session punish slow averages.
What the line tells you is simple:
- Slope — a rising EMA means the weighted average of recent closes keeps climbing. Slope is the trend.
- Side — price above the EMA is strength, price below is weakness. The longer the length, the more meaningful the side.
- Distance — price stretched far from its EMA tends to snap back toward it. The EMA is the rubber band's anchor.
How the EMA works on the Crodl terminal
Crodl's EMA is a Rune preset — a script you can open, read, and edit in the terminal's Rune editor. Out of the box it exposes five settings:
- Length — default
50, range 1–500. The number of bars in the exponential window. - Source — default
Close, withOpen,High, andLowas alternatives. Almost everyone uses Close; High/Low variants are occasionally used to build channel-style pairs. - Smoothing Type — default
None. Options:SMA,SMA + Bollinger Bands,EMA,RMA,WMA,VWMA. This applies a second moving average to the EMA line itself, drawn as a separate signal line. - Smoothing Length — default
14, used by whichever smoothing type you pick. - BB StdDev — default
2. Only active in theSMA + Bollinger Bandsmode, where the indicator wraps the EMA in a standard-deviation envelope with a shaded fill.
The main EMA is drawn as a bold orange line that tracks price on the axis and prints its live value on the price scale, so you always know exactly where it sits without hovering. The smoothing MA renders in blue, and the optional Bollinger envelope in green with a soft fill.
The design decision that matters most: the preset is multi-instance. Add it once at length 21, again at 50, again at 200, and you have a personal EMA stack where every line has its own source, color, and smoothing — something a hardcoded "triple EMA" indicator can never give you. If you would rather have a pre-built stack, the EMA Ribbon ships eight Fibonacci-spaced EMAs in one click.
| Length | Common role |
|---|---|
| 9–13 | Momentum line for scalps; first pullback level in fast trends |
| 21 | The swing trader's trigger line |
| 50 | Medium-term trend reference; the preset's default |
| 100 | Larger-degree pullback zone |
| 200 | The macro bull/bear line watched across the entire market |
How traders use it
The trend filter
The most valuable use is also the least glamorous: only take longs while price holds above your chosen EMA, only shorts below it. A 50 EMA filter on your execution timeframe removes an enormous class of counter-trend losers. Signal-generating tools like Risk Pilot build exactly this idea in — its Buy/Sell markers are gated by a trend moving average for the same reason.
Dynamic support and resistance
In a healthy trend, pullbacks repeatedly find the same EMA — tag the 21, bounce; tag the 21, bounce. When that rhythm is established, the EMA becomes a location tool: you bid the retest instead of chasing the breakout, and your invalidation is a close through the line.
Crossovers — with two instances
Add the preset twice (say 21 and 55) and the cross of fast over slow becomes a classic trend-change signal. Crosses lag by construction — they confirm a turn rather than predict it — so they work best as regime switches, not precision entries.
The smoothing line as a built-in signal
Setting Smoothing Type to EMA or SMA gives you a signal line derived from the EMA itself: when the EMA crosses its own smoothing MA, the trend's second derivative has flipped. It is a subtler read than a price cross and fires earlier. The SMA + Bollinger Bands mode instead wraps the EMA in a volatility envelope — useful for spotting when the trend line itself is moving abnormally fast or slow.
Confluence, not ceremony
An EMA level means more when something else agrees with it. A 200 EMA retest that lands on a high-volume shelf, or a 21 EMA pullback inside a fully stacked Trend Ribbon, is a materially better trade than the line alone. Volume-based confirmation from a tool like Volume Shift is a natural pairing.
Frequently Asked Questions
EMA vs SMA — which should I use?
EMA for anything trend- or momentum-driven; its recency weighting suits crypto's speed. SMA when you specifically want a stable, slow reference that ignores single-bar noise — some traders keep the 200 as an SMA for exactly that reason. On the Crodl preset you can approximate both worlds by smoothing the EMA with an SMA.
Which length is "correct"?
None of them. Lengths are conventions, and their power comes from how many traders watch them — which is why 21, 50, and 200 behave better than 37. Pick lengths that match your holding period, then keep them constant so you learn how your market respects them.
Does the EMA repaint?
No. On closed bars the value is fixed forever. On the live bar the EMA updates tick by tick as the close changes — standard behavior for any close-based indicator — and settles the moment the bar closes.
What is the Smoothing MA actually averaging?
The EMA line itself, not price. It is a moving average of a moving average — a slower echo of the trend line, used for EMA-vs-signal-line crosses or simply as a steadier companion reference.
Put a real trend line on your chart
The EMA preset is available on every Crodl terminal chart — add it from the indicator picker, set your length, and stack as many instances as your system needs, alongside live trading on six exchanges.
This article is for educational purposes only and is not financial advice. Leveraged trading carries substantial risk of loss. Always do your own research and never risk more than you can afford to lose.

Ready to automate your trading?
Connect your exchange, set up automations, and start trading smarter — all from one platform.
Start Trading Free