
Trend Ribbon
Eight stacked EMAs from 20 to 55 that paint green only on full alignment, plus EMA 140/200 anchors. How Crodl's Trend Ribbon defines a trend and when to trust it.
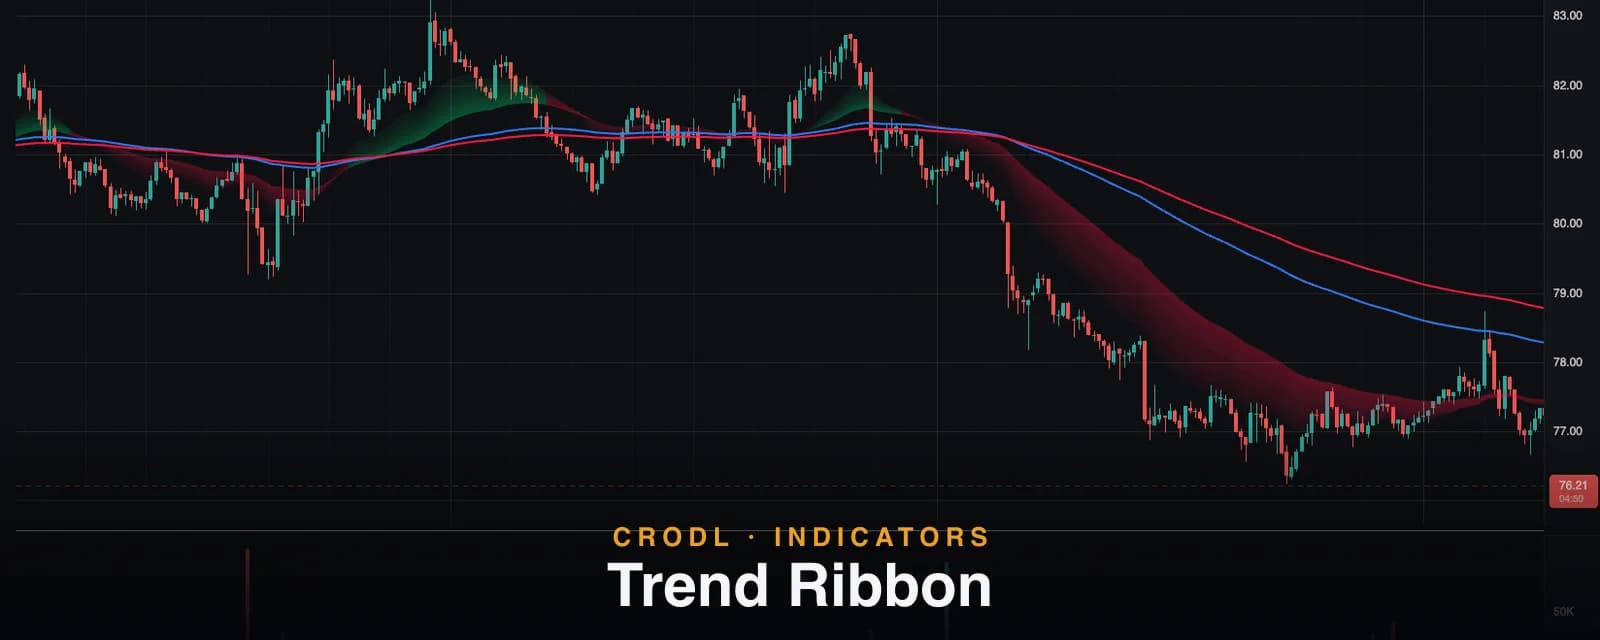
Most trend tools give you a spectrum and leave the judgment call to you. The Trend Ribbon takes the opposite position: it defines an uptrend precisely — eight EMAs, every single one stacked in perfect order — and paints the chart green only when that definition is met. Anything less is red. No "sort of bullish," no partial credit.
The ribbon plots eight exponential moving averages at lengths 20 through 55 in steps of five, filled with a gradient that deepens toward the slow end, plus two standalone trend EMAs — 140 and 200 by default — that anchor the bigger picture. The result is a chart you can read from across the room: green band under price, longs are in season; red band, they are not.
This post covers what full alignment actually means, how the Crodl preset computes and draws it, and how traders use a deliberately strict regime filter without being whipsawed by it.
What the Trend Ribbon shows
The core of the indicator is a single boolean, evaluated every bar: is EMA 20 above EMA 25, which is above EMA 30, and so on through EMA 55 — all seven comparisons true at once?
- Full alignment (green). Every fast average is above every slower one. Mathematically, this means price has been persistently rising across all of the lookback horizons from roughly a month of hourly bars to several months of them. It is the strictest common definition of an uptrend.
- Anything else (red). One inversion anywhere in the stack — say the 30 dips below the 35 during a deep pullback — and the entire ribbon flips bearish. The indicator does not distinguish "mild wobble" from "full breakdown"; that severity read is your job, and the red paint is the prompt to look.
The tight 5-period spacing is what gives the flip its meaning. Eight EMAs between 20 and 55 sample one zone of the trend densely, so full alignment certifies that this zone is internally consistent — not just that a fast line is above a slow one, but that the whole neighborhood agrees. Compare that with the EMA Ribbon, whose Fibonacci lengths from 8 to 233 spread across many horizons and are meant to be read as a gradient rather than a verdict.
On top of the ribbon, the EMA 140 (blue) and EMA 200 (red) run as independent lines with their live values on the price scale. They are the slow context the ribbon deliberately excludes: which side of the 200 you are on is the classic macro bull/bear line, and the 140/200 pair crossing is a slower regime signal of its own.
How it works on the Crodl terminal
The Trend Ribbon is a Rune preset — an editable script, not a black box. Each bar it computes the eight EMAs, evaluates the full-alignment condition, and renders seven stacked fill bands between consecutive EMA pairs. The gradient is built from opacity: the 20–25 band is nearly transparent and each band down the stack gets denser, with the 50–55 band the deepest — so the ribbon visually "points" toward its slow edge and reads clearly without covering your candles.
Settings:
- Bull Ribbon Color — default bright green (
#00e676). - Bear Ribbon Color — default bright red (
#ff1744). - Show Ribbon Fill — default on; turn it off to keep only the alert logic and trend EMAs.
- EMA 1 Period / Color — default
140, blue, range 1–500. - EMA 2 Period / Color — default
200, red, range 1–500.
The ribbon lengths themselves (20–55) are fixed — they are the definition, and making them configurable would quietly change what a flip means. The two trend EMAs, by contrast, are fully adjustable, so you can turn them into a 100/200 pair or a 50/200 golden-cross setup without touching the script.
The preset also ships two built-in alerts — bull flip and bear flip — that fire on the exact bar the alignment state changes, so you can be paged on a regime change instead of watching for it.
| Component | Default | What it tells you |
|---|---|---|
| Ribbon EMAs | 20–55, step 5 (fixed) | Full stack = certified uptrend; any inversion = caution |
| Gradient fill | Alpha deepens toward EMA 55 | Direction of the slow edge at a glance |
| EMA 1 | 140, blue | Intermediate trend anchor |
| EMA 2 | 200, red | Macro bull/bear line |
| Flip alerts | Bull + bear | The bar alignment is gained or lost |
How traders use it
As a permission slip, not a signal
The ribbon's strictness makes it a poor entry trigger — by the time eight EMAs fully align, the move is well underway — and an excellent filter. The classic pattern: take long entries from a faster signal tool such as Quantum Pro only while the ribbon is green, and stand down or flip bias when it is red. The filter's job is to keep you out of counter-trend trades, and full alignment is a high bar that noise rarely clears.
Trading the flip itself
Because alignment demands persistence, a fresh green flip after an extended red period is a meaningful event — the market has rebuilt an entire ordered trend structure. Some traders treat the flip bar (or the first pullback after it) as a swing entry, with the understanding that flips lag bottoms by construction. The built-in alerts make this workable across a watchlist without screen-watching.
Reading pullbacks against the anchors
A red ribbon above a rising EMA 200 is the signature of a pullback within a larger uptrend — the dense 20–55 zone has broken order, but the macro line holds. That configuration is where "buy the dip" has structure behind it: wait for price to stabilize near the 140/200 anchors, then let the ribbon re-align as confirmation.
Multi-timeframe stacking
A common desk setup: daily ribbon for regime, 4-hour ribbon for timing. Trade long only when both are green; tighten stops when the lower timeframe flips red while the higher stays green. The strict definition makes agreement between timeframes genuinely informative.
Frequently Asked Questions
Why is the ribbon red when price is clearly going up?
Because one pair of EMAs is out of order. Early in a recovery the fast EMAs cross up first while the 45/50/55 are still inverted — the ribbon stays red until the entire stack agrees. That lag is the feature: green means the trend is established, not that it just started.
How is this different from the EMA Ribbon?
The EMA Ribbon is descriptive — eight Fibonacci EMAs on a color gradient you interpret yourself. The Trend Ribbon is prescriptive — it evaluates one strict condition and gives you a binary answer plus alerts. Many traders run the EMA Ribbon to see structure and the Trend Ribbon to enforce discipline.
Can I change the ribbon lengths?
Not from settings — 20 through 55 is the definition the flip is built on. The preset is an editable Rune script if you want to experiment, and the standalone EMA preset lets you build any custom stack line by line. The two trend EMAs (140/200) are fully configurable.
Does it repaint?
No. EMAs are computed from closes: closed bars never change, and the alignment state on the live bar simply updates until the bar closes. Flip alerts fire on the bar where the state change occurs.
Let the chart call the regime
The Trend Ribbon is available on every Crodl terminal chart — add it from the indicator picker, wire up the flip alerts, and let full alignment do the arguing, alongside live trading on six exchanges.
This article is for educational purposes only and is not financial advice. Leveraged trading carries substantial risk of loss. Always do your own research and never risk more than you can afford to lose.

Ready to automate your trading?
Connect your exchange, set up automations, and start trading smarter — all from one platform.
Start Trading Free