
EMA Ribbon
Eight Fibonacci-spaced EMAs from 8 to 233 painted as one warm-to-cool ribbon. How Crodl's EMA Ribbon works and how traders read expansion, compression, and order.
A single moving average tells you which side of the trend you are on. A ribbon tells you what the trend looks like — how orderly it is, how stretched it is, and whether it is breathing in or out. That extra dimension is why ribbon charts became a staple of crypto Twitter long before most traders could explain what they were actually plotting.
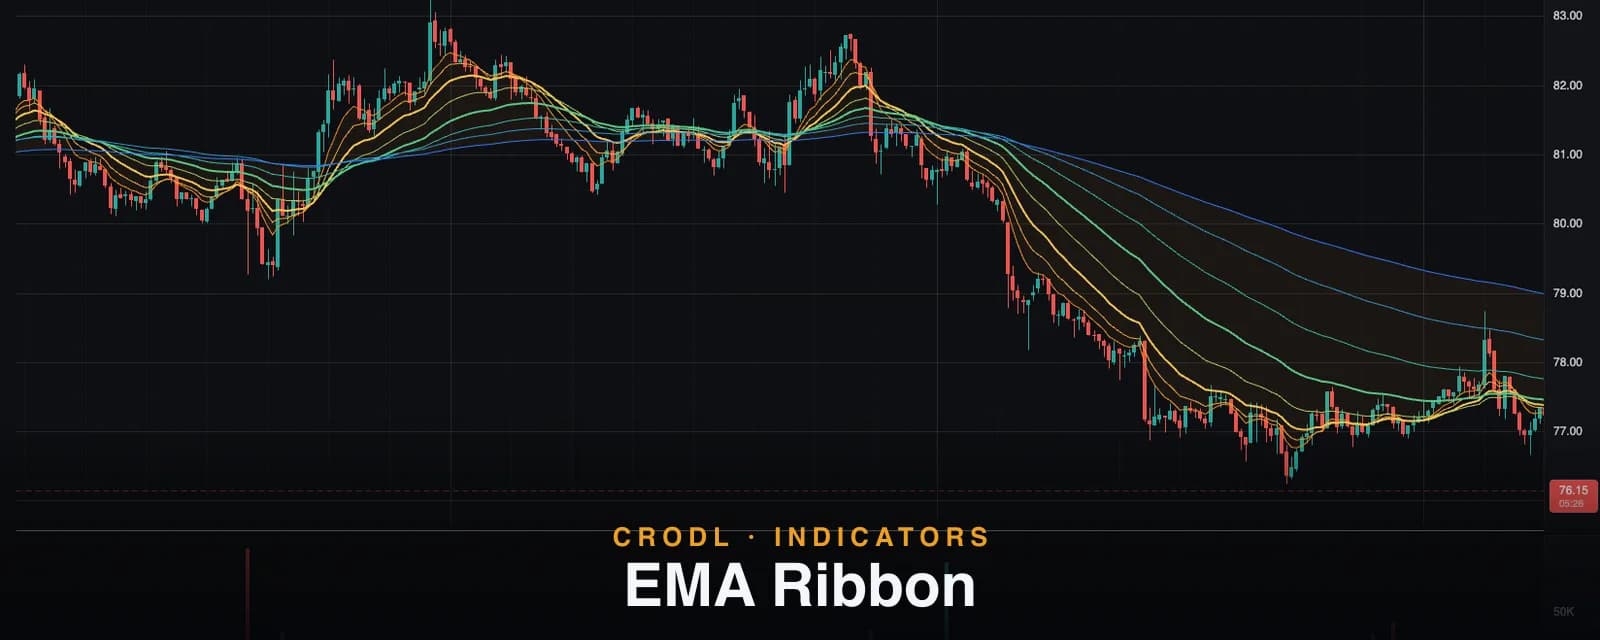
The EMA Ribbon on the Crodl terminal plots eight exponential moving averages at Fibonacci lengths — 8, 13, 21, 34, 55, 89, 144, and 233 — colored on a warm-to-cool gradient from orange at the fast end to blue at the slow end. One click, and the full structure of the trend is on your chart: the fast lines that react in hours, the slow lines that define the regime, and the space between them that tells you how much energy the move has left.
This post explains what the ribbon's shape means, exactly how the Crodl preset is built, and the specific patterns traders act on.
What the EMA Ribbon shows
Each line in the ribbon is just an EMA — the same primitive covered in our EMA guide. The information is in the relationships between them:
- Order. In a clean uptrend the EMAs stack fastest-on-top: 8 above 13 above 21, all the way down to 233. In a downtrend the stack inverts. A scrambled, interleaved ribbon means no trend at all.
- Width. The vertical distance between the fast and slow edges is a visual momentum gauge. A widening ribbon is a trend accelerating; a narrowing one is a trend running out of participants.
- Compression. When all eight lines squeeze into a tight braid, the market has agreed on a price. Ribbons compress before they expand — the squeeze is the setup, the fan-out is the move.
The Fibonacci spacing (8, 13, 21, 34, 55, 89, 144, 233) is not numerology — it is a practical sampling schedule. Consecutive lengths grow by a factor of ~1.6, so the ribbon covers everything from a fast momentum line to a half-year trend anchor without wasting lines on near-duplicates.
How it works on the Crodl terminal
The EMA Ribbon is a Rune preset — open it in the terminal's Rune editor and you will find eight ema() calls and nothing exotic. Its settings:
- Fastest Length — default
8, range 1–100. The ribbon's leading edge. - Slowest Length — default
233, range 50–500. The ribbon's anchor. - Show Ribbon Fill — default on. Shades the area between the fastest and slowest EMA with a soft translucent tint, so the ribbon reads as one body even when the lines are far apart.
The six interior lengths — 13, 21, 34, 55, 89, 144 — are fixed, keeping the Fibonacci structure intact while letting you tune the edges. The gradient runs from warm orange on the 8 through yellow-greens and teals to cool blue on the 233, so you can identify any line at a glance without hovering. Four reference lines — the 8, 21, 55, and 233 — print their live values on the price scale, and the 21 and 55 are drawn slightly bolder because they are the two most commonly traded pullback levels in the set.
| EMA | Gradient position | Typical role |
|---|---|---|
| 8, 13 | Warm (orange) | Momentum edge — first to bend at turns |
| 21, 34 | Warm-neutral (yellow-green) | Shallow pullback zone in strong trends |
| 55, 89 | Cool-neutral (green-teal) | Deep pullback zone; trend "last defense" |
| 144, 233 | Cool (blue) | Regime anchor — bull above, bear below |
If you want a ribbon that makes the regime call for you — flipping color only when every line is perfectly stacked — that is a different tool: the Trend Ribbon, which trades the gradient for a strict bull/bear paint.
How traders use it
Regime first, entries second
The fastest read is binary: is the ribbon stacked, and which way? A fully ordered bullish ribbon means longs-only is a defensible stance; an interleaved mess means most trend signals on that timeframe are noise. Many traders use the ribbon purely as this filter and take their actual entries from a signal tool such as Risk Pilot.
Buying the ribbon, not the price
In an established trend, pullbacks tend to terminate inside the ribbon — commonly at the 21/34 band in strong trends, the 55/89 band in slower ones. The playbook: wait for price to re-enter the ribbon, watch for the fast lines to hold above the slow ones, and enter with invalidation below the band that caught price. You are buying a location, not a candle.
Trading the squeeze
Compression is the ribbon's highest-value pattern. When all eight lines braid together, mark the range: the eventual fan-out usually resolves violently, and the ribbon's re-stacking direction is your bias. Pairing the squeeze with a volume confirmation tool like Volume Shift helps separate the real expansion from the first false poke.
Reading exhaustion
When price stretches far above the orange edge and the ribbon's width hits an extreme, the rubber band is at maximum extension. That is not a short signal by itself — strong trends stay stretched — but it is a terrible place to initiate a long, and a reasonable place to take partials.
Frequently Asked Questions
Why Fibonacci lengths instead of round numbers?
Geometric spacing. Each length is roughly 1.6× the previous, so every line adds genuinely new information — a 10/20/30/40 ribbon oversamples the fast end and undersamples the slow end. The specific numbers also happen to be the ones a large share of the market watches, which is its own kind of edge.
Can I change the middle EMAs?
Not from the settings — the interior six are fixed to preserve the structure. The preset is an editable Rune script, though, so the lengths are one keystroke away in the editor. For a fully parameterized single line, use the standalone EMA preset and stack instances.
Does the ribbon repaint?
No. Every line is a close-based EMA: fixed on closed bars, updating tick-by-tick only on the live bar. The shape you see in history is the shape that was there.
Which timeframes does it work on?
All of them, with one adjustment: the meaning scales with the timeframe. On the daily, the 233 is a macro cycle line; on the 5-minute it is a session anchor. The patterns — stacking, compression, pullback-to-band — read identically everywhere.
Put the whole trend on your chart
The EMA Ribbon is available on every Crodl terminal chart — add it from the indicator picker and get all eight Fibonacci EMAs, the gradient, and the fill in one click, alongside live trading on six exchanges.
This article is for educational purposes only and is not financial advice. Leveraged trading carries substantial risk of loss. Always do your own research and never risk more than you can afford to lose.

Ready to automate your trading?
Connect your exchange, set up automations, and start trading smarter — all from one platform.
Start Trading Free