
Risk Pilot
A CRODL original: UT-Bot-style ATR trailing stop crosses filtered by a trend SMA, with strict long/short alternation. How Risk Pilot works and how to trade it.
Most losing trades in a trending market share one anatomy: the entry was against the higher-order trend. The signal itself was fine — a clean cross, a textbook flip — but it fired counter-trend, and the market's prevailing direction ground it down. A signal tool that refuses to fire against the trend removes that entire category of loss before you ever click buy.
Risk Pilot, a CRODL original, is built around exactly that refusal. Its engine is a UT-Bot-style ATR trailing stop — a line that ratchets behind price and flips sides when price closes through it. Its discipline comes from two gates layered on top: a trend SMA filter, so Buy signals only print with price above the moving average and Sells only below it, and strict alternation, so you never get two Buys in a row — each signal must be answered by its opposite before it can repeat.
This post covers what the trail and the filter each contribute, exactly how the Crodl preset computes its signals, and how traders put a deliberately conservative signal set to work.
New: want these signals traded mechanically — entry at the signal close, stop beyond the producing candle, target at 1:4, with a win-rate scoreboard? That's Risk Pilot Strategy, built on this exact engine.
What Risk Pilot shows
Three layers appear on your chart:
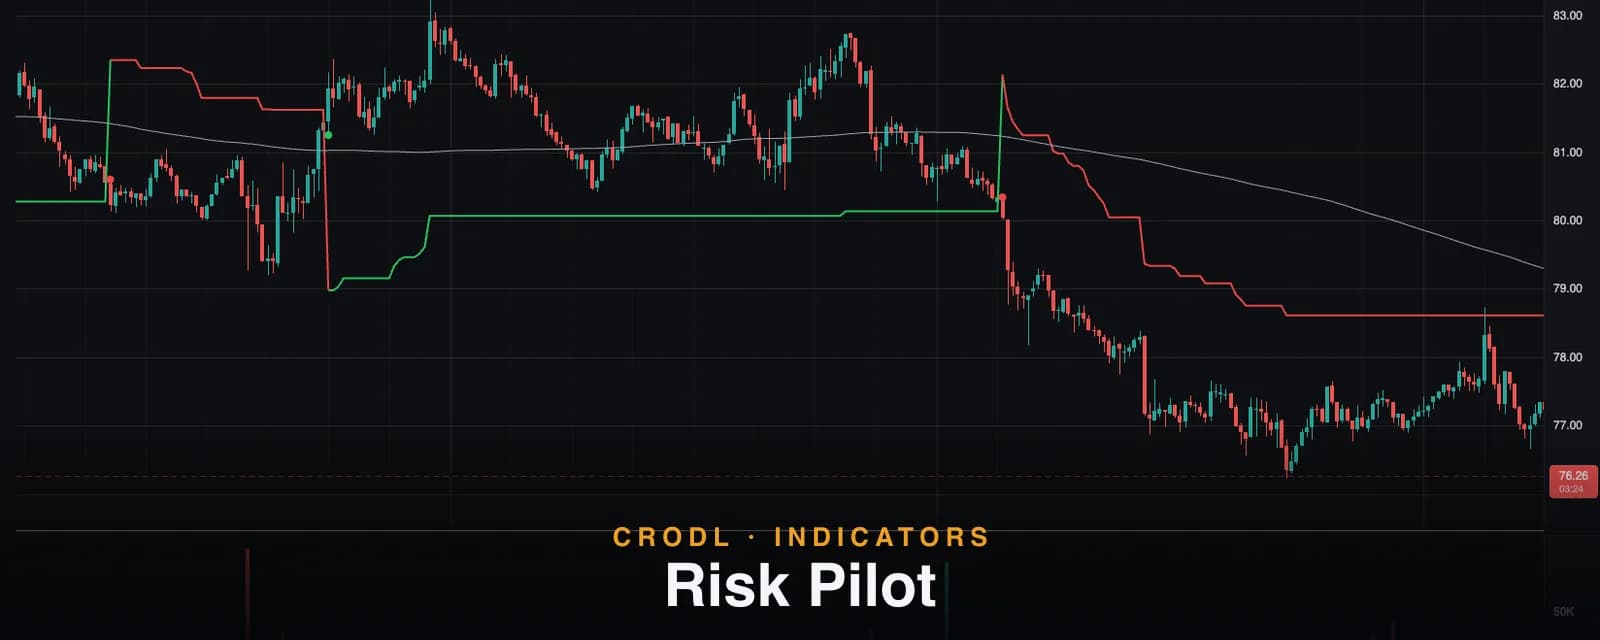
- The ATR trail. A single line that rides below price during bullish regimes (drawn green) and above it during bearish ones (drawn red). Its distance from price is set by volatility — wide when the market is wild, tight when it is calm — and it ratchets: in an up-regime it can only rise, locking in progress until price breaks it.
- The trend SMA. A gray simple moving average (default 200) that defines which signals are allowed to exist. It can be hidden, but it is always enforced.
- The signals. A green triangle below the bar for Buy, a red triangle above it for Sell — printed only when the trail cross and the SMA filter agree, and only when the signal alternates from the previous one. Both are wired to built-in alerts.
The design intent is fewer, cleaner signals. Raw trailing-stop crosses fire constantly in chop; Risk Pilot's two gates are there to throw most of those away.
How it works on the Crodl terminal
Risk Pilot is a Rune preset — the script is fully readable and editable in the terminal's Rune editor. Per bar, four steps:
1. The trail. The stop distance is ATR(ATR Period) × ATR Multiplier — default ATR(21) × 6.3, a deliberately wide, swing-oriented setting. While closes hold above the trail, it sits that distance below price and only ratchets upward; while closes hold below, it mirrors above price and only ratchets down. This is the classic UT-Bot trailing-stop recursion.
2. The cross. When the close crosses the trail — from below to above, or above to below — the internal position state flips. This is the raw signal most UT-Bot variants stop at.
3. The filter. A cross only arms a signal. A Buy prints only when the position state is long and the close is above the trend SMA (default length 200); a Sell requires the short state and a close below it. Crosses that happen on the wrong side of the SMA are silently discarded.
4. The latch. Signals strictly alternate — after a Buy, the next printable signal is a Sell, matching the long/short latches of the original CRODL Risk Pilot v1.1 Pine strategy. If the market whips back and forth across the trail while staying on one side of the SMA, you get one signal, not five.
One honest note on the filter: the Pine original filtered against an hourly SMA(20) regardless of chart timeframe. The Rune dialect is single-timeframe, so the preset uses a current-timeframe SMA instead — the default of 200 approximates the same idea on typical intraday charts, and the setting's hint suggests scaling it to your timeframe (an hourly SMA(20) is roughly an SMA(1200) on the 1-minute chart, or simply 20 if you trade the hourly itself).
| Parameter | Default | What it does |
|---|---|---|
| ATR Period | 21 | Volatility lookback for the trail |
| ATR Multiplier | 6.3 | Trail distance in ATR multiples — wide by design |
| Trend SMA Length | 200 | The filter line; scale it to your timeframe |
| Show Trend SMA | On | Display toggle — the filter applies either way |
| Bull / Bear Color | Green / red | Trail and marker colors |
For the mechanics of ATR itself — the measure everything here scales from — see our ATR guide.
How traders use it
Swing entries with the trend
The default profile — a 6.3× ATR(21) trail plus a long SMA filter — makes Risk Pilot a swing tool: signals are infrequent and only fire with the prevailing trend. The straightforward playbook is to treat each Buy as a with-trend entry, place the initial stop beyond the trail line, and hold until the opposite signal or your target. Because the trail is wide, it tolerates normal pullbacks that shake tighter systems out.
The trail as a management line
Between signals, the trail is a ready-made trailing stop: as it ratchets up under a long, moving your stop with it locks in progress mechanically. Traders who want a faster, unfiltered trail specifically for exits often pair Risk Pilot's entries with Sentinel Trail — the classic UT-Bot at 1× ATR(10) — on the same or a lower timeframe.
Stacking a second opinion
Risk Pilot's SMA filter is one-dimensional by design. Traders who want regime confirmation with more structure run it alongside a fully-stacked Trend Ribbon or take only the Risk Pilot signals that agree with Quantum Pro's band direction. Confluence between independent tools is worth more than any single tool's tuning.
Tuning it honestly
Lowering the multiplier or ATR period makes the trail hug price and signal more often — and reintroduces exactly the whipsaws the defaults were chosen to avoid. If you shorten your timeframe, shorten the SMA proportionally, or the filter becomes so slow it never lets shorts (or longs) through. And treat the signals as what they are: structured decision points, not predictions — no signal tool guarantees outcomes.
Frequently Asked Questions
Price crossed the trail — why was there no signal?
Two legitimate reasons. Either the close was on the wrong side of the trend SMA (a long cross below the SMA is discarded), or the alternation latch suppressed it — you already hold that direction's signal, and a repeat in the same direction never prints.
How is Risk Pilot different from Sentinel Trail?
Same engine family, different job. Sentinel Trail is the faithful classic UT-Bot — tight 1× ATR(10) trail, no trend filter, signals on every flip. Risk Pilot runs a much wider 6.3× ATR(21) trail and adds the SMA filter plus strict alternation. Sentinel is the fast unfiltered scalpel; Risk Pilot is the filtered swing tool.
Is this the full Risk Pilot strategy?
It is the entry-signal core of CRODL Risk Pilot v1.1. The Pine original's risk management — targets, break-even moves, position handling — is deliberately not ported: on the terminal, execution and risk live in the trade ticket, and the indicator makes no backtested performance claims.
Does it repaint?
No. Signals are confirmed on bar close: once a bar closes, its trail value, state, and any marker are fixed. On the live bar the state can change until the close — standard for close-confirmed systems.
Fly with a filter
Risk Pilot is available on every Crodl terminal chart — add it from the indicator picker, wire the Buy and Sell alerts, and let the trend filter veto your worst entries, alongside live trading on six exchanges.
This article is for educational purposes only and is not financial advice. Leveraged trading carries substantial risk of loss. Always do your own research and never risk more than you can afford to lose.

Ready to automate your trading?
Connect your exchange, set up automations, and start trading smarter — all from one platform.
Start Trading Free