
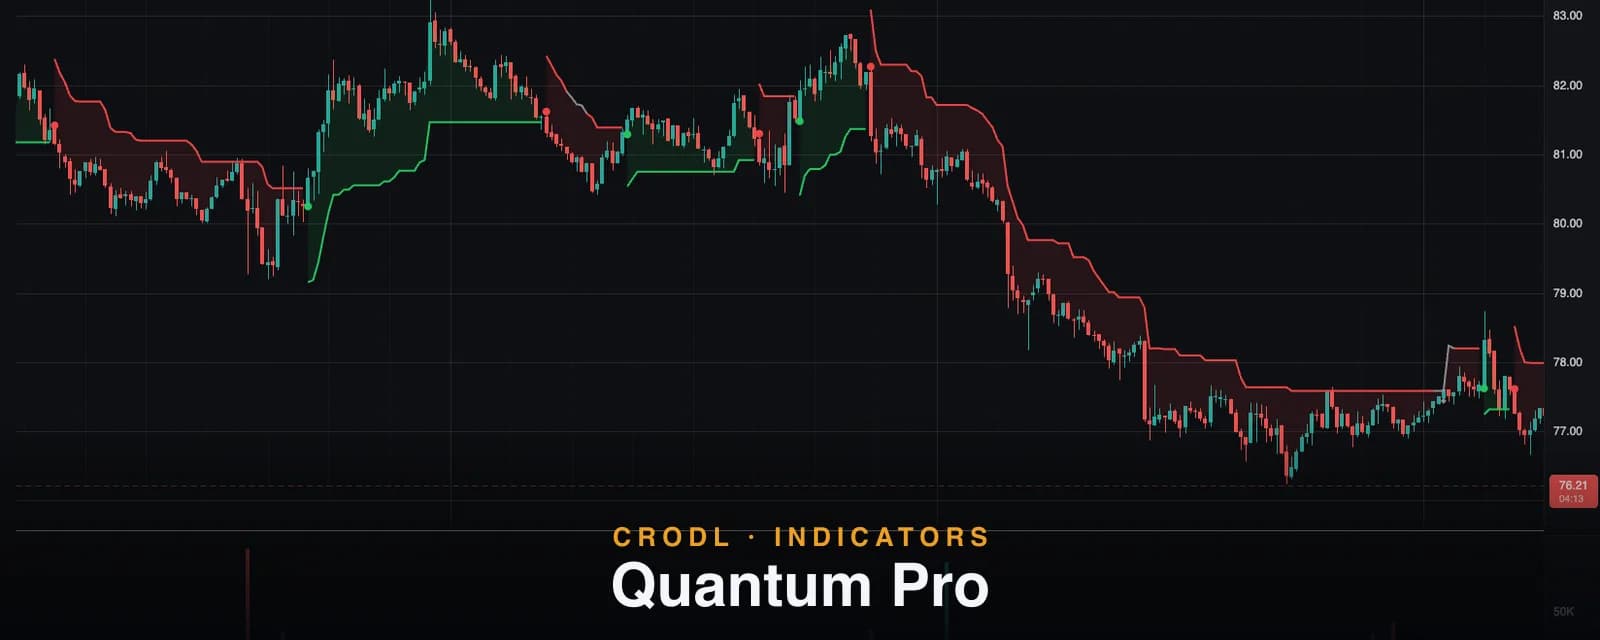
Quantum Pro
A CRODL original: an adaptive Supertrend-style band with a volatility-regime filter that blocks flips in chop. How Quantum Pro works and how to trade its signals.
Every trend-flip indicator has the same failure mode: it works beautifully in trends and bleeds you dry in chop. The band flips long, the market stalls, the band flips short, the market stalls — and each flip is a small loss that has nothing to do with your read being wrong and everything to do with the tool firing in conditions it was never built for.
Quantum Pro, a CRODL original, attacks that failure mode directly. Underneath, it is an adaptive trailing band in the Supertrend family — an ATR-scaled envelope that ratchets behind price and flips direction when price breaks through it. On top, it adds the piece most flip tools are missing: a volatility-regime filter that measures whether the market is actually moving, and blocks flips while it is not. When the filter vetoes a flip, Quantum Pro tells you — a gray diamond marks the attempt that was suppressed.
This post explains what the band and the gate each measure, exactly how the Crodl preset computes them, and how traders use a flip signal that knows when to stay quiet.
What Quantum Pro shows
Three things live on your chart:
- The band. In an uptrend, a green line rides below price — the trailing floor. In a downtrend, a red line rides above it — the trailing ceiling. A soft fill connects the band to the bars so the active regime is unmistakable.
- The flips. When price closes through the band, the trend state flips and a triangle prints — Buy at the bar's low, Sell at the bar's high. Both are wired to built-in alerts.
- The gate. When the volatility regime is too quiet, the band turns gray and flips are suppressed. Any bar where a flip would have fired but was blocked gets a small gray diamond, so you can always see what the filter cost you — and audit whether it earned its keep on your market.
The mental model: the band answers "which way?", the gate answers "is there anything here worth flipping for?"
How it works on the Crodl terminal
Quantum Pro is a Rune preset — the full script is readable and editable in the terminal's Rune editor. Per bar, the computation runs in three stages.
1. The adaptive band. From the price source (default hl2, the bar midpoint; close optional), the script builds raw bands at source ± ATR(Trend Period) × Trend Sensitivity — default ATR 14 and multiplier 3.0. The bands then ratchet, Supertrend-style: while price holds above the lower band, that band can only rise; while price holds below the upper band, it can only fall. Ratcheting is what turns a volatility envelope into a trailing stop — the band locks in progress and never gives it back within a regime.
2. The regime filter. The script compares a fast ATR (default period 7) against a slow ATR (default 50). Their ratio is a compact volatility-regime gauge: near or above 1, current volatility is at or beyond its recent norm — real movement. Well below 1, the market is quieter than its own baseline — the conditions where flip tools whipsaw. The gate opens when the ratio is at or above the Regime threshold (default 0.75) and closes below it. The filter can be disabled entirely with one toggle.
3. The flip logic. A bull flip requires price to close above the upper band while the gate is open; a bear flip mirrors it through the lower band. If price breaks the band while the gate is closed, no flip occurs — the trend state holds, the band renders gray, and a diamond marks the blocked attempt (toggleable via Mark blocked flips). Three alerts ship with the preset: buy, sell, and blocked.
| Parameter | Default | What it does |
|---|---|---|
| Trend Sensitivity | 3.0 | Band width in ATR multiples — higher means wider bands, fewer signals |
| Trend Period | 14 | ATR length for the band |
| Price source | hl2 | Band center: bar midpoint or close |
| Enable regime filter | On | Master switch for the volatility gate |
| Fast / Slow regime period | 7 / 50 | ATR pair whose ratio defines the regime |
| Regime threshold | 0.75 | Gate opens when fast/slow ATR ratio is at or above this |
If you want the unfiltered classic to compare against, the standard Supertrend is on the terminal too, and our ATR guide covers the volatility measure both are built on.
How traders use it
Trend entries with a built-in chop veto
The core use is straightforward trend-following: take the Buy flip, ride the green band, exit or reverse on the Sell flip. What changes versus a plain Supertrend is the trade distribution — the gate removes a slice of flips concentrated in dead, range-bound tape. You will occasionally miss the first bar of a real breakout that started from silence; in exchange you skip a family of whipsaws. The gray diamonds let you review exactly which trades the filter took away.
The gray band as a stand-aside signal
A gray band is information on its own: the trend state is technically intact, but volatility has died. Many traders treat gray as "manage, don't initiate" — tighten stops on the open position, stop taking fresh entries, and wait for the band to re-color before trusting new signals.
The band as a trailing stop
Because the band ratchets, it doubles as a disciplined trailing stop for a position you are already in — trail your stop just beyond the band and let the flip take you out. Traders who want a dedicated tool for that job often pair Quantum Pro's entries with Sentinel Trail for exit management, or use Risk Pilot when they prefer a trend-SMA-filtered signal set.
Tuning honestly
Two dials matter. Trend Sensitivity trades frequency for quality — 3.0 suits swing timeframes; scalpers drop it knowing the whipsaw count rises. The Regime threshold sets how much quiet the gate tolerates — raise it and more flips get blocked, lower it and the filter fades toward a plain Supertrend. Tune on your market and timeframe, and judge by the trades it removes, not just the ones it keeps. Quantum Pro's signals are tools for structuring decisions — not predictions, and not a promise of profitability.
Frequently Asked Questions
Is Quantum Pro just a Supertrend?
It is in the Supertrend family — same ATR band, same ratchet, same close-through-the-band flip. The differences: a configurable price source, the fast/slow ATR regime gate that can veto flips, the gray-band state, and the blocked-flip diamonds. With the filter disabled it behaves like a classic Supertrend.
What exactly do the gray diamonds mean?
Each diamond is a bar where price crossed the band — a flip attempt — while the volatility gate was closed, so the flip was suppressed. They exist for honesty: you can see every signal the filter cost you and judge whether the trade-off works on your market.
Does it repaint?
Closed bars never change: the band, trend state, and markers are fixed once a bar closes. On the live bar, the state updates tick by tick until the close — a flip only becomes final when the bar completes, which is standard for close-confirmed signals.
Is this the full Quantum Pro strategy?
It is the signal core. The original CRODL Pine version carried backtesting and automation layers; the terminal preset deliberately ports only the band, filter, and signals — execution belongs to the terminal's trade ticket, and no backtest results are implied by the indicator itself.
Trade the trend, skip the chop
Quantum Pro is available on every Crodl terminal chart — add it from the indicator picker, wire the buy and sell alerts, and let the regime filter argue with your FOMO, alongside live trading on six exchanges.
This article is for educational purposes only and is not financial advice. Leveraged trading carries substantial risk of loss. Always do your own research and never risk more than you can afford to lose.

Ready to automate your trading?
Connect your exchange, set up automations, and start trading smarter — all from one platform.
Start Trading Free