
Supertrend
How the Supertrend indicator works on the Crodl terminal: the ATR trailing band math, factor and ATR-length defaults, flip markers and alerts, and how traders use it.
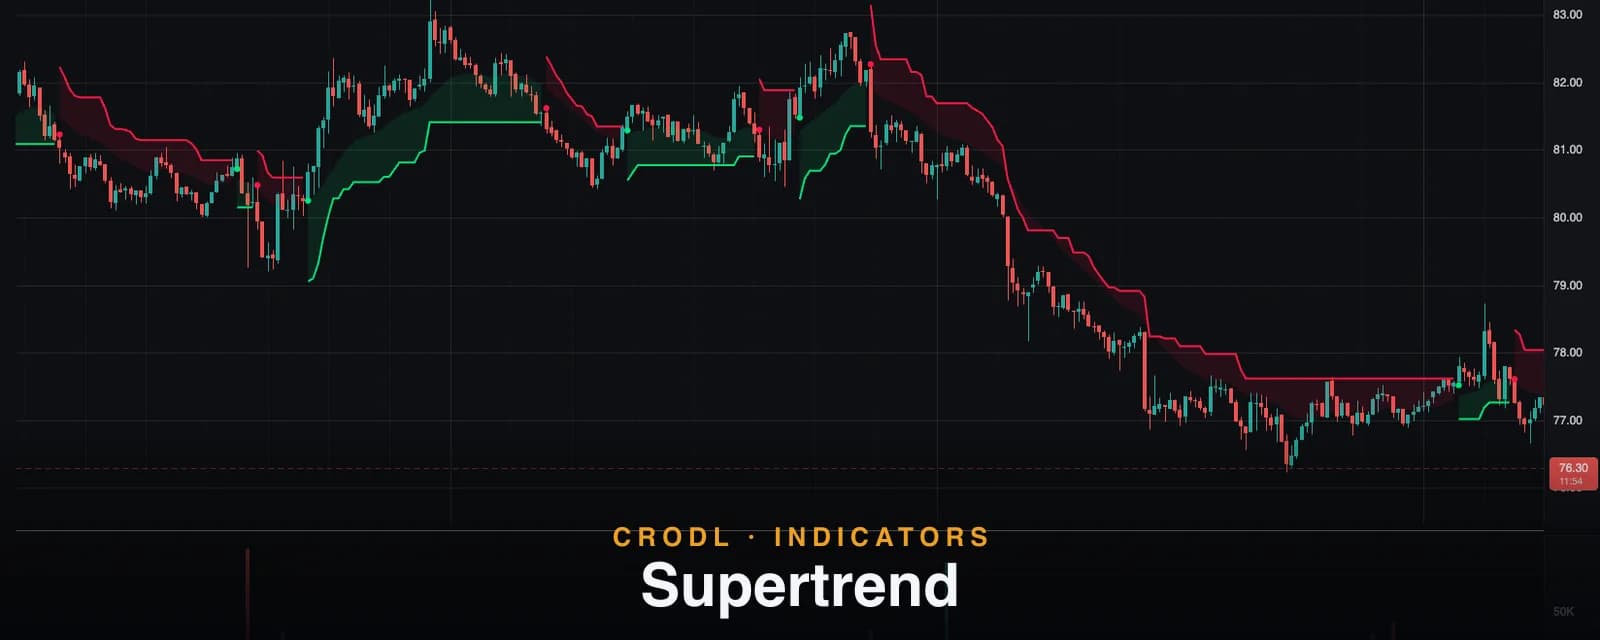
If you could only keep one trend indicator, a large share of traders would keep Supertrend. It answers the two questions every position needs answered — which way? and where am I wrong? — with a single line: below price while the trend is up, above price while it is down, trailing at a volatility-scaled distance that ratchets in the trend's favor and never gives ground.
The idea is old and sturdy: take the bar's midpoint, offset it by a multiple of ATR, and let the resulting band trail price like a stop that only tightens. When price finally closes through the band, the trend flips and the band jumps to the other side. Everything Supertrend does falls out of those two rules.
On the Crodl terminal, Supertrend ships as a Rune preset — the classic formulation, with the full script open to inspection and editing, flip markers, wired-in alerts, and a bias cloud that most implementations skip. Here is exactly how it computes, what the two settings really control, and how traders put it to work.
What Supertrend shows
- The Supertrend line — green (the Accent color, default
#00e676) and drawn below price during an uptrend; red (#ff1744) and drawn above price during a downtrend. The active side is tracked live on the price axis. - Flip markers — a triangle under the bar where the trend flips bullish, and one above the bar where it flips bearish.
- A bias cloud — a faint fill between the Supertrend line and a 21-period EMA, tinting the space between the trailing band and the short-term mean.
- Alerts —
bull_flip_alertandbear_flip_alertfire on the flip bars, so the indicator can watch the chart for you.
How it works on the Crodl terminal
Two inputs drive everything: ATR Length (default 10, range 2–50) and Factor (default 3.0, range 0.5–10).
Step one — raw bands. Each bar, the indicator takes the midpoint (high + low) / 2 and projects two candidate bands: a support band at midpoint − factor × ATR and a resistance band at midpoint + factor × ATR. With the defaults, that is three average true ranges below and above the middle of the bar — the volatility-scaled buffer that makes Supertrend self-adjusting across quiet and violent markets (the mechanics of ATR itself are covered in our ATR guide).
Step two — the ratchet. A raw band would wander down whenever volatility expanded, loosening your stop mid-trend. So the band is ratcheted: while the previous close held beyond the previous final band, the new band may only move in the trend's favor — in an uptrend, the support band is the higher of the new raw band and the old band. If the prior close failed to hold the band, the ratchet releases and the band resets to the raw value. Rising support never dips; falling resistance never lifts.
Step three — the flip. The trend state holds until price closes through the previous bar's final band: a close below the rising support band flips the trend bearish (and the line jumps above price), a close above the falling resistance band flips it bullish. Wicks through the line do not flip anything — the test is the close.
What the two settings actually do:
| Style | Factor | ATR Length | Behavior |
|---|---|---|---|
| Scalping | 1.5–2 | 7–10 | Hugs price; early flips, frequent whipsaws |
| Default | 3.0 | 10 | The classic balance for most markets |
| Swing | 4 | 14–21 | Survives normal pullbacks; later exits |
| Position | 5+ | 21+ | Only major reversals flip it |
Factor sets the distance in ATR units — the dominant dial. ATR length sets how quickly that distance adapts when volatility shifts. Doubling the factor roughly doubles both how much trend you keep and how much open profit you give back at the end; there is no setting that avoids that trade-off, only settings that choose a point on it.
How traders use it
As a trailing stop
The original use, and still the best one. Enter on your own signal, then trail your stop at the Supertrend line — on Crodl the active line publishes its value on the price axis, so dragging your position's stop to it from the chart takes seconds. The ratchet does the discipline for you: the stop tightens as the trend extends and never loosens.
As a regime filter
Longs only while price is above the line, shorts only while below. Supertrend's flips are close-based and ATR-buffered, which makes it a serviceable filter on trending pairs — though in ranges it whipsaws like any always-in tool. Pairing it with a consensus layer such as Deadband, or with the smoothed-candle read of CW Trend, and acting only on agreement filters out most of the chop damage.
Trading the flips
Flip-to-flip reversal trading works in strong trending regimes and gets eaten alive in ranges. Traders who trade the flips directly usually take only the flips aligned with a higher-timeframe filter and treat the opposite flips as exits, not entries. The wired-in alerts make this workable without screen-watching.
Reading the bias cloud
Crodl's preset adds a fill between the line and a 21 EMA. When the cloud is wide, price has room to pull back without threatening either the mean or the band; when the EMA converges toward the Supertrend line late in a move, the trend is compressing — flips that follow compression carry more weight.
Frequently Asked Questions
What are the best Supertrend settings for crypto?
Start with the defaults (10, 3.0). Crypto's volatility is already priced in by ATR, so most tuning is really timeframe tuning: intraday traders drop the factor toward 2, swing traders raise it to 4 with ATR 14–21. If you flip more than you trend, your factor is too small for the pair.
Does Supertrend repaint?
No. Bands and flips are computed from closed bars and the current close; once a bar closes, its band value and any flip are final. On the forming bar the line can shift until close — standard for close-based tools.
Supertrend vs Parabolic SAR — which trails better?
They trail on different logic: Supertrend keeps a constant ATR-scaled distance and tightens only when price makes progress, while Parabolic SAR accelerates toward price as a trend ages regardless of pullback depth. SAR exits stale trends sooner; Supertrend survives deep-but-normal pullbacks better. Many traders trail with Supertrend and use SAR flips as an early-warning light.
Why does my flip differ by one bar from TradingView's ta.supertrend?
Crodl's preset follows the classic Pine v4 formulation, which tests the close against the previous bar's final band; TradingView's newer ta.supertrend tests against the current band. On rare boundary bars that produces a one-bar difference in the flip. It is a deliberate, documented choice in the preset — not drift.
Trail the trend, automatically
Supertrend is available on every Crodl terminal chart — add it from the indicator picker and the trailing band, flip markers, and alerts are live in one click, alongside trading on six exchanges.
This article is for educational purposes only and is not financial advice. Leveraged trading carries substantial risk of loss. Always do your own research and never risk more than you can afford to lose.

Ready to automate your trading?
Connect your exchange, set up automations, and start trading smarter — all from one platform.
Start Trading Free