
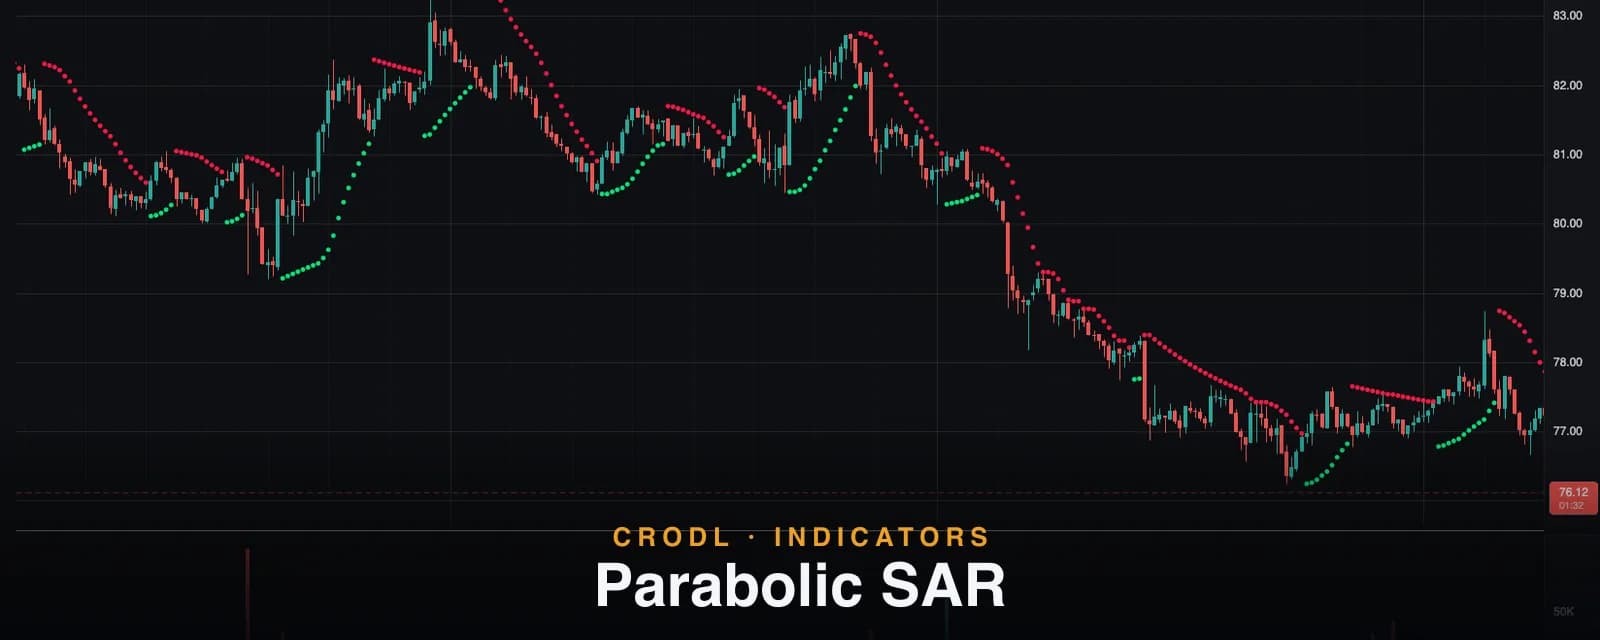
Parabolic SAR
Wilder's Parabolic SAR plots accelerating stop-and-reverse dots that trail price and flip on contact. How the SAR math works on the Crodl terminal and how to use it.
J. Welles Wilder built the Parabolic SAR in 1978 around a blunt conviction: a trend that stops making progress should stop being your position. SAR stands for stop and reverse — the indicator is a trail of dots that chases price, never retreats, and accelerates the longer the trend runs. The moment price touches a dot, the trend is declared over and the dots flip to the other side.
That acceleration is the signature. Most trailing tools give a trend the same amount of room forever; the SAR gets progressively more impatient. Early in a move the dots hang back and let the trend breathe. Every new extreme cranks the acceleration factor, the dots curve toward price — the "parabolic" in the name — and a mature trend ends up with almost no slack at all. Trends get killed either by reversal or by their own stagnation.
On the Crodl terminal, Parabolic SAR ships as a Rune preset: Wilder's original state machine, dot for dot, with the full script open to inspection and flip alerts wired in. Here is the actual math, the three settings that shape it, and how traders use a tool that is deliberately always in the market.
What Parabolic SAR shows
- Green dots below price while the SAR is in an uptrend — each dot is that bar's stop-and-reverse level.
- Red dots above price while it is in a downtrend.
- Flip alerts —
psar_flip_longandpsar_flip_shortfire on the bar where the dots switch sides, so reversals can notify you instead of requiring screen time.
There is no line, no band, no cloud — just the dots. Every dot is a literal price: the level at which the current trend is invalidated on touch.
How it works on the Crodl terminal
Three parameters drive the whole machine — AF Start (default 0.02), AF Increment (default 0.02), and AF Max (default 0.2) — where AF is the acceleration factor.
Each bar, the SAR advances toward the trend's extreme point:
SAR(next) = SAR + AF × (EP − SAR)
EP is the extreme point — the highest high since an uptrend began (or lowest low in a downtrend). Because the step is a fraction of the remaining distance to the EP, the dots always creep toward price every single bar, even when price goes nowhere. A stalling trend gets run down by its own stop.
The acceleration. AF starts at 0.02 when a trend begins. Every bar the trend prints a new extreme — a higher high in an uptrend, lower low in a downtrend — AF increases by the increment (0.02) up to the cap (0.2). Pullback bars leave AF unchanged. So a trend that keeps making progress earns a faster and faster trail: at AF 0.02 the dot closes 2% of the gap per bar; at the 0.2 cap it closes 20% per bar and hugs price tightly.
Wilder's clamp. A rising SAR is never allowed above the lower of the previous two bars' lows (mirror for a falling SAR against the prior two highs). This prevents the dot from being placed inside the immediately recent range, where ordinary noise would flip it instantly.
The flip. When a bar's range touches the dot — the low pierces a rising SAR, or the high pierces a falling one — the trend reverses on that bar: the new SAR starts at the old trend's EP, AF resets to its starting value, and the dots jump to the other side of price. Note the trigger is touch, not close: a wick to the dot is enough, which is exactly how a live stop order would behave.
| Setting | Default (range) | What it controls |
|---|---|---|
| AF Start | 0.02 (0.001–0.2) | How much slack a brand-new trend gets |
| AF Increment | 0.02 (0.001–0.2) | How quickly the dots accelerate on each new extreme |
| AF Max | 0.2 (0.01–1) | Top speed — how tightly a mature trend is hugged |
Lowering the increment (say 0.01) makes the SAR patient and swing-friendly; raising the max (0.3+) makes it a fast scalper's trail that tolerates almost no stagnation.
How traders use it
As a mechanical trailing stop
The dots are a ready-made trailing-stop ladder: hold the position while price stays on the right side, move your stop to each new dot. The built-in acceleration enforces something most traders fail at manually — tightening the stop as the trend matures — and because the dot never retreats, neither does your protection. It pairs naturally with Supertrend, which trails on ATR distance instead of time-based acceleration: SAR is usually the earlier, twitchier exit; Supertrend the more forgiving one.
As a time-based exit
The subtle edge of the SAR: it punishes stagnation. Because the dot converges on price every bar regardless of movement, a market that stops trending gets stopped out even without a real reversal. Traders who hate watching open profit rot in a sideways drift use SAR flips as the "this trade has expired" bell.
Flip signals — with a filter, always
The SAR is always long or short; there is no neutral state. In a genuine trend, flip-to-flip trading is beautiful; in a range, it is a fee-generating machine. The standard fix is a regime filter: take only the SAR flips that agree with a slower trend read — an EMA-based regime, or the hysteresis-gated state of Volume Shift — and treat counter-trend flips purely as exits.
On alerts
Because the flip conditions are declared as alerts in the preset, the terminal can page you at the exact stop-and-reverse bar. A common setup is SAR alerts on a handful of pairs as a reversal early-warning system, with the actual entry decision made against higher-timeframe structure.
Frequently Asked Questions
Why does the SAR flip constantly in sideways markets?
Because it is designed to be always in the market and to accelerate toward price. In a range there are no sustained extremes, so the dots converge and get touched repeatedly. This is not a flaw to tune away — it is the signal to stand aside or add a trend filter.
How do I make it looser or tighter?
Use the increment and max, not the start. AF Increment 0.01 with Max 0.1 gives a patient swing trail; the 0.02/0.2 defaults are Wilder's original balance; pushing the max higher makes it hug price for fast intraday work. The start value matters only for the first bars after each flip.
Does Parabolic SAR repaint?
No. Dots for completed bars are fixed the moment the bar closes, and a flip — triggered intrabar by price touching the dot — is final once it happens. The next dot is fully determined by the current bar's committed state.
Parabolic SAR or Supertrend for trailing stops?
Different philosophies: Supertrend keeps a constant volatility-scaled distance and only tightens when price makes progress; SAR tightens with time and acceleration no matter what. SAR exits stale trends earlier but gets wicked out of deep-pullback trends that Supertrend survives. Running both and exiting on the first hit is a legitimate compromise.
Put a stop that never sleeps on your chart
Parabolic SAR is available on every Crodl terminal chart — add it from the indicator picker and Wilder's dots, with flip alerts wired in, are trailing your pair in one click, alongside trading on six exchanges.
This article is for educational purposes only and is not financial advice. Leveraged trading carries substantial risk of loss. Always do your own research and never risk more than you can afford to lose.

Ready to automate your trading?
Connect your exchange, set up automations, and start trading smarter — all from one platform.
Start Trading Free