
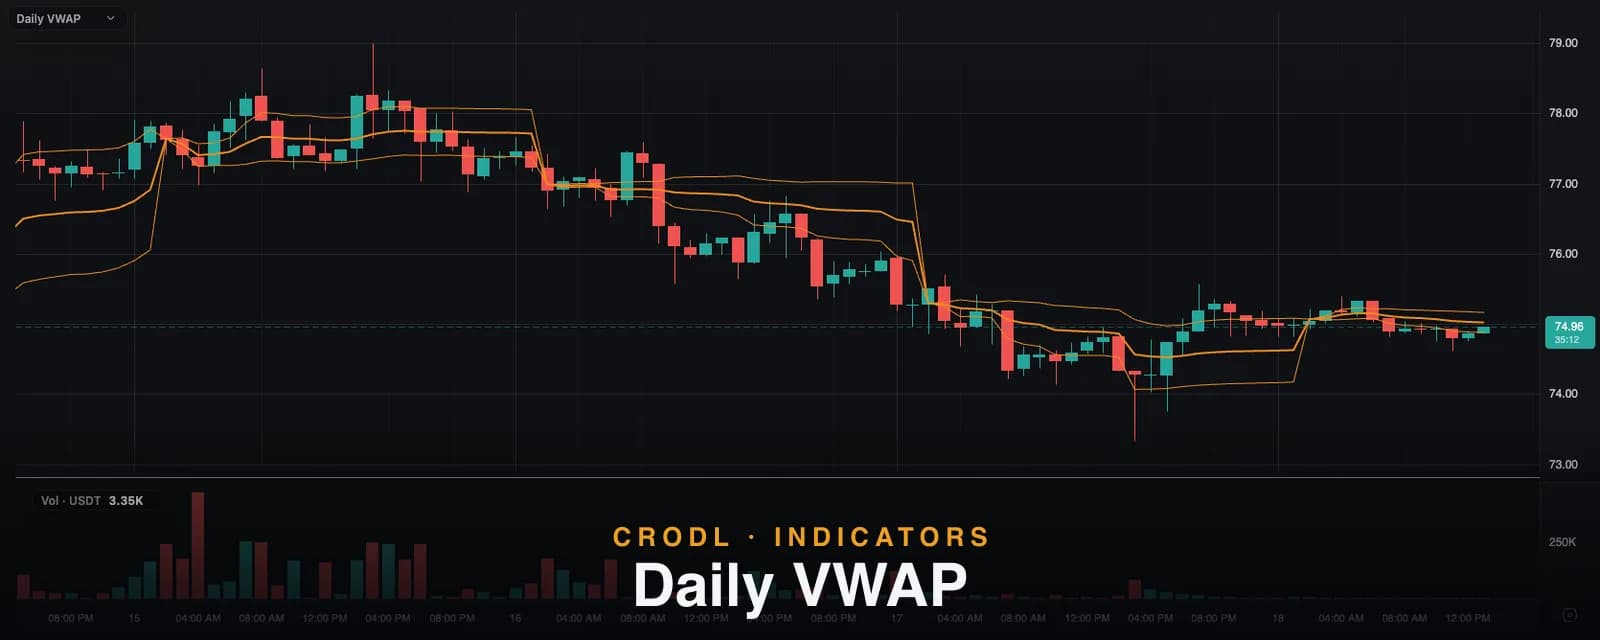
Daily VWAP: The Session's Fair-Value Line, Zero Configuration
The Daily VWAP indicator re-anchors on every daily candle and runs to end of day — the intraday fair-value line institutions benchmark against, with ±σ bands built in.
Ask an execution desk what price they answer to and the reply is one acronym: VWAP. The volume-weighted average price is the session's honest average — every trade weighted by its size — and it is the line institutional fills are benchmarked against. Which is precisely why intraday price respects it so often: the biggest participants are graded on which side of it they transact.
Daily VWAP on the Crodl terminal is that line with zero setup: it anchors on every daily candle open and runs to end of day, then the next day's anchor takes over. Add it and you are done — no anchor to choose, no session to configure. It ships with ±1σ bands on by default and is an open CRODL Rune preset, so the source is readable and forkable like everything else in the picker.
What it shows
- The VWAP line — a thick orange line: the volume-weighted average price of the current UTC day, from its first candle to the newest one. Every candle contributes its typical price (the average of high, low and close) weighted by its volume.
- The ±σ bands — thin lines in the same color, one volume-weighted standard deviation above and below. They start tight at the day open and breathe wider as the session's dispersion builds — price at the upper band is stretched above the day's fair value, price at the lower band stretched below it.
- The daily reset — at each daily candle boundary the whole structure re-anchors and begins again. Yesterday's VWAP ends where yesterday ends; it never bleeds into today's read.
The day boundary is the UTC midnight the exchanges themselves use for their daily candles, so the line on your chart re-anchors exactly where the 1D candle flips — no timezone surprises between the indicator and the data.
Why the daily anchor is the one that matters
VWAP is always an answer to "average since when?" — and for intraday trading, the day is the natural when. Overnight inventory, funding resets, and the simple fact that desks report daily make the day-open anchor the one most other participants are also watching. That shared attention is the self-fulfilling part of VWAP's usefulness: mean-reversion trades target it, execution algos work around it, and breakout traders use the side of it price holds as their bias line.
The Crodl picker has three VWAPs for three jobs, and they deliberately do not compete:
| Tool | Anchor | Best for |
|---|---|---|
| Daily VWAP | Every daily candle, automatically | The intraday session read — add and forget |
| VWAP | Your choice: Asia, London, New York, day, week, month, quarter, year, session | Named-session or higher-timeframe fair value |
| Anchored VWAP | Any candle you click | Average entry since an event — a low, a high, a news bar |
| VWAP Bands | Configurable | The full ±1/2/3σ band structure with filled zones |
Daily VWAP is the opinionated one: the anchor is pinned on purpose, because the daily reset is the configuration ninety percent of intraday use wants, and a tool with no decisions gets added faster and second-guessed less.
How traders use it
Bias line for the session
The simplest and most-used read: above the daily VWAP, buyers who transacted today are on average in profit and the session lean is long; below it, the reverse. Choppy crossing right at the line is a market with no intraday conviction — often the day to stand aside. Many traders take longs only above VWAP and shorts only below it, and let that one rule filter half their bad trades.
Fade the stretch back to fair value
The ±σ bands quantify "too far, too fast" for the session. Price tagging the upper band while momentum thins is a candidate fade back toward the line — the mean-reversion trade that VWAP is famous for — with the band itself as the location and VWAP as the target. The same trade mirrors at the lower band. It works best mid-session, once the bands have opened up; in the first bars of the day both bands hug the line and mean nothing yet.
The retest after the break
When price breaks away from VWAP with conviction, the highest-quality continuation entry is often the first pullback to the line: trend traders treat a reclaimed VWAP retest the way they treat a broken level retest. Pair it with Session Levels — the day open and VWAP converging at the same price is a level worth respecting from both sides.
Alerts on the cross
The preset declares its cross events, so the alert bell on the indicator works out of the box: Cross above VWAP and Cross below VWAP fire when a closed candle crosses the line. Set one on the pairs you stalk and let the terminal watch the reclaim for you — the same events are evaluated server-side, so the alert fires whether or not the chart is open.
Settings that matter
- Show Bands (default on) — the ±σ pair. Turn them off for the naked line if you only want the bias read.
- Band Mult (default 1.0) — how many standard deviations the bands sit from the line. 2.0 turns them from "stretched" into "extreme"; anything beyond that flags only the wildest sessions.
- VWAP Color / Band Color — both default to the house orange; the bands render thinner so the hierarchy stays readable even in one color.
An honest note on the model
VWAP's inputs are as good as the candles underneath it: the terminal computes it from each candle's typical price and volume, which is the standard chart-level construction — exchanges' own printed VWAPs built from raw trades can differ by a hair. The daily anchor also means early-session values are built from very few bars: the first half hour of VWAP and its bands is thin evidence, and the line only earns its authority as the day's volume accumulates. And at each midnight boundary the line steps to its new anchor — the short connector you see at the day change is the reset doing its job, not a data glitch.
Frequently Asked Questions
When exactly does the line reset?
At the UTC daily candle boundary — the same midnight your 1D candles open on. The indicator is deliberately pinned to the exchange's own day so the chart and the line never disagree about when "today" started.
How is this different from a moving average?
A moving average weights recent closes over a sliding window that never resets. VWAP weights every trade of the day by its volume from a fixed anchor. The difference is meaning: an MA is a smoothing device, VWAP is the actual average price the session's business was done at — which is why execution desks benchmark to it and not to an EMA.
Why do the bands start so tight every morning?
Because they measure the day's own dispersion, and a young session has not dispersed yet. Tight morning bands are honest — there is simply not enough evidence to call anything stretched. Most band-based trades wait for the session to mature.
I want a weekly anchor, or an anchor at a specific swing low — which tool?
The configurable VWAP preset does week, month, quarter, year and session anchors; the Anchored VWAP drawing tool anchors at any candle you click. Daily VWAP stays pinned to the day on purpose — that is its job.
The line the session answers to
Daily VWAP is one click away in the indicator picker on every Crodl terminal chart — no configuration, bands included, alerts ready. Run one full session with it on and you will know within a day why it is the first thing half the desk puts on a fresh chart.
This article is for educational purposes only and is not financial advice. Leveraged trading carries substantial risk of loss. Always do your own research and never risk more than you can afford to lose.

Ready to automate your trading?
Connect your exchange, set up automations, and start trading smarter — all from one platform.
Start Trading Free