
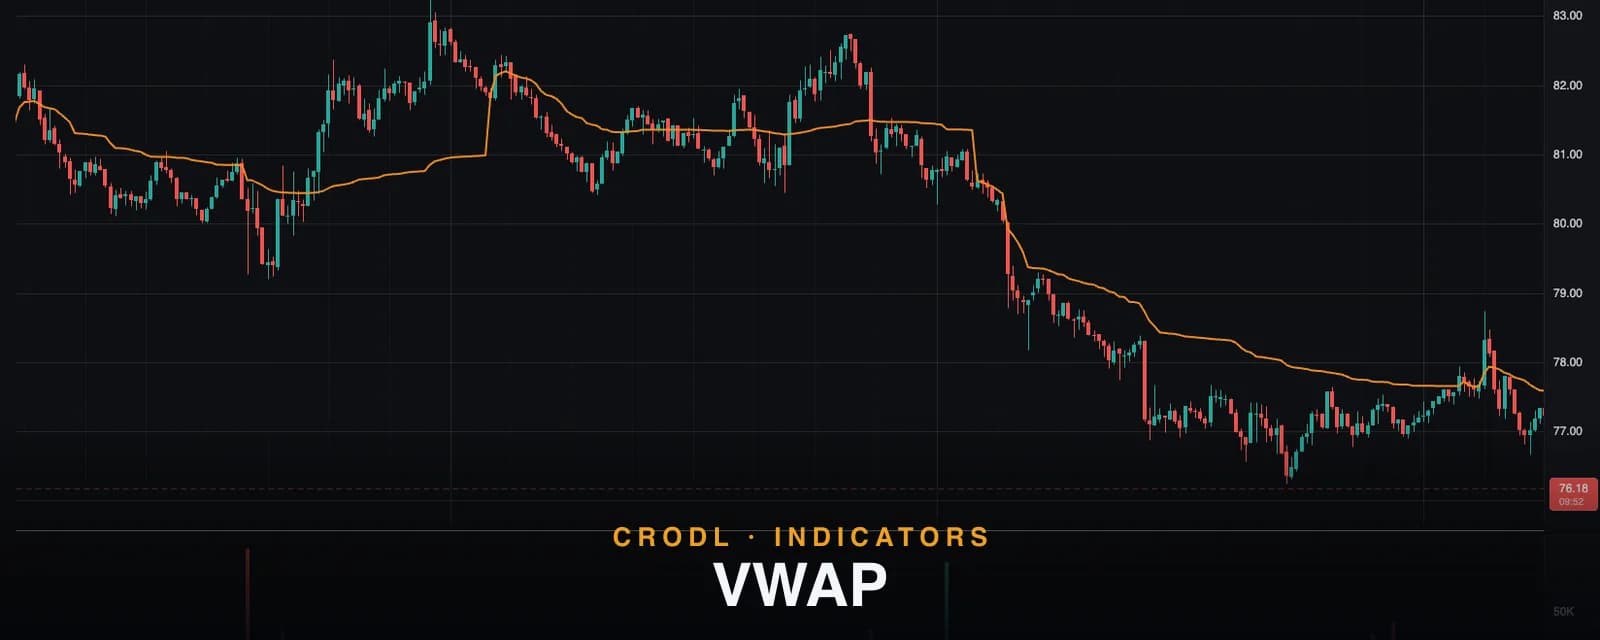
VWAP
VWAP is the volume-weighted average price — the market's anchored fair-value line. How Crodl's VWAP works, from daily to yearly anchors, and how traders use it.
Every trade that prints carries two facts: a price and a size. Most indicators throw the second one away. VWAP — the volume-weighted average price — is built on keeping it: since the anchor point, sum every bar's price times its volume, divide by total volume, and you get the average price the market actually paid, weighted by how much conviction stood behind each print.
That makes VWAP different in kind from a moving average. A moving average is a statistical smoothing of price; VWAP is closer to an accounting statement. It is the benchmark institutional execution desks are measured against — fill below VWAP on a buy program and you beat the market's own average — which is precisely why the level attracts so much algorithmic order flow. Traders watch VWAP because the biggest participants are required to.
The VWAP preset on the Crodl terminal is an anchored implementation with calendar and named-session anchor choices plus an optional standard-deviation band, written as an open CRODL Rune script. This post covers what the line means, exactly how the preset computes it, and the intraday and swing playbooks built on it.
What VWAP shows
VWAP is the fair-value line of the current anchor period. Price above it means the average buyer since the anchor is in profit and the tape is trading rich; price below means the average buyer is underwater and the tape is trading cheap. Three properties follow:
- It is volume-weighted. A thousand BTC traded at $80,000 moves VWAP a thousand times more than one BTC traded there. Quiet drift barely bends the line; heavy business relocates it.
- It is anchored, not rolling. VWAP restarts from zero at each anchor boundary and accumulates from there — so early in the period it is responsive, and as volume accumulates it becomes progressively harder to move. A late-day VWAP is a heavy, meaningful level.
- It is a magnet and a battleground. Because execution algos benchmark against it, reversion to VWAP and fights along it are structural features of the tape, not chart folklore.
How VWAP works on the Crodl terminal
The preset is a Rune script — you can open the source in the Rune editor and see the whole computation. Each bar it takes the typical price (high + low + close) / 3, multiplies by the bar's volume, and accumulates both sums from the anchor: VWAP = Σ(typical × volume) ÷ Σ(volume). At each anchor boundary the sums reset and the line restarts at the new period's first prints.
The Anchor parameter (default day) selects the reset schedule, evaluated in UTC:
| Anchor | Resets | Best for |
|---|---|---|
| Day / Session | Every day at 00:00 UTC | Intraday fair value; the classic day-trading VWAP |
| Asia | Every day at 00:00 UTC | Asian-session fair value |
| London | Every day at 07:00 UTC | London-session fair value |
| New York | Every day at 13:30 UTC | New York-session fair value |
| Week | Monday 00:00 UTC | Swing context; where the week's business was done |
| Month | 1st of the month | Position bias on higher timeframes |
| Quarter | Calendar quarters | Institutional benchmark periods |
| Year | January 1 | Macro fair value for the whole year |
Crypto trades around the clock, so on Crodl the generic session anchor and the day anchor behave identically — both reset at the UTC midnight boundary. The named session anchors instead restart at the same fixed UTC opens used by the terminal's Killzones study, then accumulate until that session opens again the next day.
The line draws in Crodl orange at width 2, tracks its live value on the price axis, and — a small but practical touch — has track_price enabled, so a dotted line follows the current VWAP value across the chart.
There is also an optional band pair, off by default: enable Show Bands and the preset plots dashed grey lines at VWAP ± Band Mult (default 1.0) volume-weighted standard deviations, computed on the same anchor buckets. It is a single-ring preview of the full three-ring treatment in VWAP Bands.
How traders use VWAP
Intraday bias line
The simplest and most durable read: above the daily VWAP, longs have the tailwind; below it, shorts do. Day traders use it as a regime filter — take setups only in the VWAP-side direction — which single-handedly keeps them from fighting the day's dominant flow.
Reversion to fair value
When price stretches far from VWAP on thinning volume, the anchored average acts as a magnet: execution algos work orders back toward their benchmark, and mean-reversion traders position for the return trip. The optional deviation band gives that stretch an objective measure rather than an eyeballed one.
The retest
VWAP's most tradeable moment is the retest: price breaks away from the line, then returns to test it from the other side. A daily VWAP reclaimed and held from above is a long trigger with an obvious invalidation — back below the line. The same logic scales up: reclaiming a weekly or monthly VWAP is a swing-sized event.
Anchored confluence
Running two VWAP instances — say daily and weekly — marks where short-term and longer-term fair value coincide. Confluence of anchored VWAPs with volume structure like the Volume Profile high-volume nodes identifies the levels the market has genuinely committed capital to.
Frequently Asked Questions
Why does VWAP jump at midnight UTC?
Because the anchor resets. The accumulated price-volume sums restart, so the line snaps to the new day's first prints. That is a feature — each period gets its own clean fair-value benchmark — but if the daily restart is too frequent for your style, anchor to week or month instead.
Is VWAP just another moving average?
No. A moving average weights every bar in its window equally (or by recency) and slides continuously. VWAP weights by traded volume and accumulates from a fixed anchor, so a high-volume bar moves it far more than a quiet one, and it gets heavier — harder to move — as the period matures. They answer different questions: "what is the smoothed price?" versus "what did the market actually pay?"
Which anchor should I use?
Match it to your holding period: Asia, London, or New York for a session-specific intraday benchmark; day for the full UTC trading day; week or month for swings; quarter or year for macro fair value. There is no single correct answer — the anchors are lenses, and many traders keep two on the chart at once.
When should I use VWAP Bands instead?
When you want the deviation structure, not just the line. This preset's optional single band is a lightweight stretch gauge; the VWAP Bands preset draws the full ±1σ, ±2σ, and ±3σ rings with filled zones and per-level toggles.
Put fair value on your chart
VWAP is one click away on every Crodl terminal chart — add the preset from the indicator picker, pick your anchor, and the price the market actually paid is drawn live across six exchanges' worth of pairs.
This article is for educational purposes only and is not financial advice. Leveraged trading carries substantial risk of loss. Always do your own research and never risk more than you can afford to lose.

Ready to automate your trading?
Connect your exchange, set up automations, and start trading smarter — all from one platform.
Start Trading Free