
VWAP Bands
VWAP Bands surround anchored VWAP with one, two, and three standard-deviation rings and filled zones. How the Crodl preset computes them and how traders trade the levels.
VWAP tells you where fair value is. It does not tell you what far from fair value means — and that second question is where the trades live. A price 1% above VWAP might be routine rotation on a volatile alt and a screaming extension on a quiet major. To trade the distance, you need the distance measured in the market's own units.
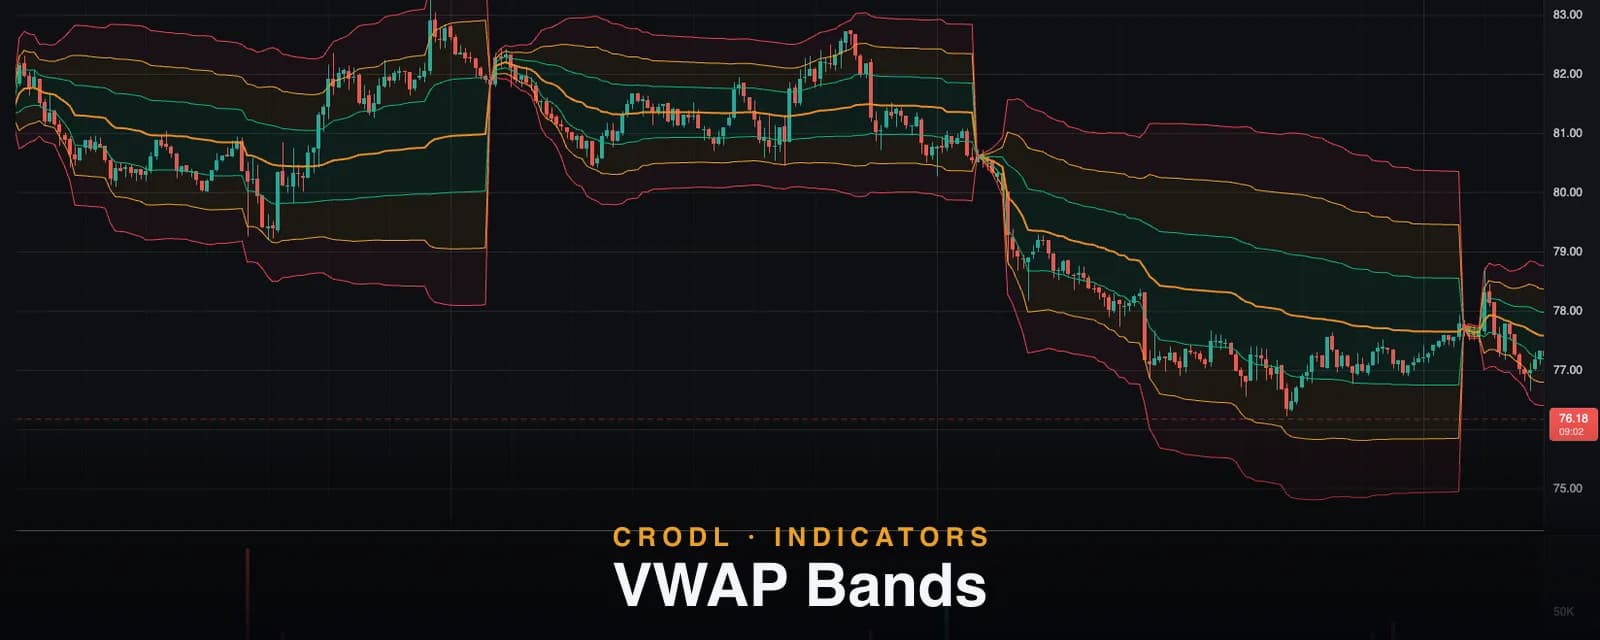
VWAP Bands on the Crodl terminal do exactly that: an anchored VWAP wrapped in three rings at one, two, and three volume-weighted standard deviations, with filled zones between them. The palette runs calm to hot — teal near fair value, amber in the stretched middle, rose at the extremes — so the chart itself tells you how unusual the current price is for this anchor period. It is the fuller sibling of the single-line VWAP preset, and like every CRODL Rune preset, the source is open to read and fork.
This post covers what the rings measure, exactly how the preset computes and draws them, and the mean-reversion and trend playbooks traders run on the levels.
What VWAP Bands show
The center line is anchored VWAP — cumulative typical price (high + low + close) / 3 weighted by volume since the anchor. The rings are built from the volume-weighted standard deviation of that same typical price around VWAP, accumulated over the same anchor period. In plain terms: not just what the market paid on average, but how widely it paid around that average — with heavy-volume prints counting for more in both calculations.
That gives each ring a statistical meaning that is native to the current period and pair:
| Level | Default multiplier | Color | Typical read |
|---|---|---|---|
| VWAP | — | Orange | Anchored fair value; the benchmark |
| ±1σ | 1.0 | Teal | Normal rotation around fair value |
| ±2σ | 2.0 | Amber | Stretched; mean-reversion watchlist |
| ±3σ | 3.0 | Rose | Extreme; chasing here is paying top decile |
Because the deviation is volume-weighted and anchored, the rings start tight at each reset and breathe outward as the period accumulates business — a morning's ±2σ is a much smaller move than an evening's.
How VWAP Bands work on the Crodl terminal
Each bar the script computes v = VWAP(anchor) and sd = volume-weighted stdev(anchor) on identical anchor buckets, then plots six band lines at v ± sd × multiplier for the three levels. The Anchor parameter (default day) offers Asia (00:00 UTC), London (07:00 UTC), New York (13:30 UTC), session, day, week, month, quarter, and year. Generic session and day both reset at 00:00 UTC; each named session accumulates until the same session opens again the next day.
The Crodl-specific structure is in the controls:
- Per-level toggles. Show VWAP, Show Level 1, Show Level 2, and Show Level 3 (all on by default) let you strip the display to the rings you trade. Each toggle gates that level's lines and its fills together.
- Per-level multipliers. Level 1/2/3 default to 1.0 / 2.0 / 3.0 and each accepts 0.1–20, so a 0.5 / 1.0 / 1.5 scalping ladder or a 1 / 2.5 / 4 fat-tail ladder is a settings change away.
- Filled zones. The Near zone spans the full ±1σ ring across VWAP at 8% opacity; Mid zones fill 1σ→2σ on each side at 6%; Far zones fill 2σ→3σ at 5%. Fills draw first so the level lines sit crisply on top.
- The calm→hot palette. VWAP in brand orange, ±1σ teal, ±2σ amber, ±3σ rose — every color adjustable in the Style group.
One honest implementation note: the original indicators in this family aggregated volume across dozens of forex brokers to approximate real volume. Crodl deliberately omits that — crypto exchange volume is authoritative, so the bands are built directly on the real thing.
How traders use VWAP Bands
Mean reversion at the outer rings
The signature play: price tags ±2σ or ±3σ on decelerating volume, prints a rejection, and rotates back toward VWAP. The rings make the trade mechanical — entry at the ring, invalidation beyond the next ring out, target at VWAP or the ±1σ boundary. The further the ring, the rarer the touch and the stronger the snap-back tendency, but a 3σ tag on expanding volume is a breakout, not a fade; volume context decides.
Trend riding inside a band pair
In a trending session, price does not oscillate around VWAP — it camps in one band. A strong uptrend typically lives between +1σ and +2σ, pulling back to the +1σ line rather than to VWAP itself. Traders ride the trend while that floor holds and treat a decisive break back inside ±1σ as the character change. This is the anchored-VWAP version of the band walk you see on Bollinger Bands.
Fading the open, sizing the day
Early in each anchor period the bands are tight and moves across multiple rings are cheap; as volume accumulates, each σ gets heavier. Intraday traders use that structurally: aggressive reversion trades early while the rings are elastic, and respect for the rings later when three sigma represents a genuinely rare event for the day.
Confluence with volume structure
A ±2σ ring landing on a Volume Profile high-volume node, or a weekly-anchor VWAP crossing a daily ring, marks a level where two independent volume-based measures agree. Those confluences are where reversion trades earn their best risk-reward.
Frequently Asked Questions
How is the deviation actually computed?
It is the volume-weighted standard deviation of typical price around the VWAP, accumulated since the anchor — the same buckets, the same weighting. That is deliberately different from a close-price standard deviation like Bollinger's: a high-volume excursion widens these bands far more than a thin wick does. For the plain unweighted version as its own study, see the Standard Deviation indicator.
Why do the bands widen through the day?
Dispersion accumulates. At the anchor reset the market has paid only a narrow set of prices, so σ is small; every hour of trading adds more price-volume observations and usually more spread. The widening is the market's actual distribution being drawn in real time, not lag.
VWAP Bands or Bollinger Bands?
Different anchors, different questions. Bollinger Bands roll over the last N bars and describe recent statistical volatility anywhere on the chart. VWAP Bands anchor to a calendar period and describe how far price sits from the volume-weighted consensus of that period. Intraday and session-based traders generally get more signal from the anchored version.
Which anchor should I use for swing trading?
Week is the workhorse — the rings describe the current week's accepted range, and a ±2σ weekly tag is a meaningful swing event. Month and quarter suit position trades. Many traders run a day anchor and a week anchor side by side and trade the confluences.
Put the full distribution on your chart
VWAP Bands are one click away on every Crodl terminal chart — add the preset from the indicator picker, choose your anchor, and fair value plus its one, two, and three sigma rings are drawn live across six exchanges' worth of pairs.
This article is for educational purposes only and is not financial advice. Leveraged trading carries substantial risk of loss. Always do your own research and never risk more than you can afford to lose.

Ready to automate your trading?
Connect your exchange, set up automations, and start trading smarter — all from one platform.
Start Trading Free