
Anchored VWAP: The Average Price Paid Since the Moment That Mattered
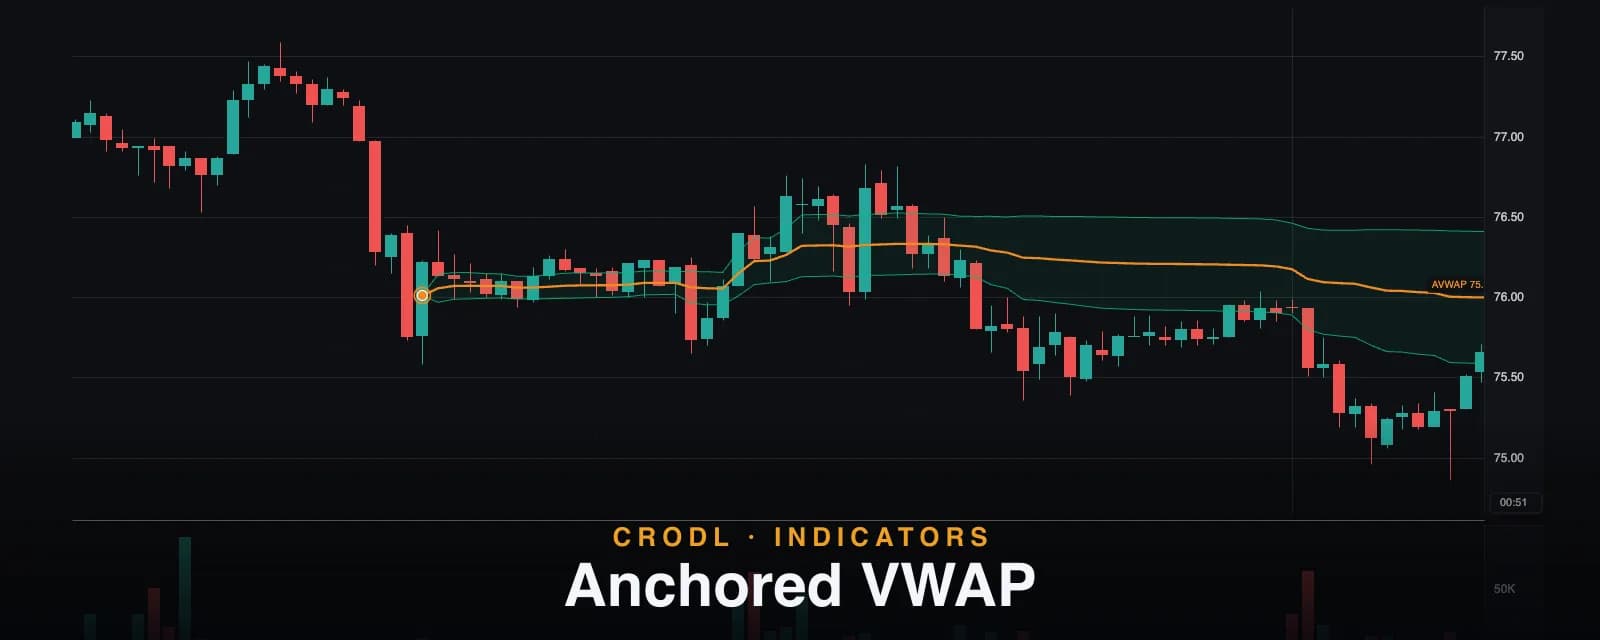
Anchored VWAP is a one-click drawing tool on the Crodl chart: click any candle to anchor a volume-weighted average price line with optional ±1σ and ±2σ bands.
The VWAP preset on the Crodl terminal resets on a schedule — every day, week or month, the average starts over. That is the right behavior for benchmarking a period. But the market's most important moments do not arrive on a schedule: a capitulation low, a breakout candle, a listing, a CPI print. The question those moments raise is specific — what has the average participant paid since that exact candle? — and a scheduled reset cannot answer it.
Anchored VWAP can, and on Crodl it is built as what it really is: a drawing tool, not a picker indicator. Open the Lines flyout on the drawing toolbar (or press Alt+W), click the candle where the story started, and a volume-weighted average price line grows from that anchor to the newest bar — and keeps extending live as new candles form.
How it works
One click is the entire workflow. From the anchor candle forward, the tool accumulates each bar's typical price — (high + low + close) / 3 — multiplied by its volume, divides by total volume, and plots the result: the average price actually paid, weighted by size, since your chosen moment. A dot marks the anchor candle, riding on the line itself, and when the drawing is selected a small pill at the line's tip reads out the current AVWAP value.
Because it is a drawing, it behaves like one everywhere else: it saves and restores with your other drawings, it can be styled, selected and deleted like a trendline, and you can drop as many separate anchors as your thesis needs — each line is its own independent drawing with its own anchor.
The σ bands
The tool can wrap the line in volume-weighted standard-deviation bands computed over the same accumulation window — not just what the market paid on average since the anchor, but how widely it paid around that average. A Bands selector in the drawing's settings popover offers three modes: line only, a ±1σ pair (the default), or ±1σ plus ±2σ. The inner ±1σ zone fills teal; the outer ±2σ ring fills amber, so stretch reads as heat.
The bands start tight at the anchor and breathe outward as volume accumulates, which gives them a meaning native to your anchor: ±2σ three days after a capitulation low is that recovery's own definition of "extended," not a generic one.
| Anchor on | The line answers |
|---|---|
| A swing low or capitulation wick | Is the average buyer since the bottom still in profit? |
| A breakout candle | Are breakout buyers being defended or abandoned? |
| A news or listing candle | What is the market's settled verdict on the event? |
| A weekly or monthly open | How is price trading versus the period's average business? |
For the last row, the Period Opens indicator marks the open levels themselves — anchoring an AVWAP at one of them turns a static level into a living average.
How traders use it
The reclaim / reject test
Price above an anchored VWAP means the average participant since the event is in profit; below means underwater. That single fact drives the classic play: after a strong impulse, pullbacks into the anchored line are tests of the move's collective cost basis. Buyers defending their average is what a healthy trend looks like; a clean loss of the line — and a failed retest of it from below — is often the earliest structural evidence that the move is being distributed.
Bands as stretch zones
With bands on, distance from the line is measured in the anchor period's own volatility units. Tags of ±2σ mark price as expensive or cheap relative to everything traded since the anchor — prime territory for taking profit on trend legs or hunting mean reversion back toward the line. If you want this band logic with scheduled anchors and a third ring, the VWAP Bands preset is the indicator-flavored sibling.
Confluence from multiple anchors
Drop one AVWAP from the macro swing low and another from the most recent breakout. Where the two lines converge, two different cohorts of buyers share a cost basis — and levels where multiple average-entry prices stack tend to be defended with real orders. This is the anchored-VWAP version of trendline confluence, with volume doing the weighting.
Settings that matter
Anchored VWAP is configured per drawing, from the settings popover that opens when you select it:
- Bands (default: one ±1σ pair) — the selector cycles line-only, ±1σ, or ±1σ + ±2σ. Values outside that range are clamped; there is deliberately no third band.
- Color, width and line style (defaults: amber, 1.8px, solid) — these style the center line. The band colors are fixed — teal for ±1σ, amber for ±2σ — so every anchored VWAP's bands read consistently.
- The anchor itself — drag the anchor handle onto a different candle to re-anchor, or drag the line's body to shift the anchor left or right bar by bar. The whole line and its bands recompute instantly.
Persistence is inherited from the drawing system: anchors survive page reloads, and because each anchor remembers its candle's timestamp, switching timeframes re-attaches the line to the same moment in time on the new bars.
An honest note on the numbers
Anchored VWAP is computed from the candles loaded on your chart, at your chart's timeframe. Each bar contributes one typical price — hlc3 — as a stand-in for its full intra-bar trade distribution, so the value on a 1h chart can differ by a hair from the same anchor on a 5m chart, where the distribution is sampled more finely. Bars with zero or missing volume contribute nothing and the line simply carries forward. And if you anchor on empty future whitespace, there is nothing to average yet — the drawing waits as a bare anchor handle until candles exist. None of this is repainting: closed bars are locked, and only the live forming bar's contribution updates tick by tick.
Frequently Asked Questions
How is this different from the VWAP indicator preset?
The preset anchors on a schedule — an Asia, London, or New York open, or a UTC calendar period — and resets automatically, which makes it a benchmark. The drawing anchors on one candle you choose and never resets, which makes it a thesis. Most traders run both: the preset for the session's fair value, anchored drawings for the events they are actually trading.
Do the bands repaint?
No. Both the VWAP and its standard deviation are cumulative from the anchor, so every closed bar's value is fixed the moment the bar closes. Only the newest, still-forming bar updates live — and that is development, not repainting.
What happens when I switch timeframes?
The anchor remembers its candle's time, so the line re-anchors to the bar containing that moment on the new timeframe and recomputes from that timeframe's candles. Expect values within a whisker of each other — the hlc3 sampling difference above — but the same line, the same story.
Can I run more than one at once?
Yes. Every click with the tool creates an independent drawing with its own anchor and its own band setting. Two or three anchors from different structural points is the standard confluence setup.
Anchor to what matters
Anchored VWAP is on every Crodl terminal chart right now — press Alt+W, click the candle that started the move you are trading, and you will know at a glance whether the market still believes in it.
This article is for educational purposes only and is not financial advice. Leveraged trading carries substantial risk of loss. Always do your own research and never risk more than you can afford to lose.

Ready to automate your trading?
Connect your exchange, set up automations, and start trading smarter — all from one platform.
Start Trading Free