
Volume Delta and CVD: Reading Who Was in Control of Every Candle
Volume Delta splits each candle's volume into buying and selling pressure; CVD keeps the running total. How the weighted model works and how to trade it.
A volume bar answers one question: how much traded. It stays silent on the question that actually matters: who was in control while it traded. A heavy candle closing on its high and a heavy candle closing on its low print identically in a plain volume pane — yet one is demand in charge and the other is demand getting sold into.
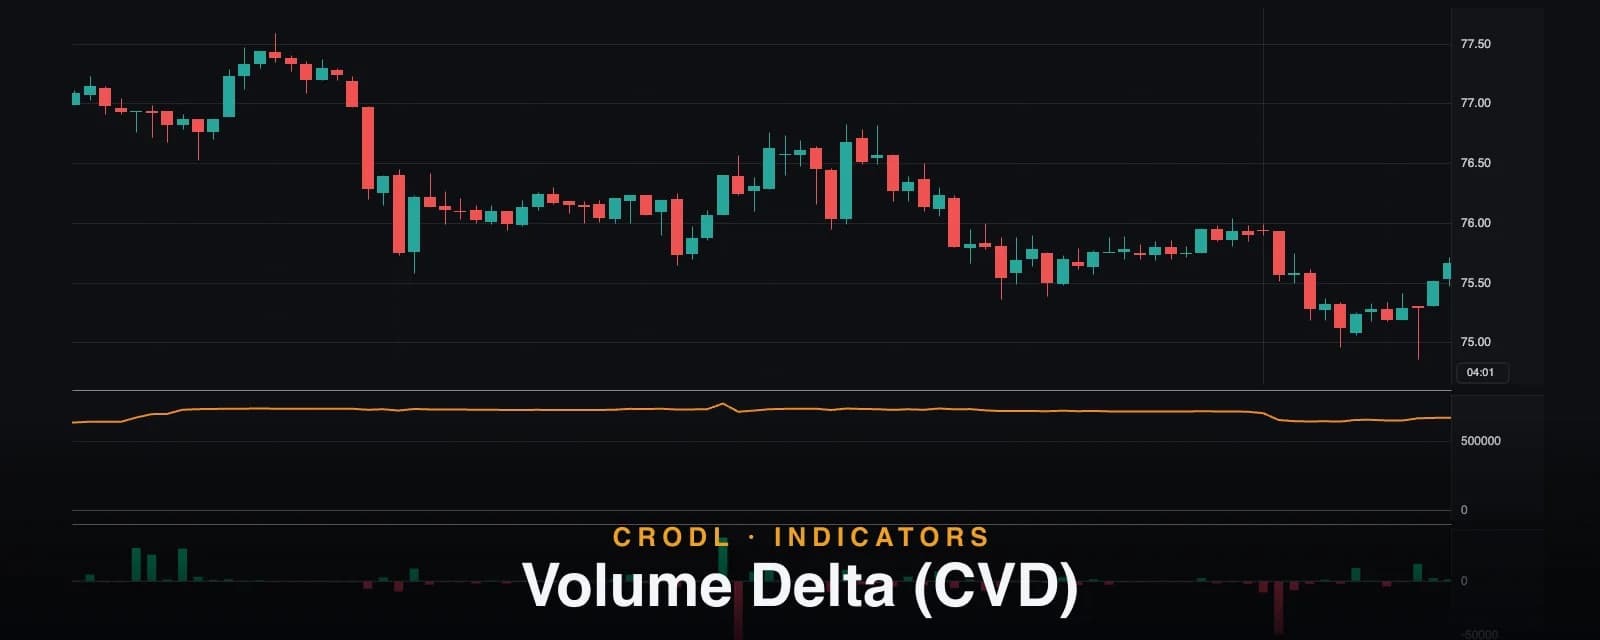
Volume Delta (CVD) on the Crodl terminal splits every candle's volume into estimated buying and selling pressure, plots the per-candle balance as a histogram, and keeps a running total — the cumulative volume delta line — so you can see whether aggression is accumulating or draining across an entire move. It is an open CRODL Rune preset, drawn in its own sub-pane below price, and like every preset the source is readable and forkable.
What it shows
Three plots share the sub-pane:
- Delta histogram — one bar per candle. Teal bars above zero mean the candle's volume leaned toward buying; rose bars below zero mean it leaned toward selling. The height is the size of the imbalance, not the total volume.
- CVD line — the amber line is the running sum of every delta since the left edge of your loaded chart. Rising CVD means net buying pressure is stacking up; falling CVD means sellers keep winning the tape even when price disagrees.
- Zero line — a dashed reference so the histogram's flips are readable at a glance.
The histogram is the microscope; the CVD line is the trend of its readings. Most actionable signals come from comparing the CVD line's shape against price's shape.
How the delta is estimated
The preset ships with two models, switched by a single toggle.
Weighted delta (the default) grades each candle by where it closed inside its own range. The close's position is mapped to a pressure score between −1 and +1 — a close at the high scores +1, a close at the low scores −1, a close dead-center scores 0 — and the candle's volume is multiplied by that score. The score is clamped so a candle's delta can never exceed its actual volume, even on degenerate data. A candle that rallied all day and closed on its high contributes nearly its full volume as buying; a candle that wicked high but closed near its low contributes most of its volume as selling, which is exactly the story the wick is telling.
Classic delta (Weighted Delta off) is the blunter, more traditional rule: the candle's full volume counts as buying when the close is above the open, selling when below, and zero on an exact doji.
Two guards keep the math honest: a bar with no range (high equals low) falls back to the classic rule instead of dividing by zero, and a bar with missing data contributes exactly zero rather than poisoning the running sum. CVD itself is simply the previous bar's CVD plus the current delta, seeded at zero on the first loaded candle.
| Price | CVD | Read |
|---|---|---|
| Higher highs | Higher highs | Healthy trend — each leg backed by fresh net buying |
| Higher highs | Flat or lower highs | Bearish divergence — price rising on thinning aggression |
| Lower lows | Higher lows | Bullish divergence — selling is being absorbed |
| Flat range | Steadily rising | Quiet accumulation inside the range |
How traders use it
Confirm or doubt the breakout
A breakout worth chasing prints its conviction in the delta pane: expanding teal histogram bars and a CVD line punching to new local highs alongside price. A breakout where price clears the level but CVD barely ticks up is a warning that the move is thin — stops and short covering, not initiative buying — and thin breakouts are the ones that round-trip.
Trade the divergence
CVD divergence is the volume-flow version of the oscillator divergences traders already hunt: price makes a higher high, CVD makes a lower high, and the rally is running on fumes. The reverse at lows — price grinding lower while CVD holds or rises — is absorption, and it precedes many sharp reversals. If you want this pattern hunted automatically on RSI, MACD and OBV, the Divergences indicator does exactly that; CVD gives you the same logic expressed in volume flow.
Watch absorption at the levels that matter
Delta is most meaningful where the market has business to do. When price sits at a high-volume node from the Volume Profile and the histogram prints heavy selling while price refuses to break, someone is absorbing that selling — a classic pre-reversal footprint. The level explains where; the delta explains what is happening there.
Settings that matter
- Weighted Delta (default on) — the setting's own hint says it plainly: "Weight by where the close sits in the bar range — off = full volume by candle sign." On for the graded model, off for classic sign-of-candle delta.
- Show Delta Histogram (default on) — toggle the per-candle bars.
- Show CVD Line (default on) — toggle the cumulative line. Either plot runs happily alone: histogram-only for scalping the per-bar flow, line-only for a clean divergence view.
- Delta Up / Delta Down / CVD — the three colors, teal, rose and amber by default.
An honest note on the model
True volume delta requires tick data — every trade tagged by whether the buyer or seller was the aggressor. This indicator does not have tick data; it estimates delta from candle shape. The weighted model's assumption is simple and stated: a close near the high means buyers won the bar in rough proportion to how near. It is a good proxy, and it agrees with tick-level delta far more often than not, but it is an approximation and single-bar readings should never be over-trusted.
There is a second honesty point unique to cumulative indicators: CVD is a running sum over the candles currently loaded on your chart. The absolute number is an artifact of where your history happens to begin — scroll left to load more bars, or switch timeframes, and the whole line re-bases. This is not a bug; it is what a cumulative sum is. Read the slope, the structure, and the divergences against price. Never the raw level.
Frequently Asked Questions
Weighted or classic — which mode should I use?
Weighted, for most purposes: it captures wick information the classic rule throws away, so a candle that spiked and got rejected reads as the selling it actually was. Switch to classic for comparability with older delta studies or the crudest possible read — full volume, one sign, no interpretation.
Why does the CVD value change when I scroll left or switch timeframes?
Because CVD accumulates from the first loaded candle, loading more history extends the sum backwards and shifts every value on the line. Different timeframes also bucket volume differently, so the weighted deltas differ bar by bar. Shape and divergences survive these shifts; the absolute number does not, and was never the signal.
Is this the same delta as a footprint chart?
No. Footprint platforms compute delta from actual tick-by-tick aggressor data. This is a candle-level estimate — instantly available on any symbol and timeframe with no special feed, but a model rather than a measurement.
How is CVD different from OBV?
OBV adds or subtracts each bar's entire volume based on whether the close rose or fell versus the previous close — every bar is all-buying or all-selling. Weighted CVD grades each bar by its internal structure, so a violent rejection candle can print net selling even inside an up-move. OBV is the coarser cousin; CVD in weighted mode is the higher-resolution read of the same idea.
See the pressure behind the print
Volume Delta (CVD) is one click away in the indicator picker on every Crodl terminal chart. Add it under your price pane, watch one session of breakouts and rejections with it running, and volume bars will never look sufficient again.
This article is for educational purposes only and is not financial advice. Leveraged trading carries substantial risk of loss. Always do your own research and never risk more than you can afford to lose.

Ready to automate your trading?
Connect your exchange, set up automations, and start trading smarter — all from one platform.
Start Trading Free