
OBV
On-Balance Volume tracks whether volume flows with or against price. How Crodl's OBV preset works, its 21-period EMA signal line, and how traders read divergences.
Price can lie. A thin order book, a single aggressive market buyer, a low-liquidity weekend — any of these can push a crypto chart somewhere it has no business staying. Volume is much harder to fake at scale: sustained moves need sustained participation, and when participation disappears, the move usually follows.
On-Balance Volume (OBV) is the oldest and simplest tool for reading that participation. Introduced by Joe Granville in 1963, it keeps one running total: add the bar's volume when price closes up, subtract it when price closes down. That is the entire formula — and sixty years later it remains one of the most effective divergence tools in trading, because it answers a question price alone cannot: is money actually flowing in the direction of this move?
The OBV preset on the Crodl terminal takes the classic line and adds the one upgrade it always needed — an EMA signal line that turns a shape you squint at into crosses you can set alerts on. Here is how it works and how traders use it.
What OBV measures
OBV treats every bar as a vote. A close above the previous close means buyers won the bar, so its entire volume is counted as buying pressure. A close below means sellers won, so the volume counts as selling pressure. An unchanged close adds nothing. Summing those signed volumes from the start of the data produces the OBV line.
Two properties follow from that design:
- The absolute number is meaningless. OBV starts counting from whatever history is loaded, so the raw value depends on your chart depth and the exchange's volume units. Only the slope and shape of the line carry information.
- The line is a conviction meter. When price rises 3% on heavy volume, OBV jumps; when it rises 3% on air, OBV barely moves. Two identical price moves produce very different OBV footprints — and that difference is the entire edge.
How it works on the Crodl terminal
Crodl's OBV preset is a Rune script with one functional input:
- Signal Length (default 21) — the length of the EMA applied to the OBV line.
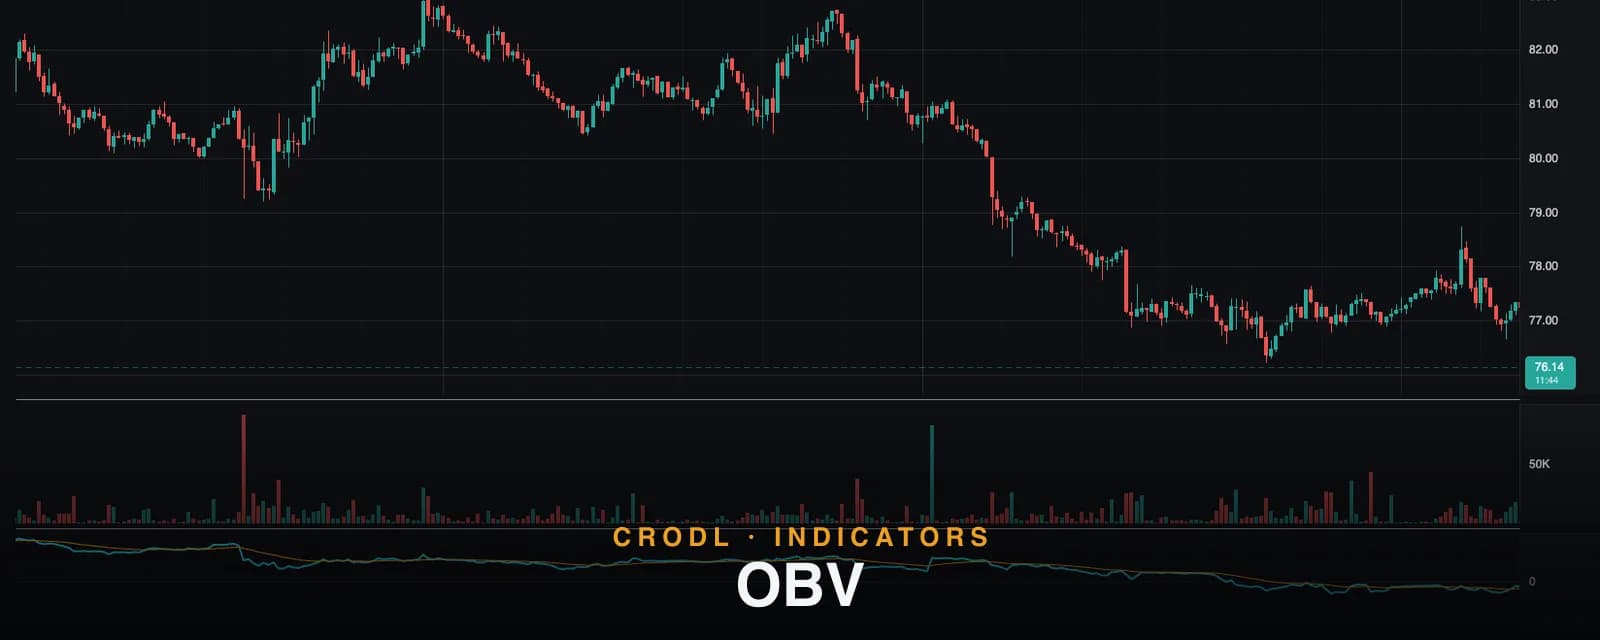
The pane shows two lines: the OBV line itself (teal, 2px, with a live last-value label) and the signal line — a 21-period EMA of OBV drawn in orange. The preset registers two alerts, OBV cross up and OBV cross down, which fire when the OBV line crosses its signal EMA in either direction.
The signal line matters more than it looks. Raw OBV is jagged — every bar moves it by the full bar's volume — so "OBV is rising" is often a judgment call. The EMA cross makes it mechanical: OBV above its 21-EMA means net volume flow is positive on the swing horizon; below means it is negative. That converts the classic eyeball indicator into something you can automate.
What volume adds over price-only oscillators
RSI, stochastics, and their relatives are all rearrangements of price — clever ones, but every input is the same candle data, so they can only ever confirm what price already shows. OBV brings a genuinely independent data series onto the chart.
That independence is what makes OBV divergences meaningful. When price makes a new high but OBV does not, the two data sources disagree: price says the trend is intact, volume says the buying that built it has left. A price-only oscillator can never produce that kind of disagreement — an RSI divergence tells you momentum is slowing, but an OBV divergence tells you participation is gone, which is closer to cause than symptom.
How traders use it in crypto
The core tool is the confirmation matrix — read price and OBV together:
| Price | OBV | Reading |
|---|---|---|
| Rising | Rising | Healthy trend — volume confirms the move |
| Rising | Flat / falling | Bearish divergence — rally lacks real buying |
| Falling | Falling | Healthy downtrend — sellers committed |
| Falling | Flat / rising | Bullish divergence — accumulation into weakness |
Divergence at swing points
The classic play: price grinds to a marginal new high, OBV prints a clearly lower high. That is distribution — size selling into strength — and it precedes many crypto tops. The mirror image at lows (price lower low, OBV higher low) marks accumulation. Our divergence guide covers how to combine OBV divergences with RSI and MACD for confluence.
Breakout confirmation — and front-running
OBV often resolves before price does. When price is compressed in a range but OBV is already breaking above its own range highs, buyers are absorbing supply inside the consolidation — the price breakout, when it comes, is far more likely to hold. Conversely, a price breakout that OBV refuses to confirm is the anatomy of a fakeout. Pair this with Volume Profile to see where that absorbed volume sits.
Signal-line crosses as a flow regime
Between divergences, the 21-EMA cross gives a slower, cleaner read: many swing traders simply refuse longs while OBV is below its signal line. It will not catch exact turns, but it keeps you aligned with net money flow — and the preset's built-in alerts mean you do not have to watch for it.
Frequently Asked Questions
Does the actual OBV value mean anything?
No. It is a running total from the start of your loaded history, so the number differs by chart depth, exchange, and symbol. Compare OBV only against its own recent highs, lows, and signal line — never across charts.
How is OBV different from Accumulation/Distribution?
OBV is all-or-nothing: the close direction assigns 100% of the bar's volume as buying or selling. The A/D line weights volume by where the bar closed within its range, so a weak close on a green bar contributes less. OBV is blunter but reacts faster; A/D captures intrabar conviction. Many traders run both and treat agreement as signal.
Why does OBV look different across exchanges?
Because volume is venue-specific. The same BTC pair on two exchanges has different volume prints, so OBV's shape shifts slightly. Divergences that appear on multiple venues are the strongest ones.
Is 21 the right signal length?
Default 21 suits swing trading on 1h–4h charts. Scalpers shorten it (9–13) for faster crosses; position traders lengthen it (30–50) to filter noise. The alerts follow whatever length you set. Either way, treat OBV as a filter and divergence detector rather than a standalone trigger — a bounded volume oscillator like the MFI adds the overbought/oversold context that the unbounded OBV line cannot.
Watch the flow, not just the price
OBV with its EMA signal line is available on every Crodl terminal chart — add it from the indicator picker, set alerts on the crosses, and see whether real volume is behind the next move, alongside live trading on six exchanges.
This article is for educational purposes only and is not financial advice. Leveraged trading carries substantial risk of loss. Always do your own research and never risk more than you can afford to lose.

Ready to automate your trading?
Connect your exchange, set up automations, and start trading smarter — all from one platform.
Start Trading Free