
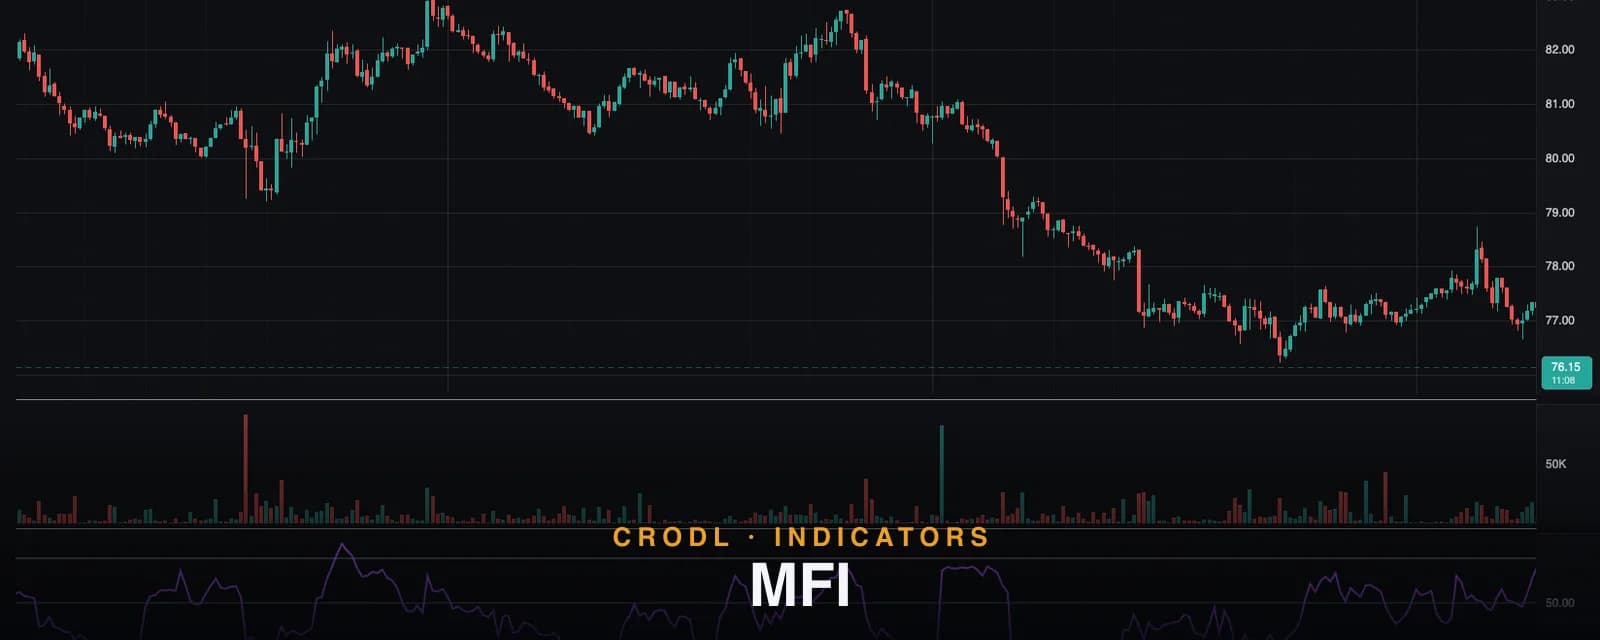
MFI
The Money Flow Index is RSI with volume built in. How Crodl's 14-period MFI preset works, its 80/20 bands, and what volume adds over price-only momentum oscillators.
Every trader knows the RSI. Far fewer know its volume-weighted sibling — which is odd, because the Money Flow Index (MFI) answers a strictly better question. RSI asks how fast has price been moving up versus down? The MFI asks how much money has been moving it? Same 0–100 scale, same overbought/oversold logic, but every bar is weighted by the volume that actually traded.
That single change matters enormously in crypto, where price routinely drifts on no participation and then moves violently when real size arrives. A 3% pump on dead volume and a 3% pump on ten times average volume look identical to the RSI. To the MFI, they are completely different events.
The MFI preset on the Crodl terminal implements the classic 14-period calculation with the standard 80/20 bands, plus alerts on both thresholds. This post covers what it measures, the exact defaults in the preset, and how traders use the volume weighting in practice.
What the Money Flow Index measures
The MFI is built in four steps:
- Typical price. Each bar is reduced to
(high + low + close) / 3— a fairer single number than the close alone. - Raw money flow. Typical price × volume. This is the dollar-ish value that changed hands on the bar.
- Positive vs negative flow. If the typical price rose from the previous bar, the bar's money flow counts as positive; if it fell, negative. Sum each side over the lookback window.
- Index. The ratio of positive to negative flow is squashed onto a 0–100 scale, exactly like RSI:
100 − 100 / (1 + positive / negative).
A reading of 80 means that over the window, buying-pressure bars carried four times the money flow of selling-pressure bars. A reading of 20 means the reverse. Zero and 100 mean the flow was entirely one-sided — which the volume weighting makes rarer and more meaningful than the equivalent RSI extremes.
How it works on the Crodl terminal
Crodl's MFI is a Rune preset with one functional input:
- Length (default 14) — the lookback window for the positive/negative flow sums.
The pane draws the MFI as a purple 2px line with a live last-value label, against three dashed reference lines: overbought at 80, midline at 50, and oversold at 20. Two alerts ship with the preset — one fires when the MFI crosses up through 80, the other when it crosses down through 20 — so you can be notified the moment flow reaches an extreme rather than watching the pane.
The preset also handles two edge cases most implementations get wrong. On a completely flat window (every bar's typical price unchanged), it returns a neutral 50 instead of a garbage value. And when there is genuinely no volume in the window — common on illiquid pairs and some replay data — it draws a gap rather than fabricating a reading. If you see a hole in the line, that is the indicator being honest about missing data.
| MFI reading | State | Typical response |
|---|---|---|
| Above 80 | Overbought — heavy one-sided buying flow | Tighten stops, watch for reversal triggers |
| 50–80 | Bullish flow | Trend-following longs favored |
| 20–50 | Bearish flow | Rallies suspect, shorts favored |
| Below 20 | Oversold — heavy one-sided selling flow | Watch for capitulation reversals |
What volume adds over a price-only RSI
This is the whole reason to use MFI, so it is worth being precise. The RSI and every other price-only oscillator are transformations of the same candle series — they can measure the speed of a move but are structurally blind to its participation. The MFI folds in an independent data source, and that buys you three things:
- Extremes that mean more. MFI 80 requires overwhelming buying flow, not just consecutive up-closes. A grind higher on fading volume can push RSI to 75 while MFI sits at 60 — the disagreement itself tells you the rally is thin.
- Sharper divergences. When price makes a new high but MFI makes a lower high, the money behind the trend is leaving even though price hasn't noticed. Because volume fades before price turns far more often than the reverse, MFI divergences tend to lead RSI divergences by several bars.
- A built-in fakeout filter. Breakouts on weak MFI are breakouts without fuel. Requiring MFI above 50 (or rising) as a condition for breakout longs removes a surprising fraction of failed breaks.
The trade-off: MFI is more volatile than RSI — volume spikes yank it around — which is exactly why the conventional bands are 80/20 rather than RSI's 70/30.
How traders use it in crypto
Fading extremes in ranges. In sideways markets, MFI touches beyond 80/20 are high-quality mean-reversion signals precisely because they require real flow, not just price drift. Wait for the cross back through the band rather than the first touch — the preset's alerts fire on the crosses for this reason.
Divergence at swing points. The highest-value signal. Price prints a marginal new high; MFI prints a clearly lower high; volume has already voted. Combine with structural tools — a divergence into a Volume Profile node or a prior swing level is far stronger than one in a vacuum.
Confluence with pure volume-flow lines. MFI compresses flow into a bounded oscillator; OBV and Chaikin Money Flow show it uncompressed. When a bounded extreme and an unbounded divergence line up, you have two independent volume reads agreeing — that is about as good as confirmation gets without order-flow data.
Frequently Asked Questions
MFI vs RSI — which should I use?
Use RSI for the cleanest momentum read and its enormous shared-attention effect (everyone watches the same levels). Use MFI when you want extremes and divergences validated by volume. Many traders run both and specifically hunt for bars where they disagree — that disagreement is information neither shows alone.
Why 80/20 instead of 70/30?
Volume weighting makes MFI swing harder than RSI, so its distribution has fatter tails. The 80/20 convention compensates: it keeps "overbought" and "oversold" as genuinely rare events. On strongly trending pairs some traders push to 90/10.
Is 14 the right length?
The default 14 is the standard from Quong and Soudack's original design and works across timeframes. Shorter (7–10) suits scalping but multiplies false extremes; longer (20+) suits position trading and makes band touches rarer and heavier.
Why does my MFI line have gaps?
The Crodl preset returns no value when the lookback window contains zero volume, rather than inventing a number. Gaps mean the market genuinely didn't trade — mostly on illiquid pairs or thin historical data.
Trade with the money flow
The MFI is available on every Crodl terminal chart — add it from the indicator picker, set alerts on the 80/20 crosses, and see whether volume actually agrees with the move you're about to trade, alongside live trading on six exchanges.
This article is for educational purposes only and is not financial advice. Leveraged trading carries substantial risk of loss. Always do your own research and never risk more than you can afford to lose.

Ready to automate your trading?
Connect your exchange, set up automations, and start trading smarter — all from one platform.
Start Trading Free