
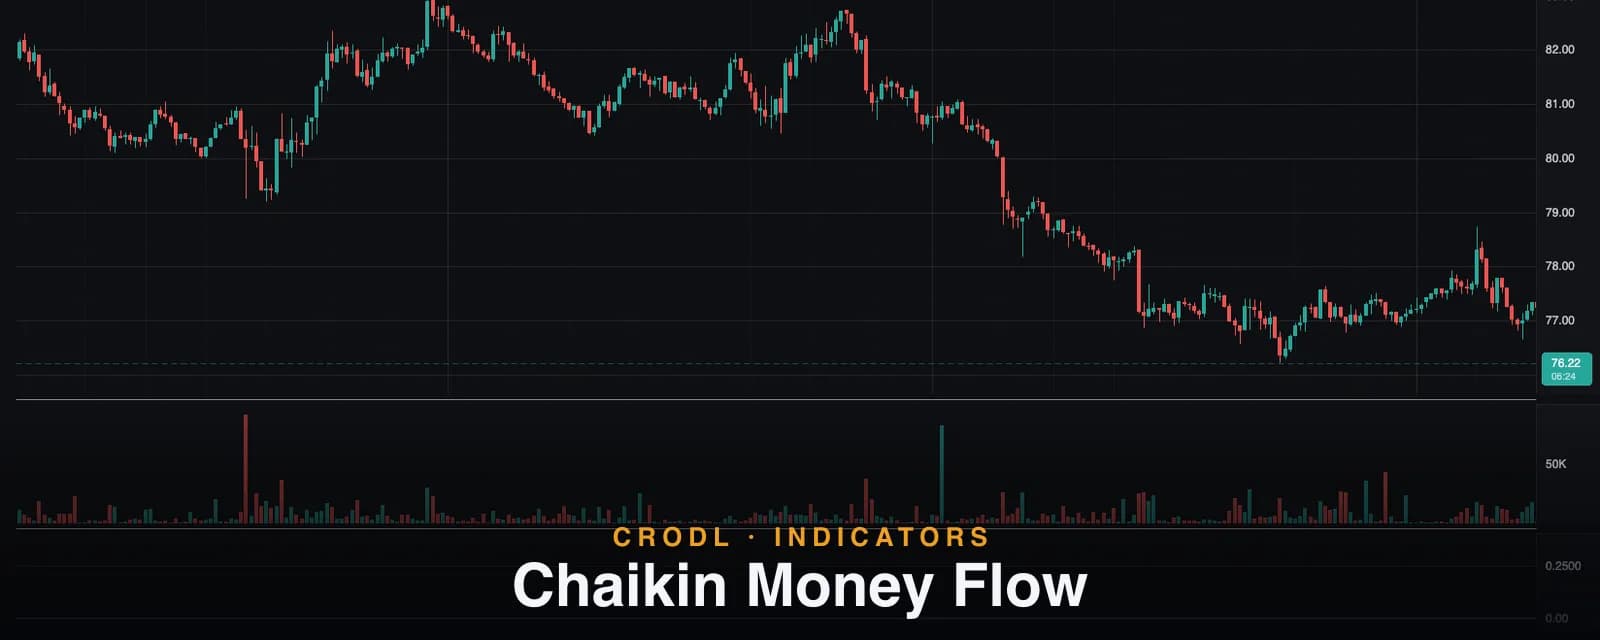
Chaikin Money Flow
Chaikin Money Flow reads where candles close within their range and weights it by volume. How Crodl's 20-period CMF works and how traders trade the zero line.
Two green candles can tell two completely different stories. One rallies all session and closes pinned at its high — buyers were in control to the last trade. The other spikes up, gets sold all the way back, and barely closes positive — that candle is green in color only. Close-to-close indicators treat them identically. Chaikin Money Flow (CMF) does not.
Marc Chaikin's insight was that where a bar closes within its own high–low range reveals who won the bar — and that weighting this by volume, then averaging over a window, produces a clean oscillator of buying versus selling pressure. The result lives between −1 and +1, oscillates around zero, and answers one question continuously: over the last N bars, has money been flowing into this market or out of it?
The Chaikin Money Flow preset on the Crodl terminal implements the classic 20-period calculation as a zero-anchored histogram. This post covers the mechanics, the exact defaults, and how traders use it to separate real accumulation from cosmetic green candles.
What CMF measures
CMF is built on the money flow multiplier — the same close-location value that powers the Accumulation/Distribution line:
multiplier = ((close − low) − (high − close)) / (high − low)
The multiplier maps each bar onto a −1 to +1 scale by close location: a close at the bar's high scores +1, a close at the low scores −1, a close dead-center scores 0. Multiply by the bar's volume to get money flow volume — a signed measure of how much volume backed the winning side.
CMF then averages: sum the money flow volume over the window and divide by total volume over the same window. The output:
- CMF above zero — over the window, volume has concentrated on bars closing strong. Net accumulation.
- CMF below zero — volume has concentrated on bars closing weak. Net distribution.
- The magnitude — how one-sided that flow is. Sustained readings beyond roughly ±0.25 are conventionally treated as strong pressure, though the thresholds are a rule of thumb rather than part of the formula.
How it works on the Crodl terminal
Crodl's CMF is a Rune preset with one functional input:
- Length (default 20) — the averaging window for both the money-flow sum and the volume sum.
The pane renders CMF as a translucent teal histogram around a dashed zero line, which is the right visual for this indicator — the zero crossings and the height of the bars are the signal, and a histogram makes both legible at a glance.
Two implementation details worth knowing. Bars with zero range (high equals low) contribute zero money flow rather than a division error. And when the lookback window contains no volume at all, the preset draws a gap instead of fabricating a value — matching TradingView's na behavior, so illiquid stretches show as honest holes rather than fake readings.
| CMF value | Reading |
|---|---|
| Above +0.25 | Strong, sustained accumulation |
| 0 to +0.25 | Mild buying pressure |
| 0 to −0.25 | Mild selling pressure |
| Below −0.25 | Strong, sustained distribution |
What volume adds over price-only oscillators
A price-only oscillator sees the close series and nothing else. CMF sees two things it cannot: intrabar conviction and participation.
Intrabar conviction is the multiplier — the difference between closing at the high and closing mid-range after a failed push. Even OBV, the classic volume indicator, misses this: OBV assigns the bar's entire volume by close-to-close direction, so a green bar that got sold from its highs still counts as 100% buying. CMF scores that bar near zero, which is what it deserves.
Participation is the volume weighting. Ten low-volume bars closing slightly strong barely move CMF; one high-volume bar closing at its extreme moves it a lot. That is exactly the asymmetry you want in crypto, where drift is constant and meaning arrives with size. A momentum oscillator can register a "trend" built entirely on air; CMF requires money to show up.
How traders use it in crypto
The zero line as a regime filter
The simplest and most robust use: treat CMF's sign as the flow regime. Longs only while CMF holds above zero, shorts only below. Zero crossings after a sustained run on the other side are regime-change events worth attention on their own — especially on 4h and daily charts, where a flip is weeks of flow reversing, not noise.
Confirming breakouts
Breakouts need fuel. A range break with CMF already positive and rising is being bought with real volume; a break with CMF flat or negative is the anatomy of a fakeout. Checking the histogram before taking a breakout long is a one-second habit that filters a disproportionate number of traps. Pair it with Volume Profile to see whether the break is moving into a low-volume pocket (fast travel) or a high-volume node (resistance).
Divergence into highs and lows
Price makes a new high; CMF makes a lower high, or worse, sits below zero. The market is printing higher prices while net money flows out — distribution into strength, the signature of smart-money exits. The inverse at lows marks accumulation. CMF divergences are slower to form than momentum divergences but tend to be more reliable, because they are built from flow rather than price velocity.
Pairing with the Chaikin Oscillator
CMF tells you the state of money flow; the Chaikin Oscillator — an EMA spread of the cumulative A/D line — tells you its momentum. CMF positive plus a fresh Chaikin Oscillator zero-cross up is flow and acceleration agreeing, one of the cleaner volume-based entry stacks available on the terminal.
Frequently Asked Questions
CMF vs OBV — what's the practical difference?
OBV is cumulative and unbounded — best for divergences and trendline analysis on the indicator itself. CMF is windowed and bounded around zero — best for regime reads and threshold signals. OBV also assigns volume all-or-nothing by close direction, while CMF weights it by close location within the bar, so CMF is the finer-grained read of conviction.
CMF vs the Chaikin Oscillator?
Same raw material (money flow volume), different lens. CMF averages it over a window and oscillates around zero as a state. The Chaikin Oscillator takes EMAs of the cumulative A/D line and measures momentum — it turns earlier but whipsaws more. State versus speed.
Are the ±0.25 thresholds official?
No — they are convention, not formula. CMF's real anchor is zero. Treat ±0.25 as "flow strong enough to lean on" and calibrate per pair: majors sustain readings that altcoins only spike to.
Why does my CMF histogram have gaps?
The Crodl preset returns no value when the 20-bar window contains zero total volume rather than inventing a reading. Gaps are honest markers of periods where the pair simply didn't trade.
See who's actually in control
Chaikin Money Flow is available on every Crodl terminal chart — add it from the indicator picker and get a continuous read on whether money is flowing in or out, alongside live trading on six exchanges.
This article is for educational purposes only and is not financial advice. Leveraged trading carries substantial risk of loss. Always do your own research and never risk more than you can afford to lose.

Ready to automate your trading?
Connect your exchange, set up automations, and start trading smarter — all from one platform.
Start Trading Free