
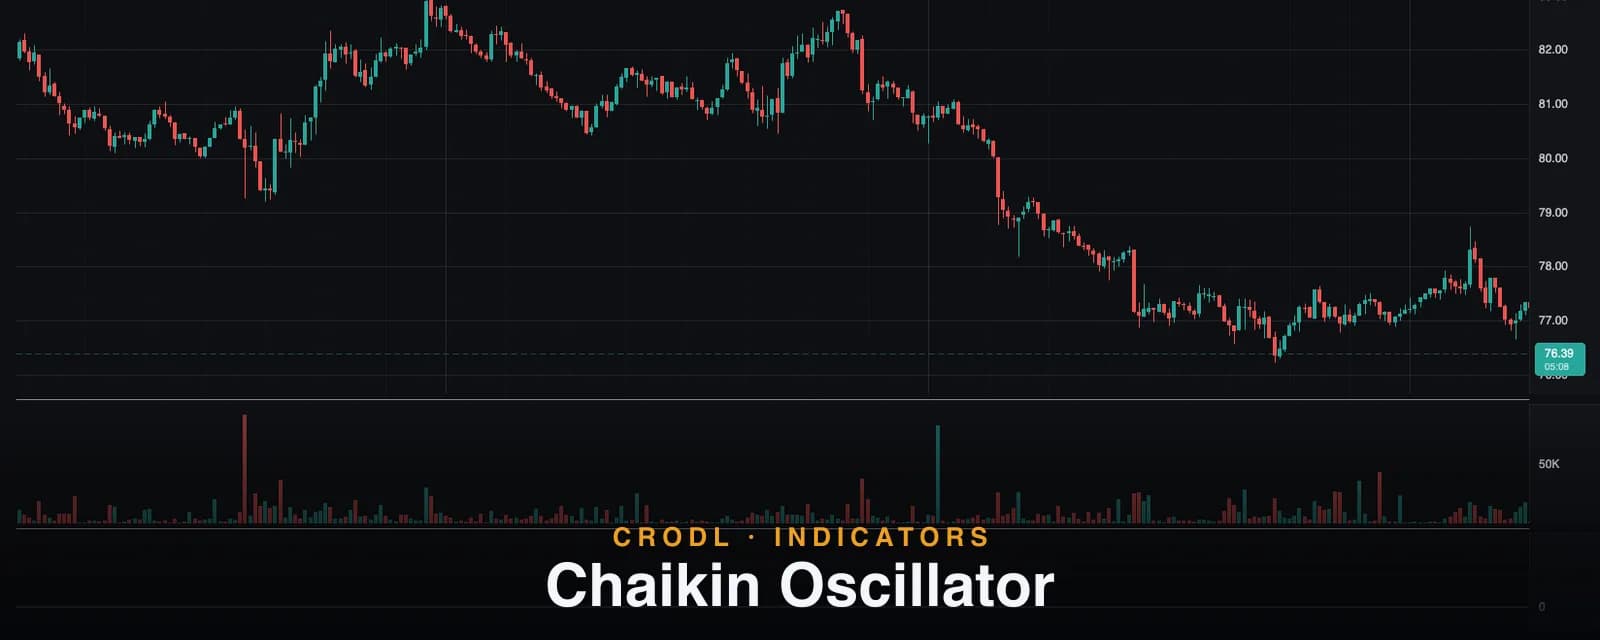
Chaikin Oscillator
The Chaikin Oscillator measures momentum of the Accumulation/Distribution line with a 3/10 EMA spread. How Crodl's preset works and how to trade its zero crosses.
The Accumulation/Distribution line is one of the best long-horizon reads of money flow on a chart — and one of the worst timing tools. It is a slow cumulative curve: by the time its direction has visibly changed, the move it warned about is often underway. Marc Chaikin's answer was to do to his own A/D line what MACD does to price: subtract a slow EMA from a fast one and watch the spread.
The result is the Chaikin Oscillator — the momentum of money flow. When it crosses above zero, volume-weighted buying pressure is accelerating; below zero, distribution is taking over. Because it is built on volume and intrabar close location rather than price, it frequently turns before price-based momentum tools do — which is exactly the property you want in crypto, where moves start fast and finish faster.
The Chaikin Oscillator preset on the Crodl terminal implements the classic 3/10 EMA spread as a zero-anchored histogram. This post covers the mechanics, the exact defaults, and the signals traders actually take from it.
What the Chaikin Oscillator measures
The calculation stacks three steps:
- Money flow volume per bar. Each bar's close location within its high–low range is scored from −1 (close at the low) to +1 (close at the high) and multiplied by the bar's volume — the same engine that powers Chaikin Money Flow.
- The A/D line. Those signed volumes accumulate into the running Accumulation/Distribution line.
- The EMA spread. A fast EMA of the A/D line minus a slow EMA of it. Positive means the line is rising faster than its recent trend; negative means money flow is rolling over.
Think of it as a derivative: the A/D line tells you whether money is flowing in; the Chaikin Oscillator tells you whether that flow is speeding up or slowing down. Flow can still be net positive while its momentum is collapsing — and that combination, invisible on the A/D line itself, is often the earliest available warning of a top.
How it works on the Crodl terminal
Crodl's Chaikin Oscillator is a Rune preset with two functional inputs:
- Fast EMA (default 3) — the short EMA of the A/D line.
- Slow EMA (default 10) — the long EMA of the A/D line.
The 3/10 pair is Chaikin's original specification and remains the default here. The pane renders the spread as a translucent orange histogram around a dashed zero line — the right visual, because the two things that matter are the sign (which side of zero) and the shape (growing or shrinking bars), and a histogram shows both at a glance. Zero-range bars contribute no money flow, so dojis cannot corrupt the line.
Because the oscillator is a difference of EMAs on a cumulative volume series, its absolute height scales with the symbol's volume — a reading of "40,000" is meaningless across charts. Read it the way you read any histogram: sign, slope, and divergence against price.
| Signal | What happened | Typical read |
|---|---|---|
| Cross above zero | Fast money flow EMA overtakes slow | Accumulation accelerating — bullish trigger |
| Cross below zero | Fast EMA drops under slow | Distribution accelerating — bearish trigger |
| Bullish divergence | Price lower low, oscillator higher low | Selling momentum exhausting into the low |
| Bearish divergence | Price higher high, oscillator lower high | Buying momentum fading into the high |
What volume adds over price-only momentum
Put the Chaikin Oscillator next to MACD and the comparison is instructive: identical architecture (fast EMA minus slow EMA), completely different input. MACD differentiates price; the Chaikin Oscillator differentiates volume-weighted money flow.
That difference is not cosmetic. Price momentum can be manufactured by thin books and low participation — a handful of market orders in a quiet session will happily print a MACD cross. Money flow momentum cannot: to move the Chaikin Oscillator, volume has to show up and bars have to close strong. When the two disagree — price momentum rising while money flow momentum falls — you are looking at a move running on fumes, and that disagreement is only visible because the oscillator carries an independent data source that no price-only tool has.
The second advantage is earliness. Distribution shows up in close location before it shows up in close direction — size sells into strength, producing weak closes on green candles long before candles turn red. The oscillator's input registers that immediately; a price oscillator has to wait for actual down-closes.
How traders use it in crypto
Zero crosses in trend direction. The bread-and-butter signal. In an uptrend, dips that push the oscillator below zero and back up are volume-confirmed pullback entries. Taking every zero cross both ways churns in chop — the standard filter is to trade crosses only in the direction of the higher-timeframe trend.
Divergence at extremes. The highest-value use. Price grinding to new highs while the oscillator prints lower highs means each push is backed by less accelerating flow — the classic pre-top signature. These setups are covered pattern-by-pattern in our divergence guide, and the volume basis makes Chaikin divergences meaningfully harder to fake than RSI ones.
Stacked with CMF. The oscillator is fast and turns often; Chaikin Money Flow is its slower sibling measuring the state of flow. Requiring CMF positive before taking bullish oscillator crosses (and vice versa) filters most of the whipsaw while keeping the early entries — state plus acceleration, from the same underlying money-flow engine.
Frequently Asked Questions
Chaikin Oscillator vs MACD?
Same construction, different input: MACD is EMAs of price, the Chaikin Oscillator is EMAs of the volume-weighted A/D line. MACD tells you price momentum; Chaikin tells you whether money flow supports it. They are complements — the disagreements between them are often the most informative signal either produces.
Chaikin Oscillator vs Chaikin Money Flow?
Both are built from the same money flow volume. CMF averages it over a window — a bounded state reading between −1 and +1. The oscillator takes EMAs of the cumulative line — an unbounded momentum reading. CMF answers "is money flowing in?", the oscillator answers "is it speeding up?"
Should I change the 3/10 defaults?
Start with them — they are Chaikin's original tuning, and the indicator's character depends on the fast EMA being very short. Lengthening toward 6/20 halves the whipsaw at the cost of the early turns that are the tool's main appeal.
Does the histogram's absolute height mean anything?
Only relative to its own recent history on the same chart. The A/D line underneath is cumulative volume, so the oscillator's scale varies by symbol, venue, and loaded history. Compare today's bars against last month's bars, never against another pair.
Catch the flow while it's turning
The Chaikin Oscillator is available on every Crodl terminal chart — add it from the indicator picker and watch money-flow momentum turn before the candles admit it, alongside live trading on six exchanges.
This article is for educational purposes only and is not financial advice. Leveraged trading carries substantial risk of loss. Always do your own research and never risk more than you can afford to lose.

Ready to automate your trading?
Connect your exchange, set up automations, and start trading smarter — all from one platform.
Start Trading Free