
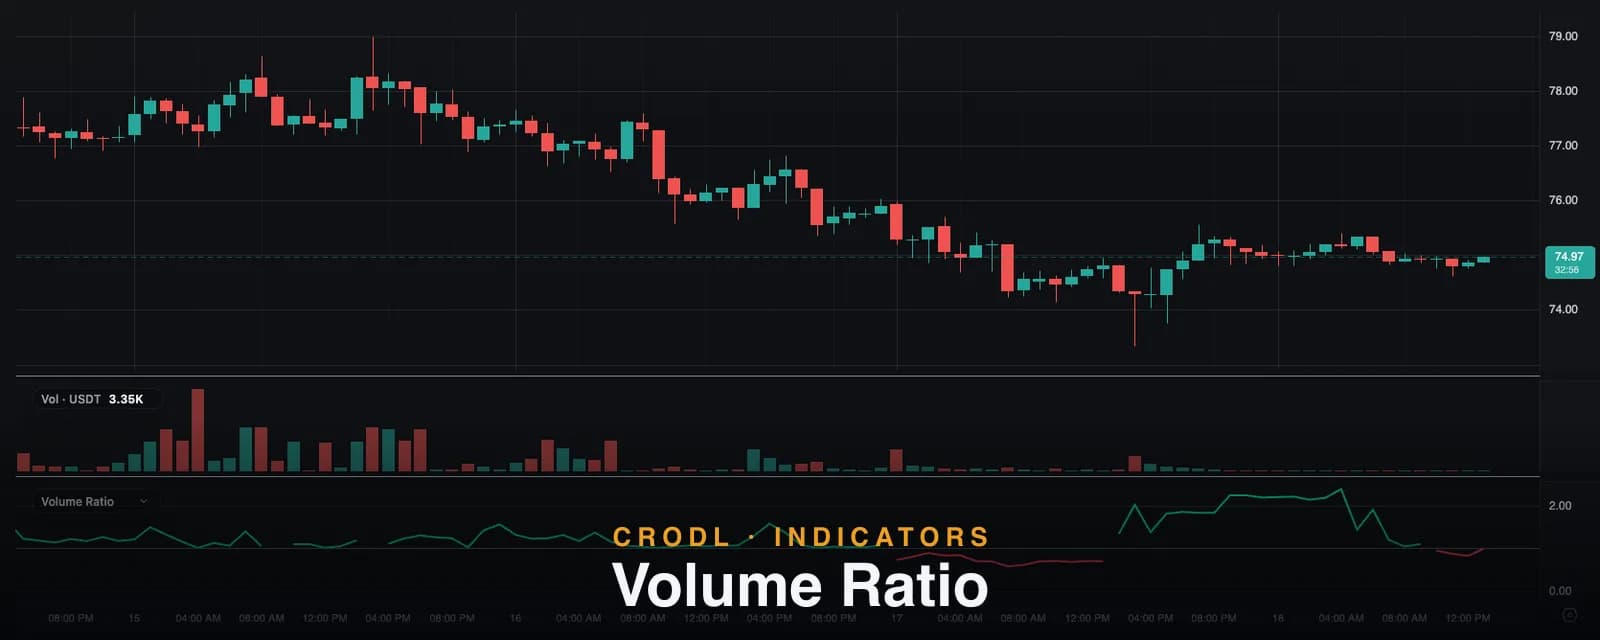
Volume Ratio: One Line for the Buy/Sell Balance
The Volume Ratio indicator divides smoothed buy volume by smoothed sell volume — above 1 buyers rule the window, below 1 sellers do. How it works and how to trade it.
Histograms are honest but noisy. Per-candle buy and sell volume tells you exactly what each bar did, but a single chop session prints fifty bars of alternating color, and the eye is bad at averaging fifty bars under pressure.
Volume Ratio on the Crodl terminal compresses the whole question into one line: smoothed buy volume divided by smoothed sell volume. Above 1.0, buyers have moved more volume than sellers over the window; below 1.0, sellers have. The line lives in its own sub-pane, flips color as it crosses the balance line, and is an open CRODL Rune preset built on the same estimation model as Volume Delta (CVD) — so everything in the volume family agrees candle for candle.
What it shows
- The ratio line — teal while at or above 1.0 (net buying over the window), rose below it (net selling). The distance from 1.0 is the imbalance's size: 1.5 means buyers moved half again as much volume as sellers; 0.67 is the same imbalance the other way.
- The balance line — a dashed horizontal at exactly 1.0. Crosses of this line are the indicator's core event: the smoothed balance of volume flipping sides.
Reading it takes one glance: which side of the line, how far from it, and which way it is bending.
How it is calculated
Each candle's volume is first split into estimated buy and sell portions using the close-position model shared across the volume family. In weighted mode (default), where the candle closes inside its range sets the buy share — at the high the whole bar counts as buying, at the low none of it, in between proportionally. Sell volume is the complement, so the two sides always sum to the bar's volume. Classic mode (Weighted Split off) uses the blunt sign-of-candle rule instead.
Then — and the order matters — each side is smoothed with its own simple moving average over the ratio's length (default 14), and only then is the division done:
ratio = SMA(buy, 14) / SMA(sell, 14)
Smoothing the components before dividing is deliberate. Dividing first and smoothing the quotient would let one anomalous bar — a near-zero-sell candle, a dead bar on a thin pair — send a single monstrous value through the average and bend the line for the next fourteen bars. Averaged components cannot do that: one strange bar is one-fourteenth of each sum. And if a whole window genuinely contains no selling, the line simply gaps rather than printing infinity.
Volume Ratio vs its siblings
| Indicator | Form | The question it answers |
|---|---|---|
| Volume Ratio | One smoothed line vs 1.0 | Which side is winning the last N bars, and by how much? |
| Volume Delta (CVD) | Per-bar histogram + running sum | Who won each bar, and is aggression accumulating? |
| Buy / Sell Volume | The raw split, one side per pane | How intense is each side, in absolute terms? |
The ratio's edge over delta is that it is relative: a delta of +500 means nothing without knowing the totals, but a ratio of 1.4 is the same statement on a quiet altcoin as on BTC — buyers moved 40% more volume than sellers. Its cost is that it normalizes away intensity, which is exactly what the raw split panes are for. They are complements, not competitors.
How traders use it
Regime at a glance
Sustained time above 1.0 with the line bending upward is a market whose volume flow supports higher prices; the mirror below 1.0 supports lower ones. Many traders use it as a filter rather than a trigger: only take longs while the ratio holds above balance, only shorts below. It pairs naturally with a structure tool like Session Levels — structure says where, the ratio says which side to prefer.
Trade the balance-line cross with context
A cross of 1.0 after a long stay on one side is the smoothed statement that control changed hands. Raw crosses in chop are noise — the line hugs 1.0 and flips constantly in a dead market — so the crosses worth acting on are the ones that arrive with a trend behind them and a level nearby. Longer smoothing lengths make crosses rarer and more meaningful.
Divergence, normalized
Price pushing to new highs while the ratio makes lower highs above 1.0 means each leg is being bought with proportionally less dominance — the same thinning-aggression read as CVD divergence, but immune to the volume inflation of a volatile session, because the ratio is scale-free. The reverse pattern at lows flags selling that is losing its majority even as price ticks down.
Settings that matter
- Smoothing Length (default 14) — the SMA window on both components. Shorter is faster and noisier; longer turns the line into a slow regime gauge. Scalpers drop toward 7; swing traders push toward 30+.
- Weighted Split (default on) — the graded close-position split described above; off is sign-of-candle classic mode. Keep it consistent with your other volume-family indicators so they tell one story.
- Above 1 / Below 1 — the two line colors, teal and rose by default.
An honest note on the model
The buy/sell split underneath this line is estimated from candle shape, not measured from tick data — the standing, stated limitation of the whole volume family on a candle feed. The ratio inherits it. It also, by design, says nothing about how much volume traded: 3 units against 2 and 3 million against 2 million both print 1.5. If intensity matters to your read — and near a big level it usually does — keep a raw volume pane or the split histograms alongside.
Frequently Asked Questions
What does a value of exactly 1.0 mean?
That over the smoothing window, estimated buying and selling volume were equal — a balanced tape. The dashed line marks it precisely so you can see leans and crosses at a glance.
Why did the line gap instead of spiking?
Two harmless reasons: the first bars of the chart have not filled the smoothing window yet, or the window's sell side summed to zero (an all-buy stretch, usually on a thin pair). The preset returns a gap rather than dividing by zero — a missing value is honest, an infinite one is not.
How is this different from CVD?
CVD is additive and cumulative — it sums signed volume forever and re-bases when you load more history. The ratio is relative and windowed — it forgets everything older than the smoothing length and never re-bases. CVD is better for long divergences; the ratio is better for "who is in control right now, on any symbol, at any scale."
Does a high ratio mean the price must go up?
No. It means buyers moved more estimated volume than sellers over the window — usually supportive, but heavy buying into a wall of resting supply can fail (that is exactly the absorption pattern described in the CVD guide). Treat the ratio as context and filter, not prophecy.
One line, whole answer
Volume Ratio is one click away in the indicator picker on every Crodl terminal chart. Drop it under price, watch a week of sessions with the balance line in view, and you will start seeing control changes before the candles make them obvious.
This article is for educational purposes only and is not financial advice. Leveraged trading carries substantial risk of loss. Always do your own research and never risk more than you can afford to lose.

Ready to automate your trading?
Connect your exchange, set up automations, and start trading smarter — all from one platform.
Start Trading Free