
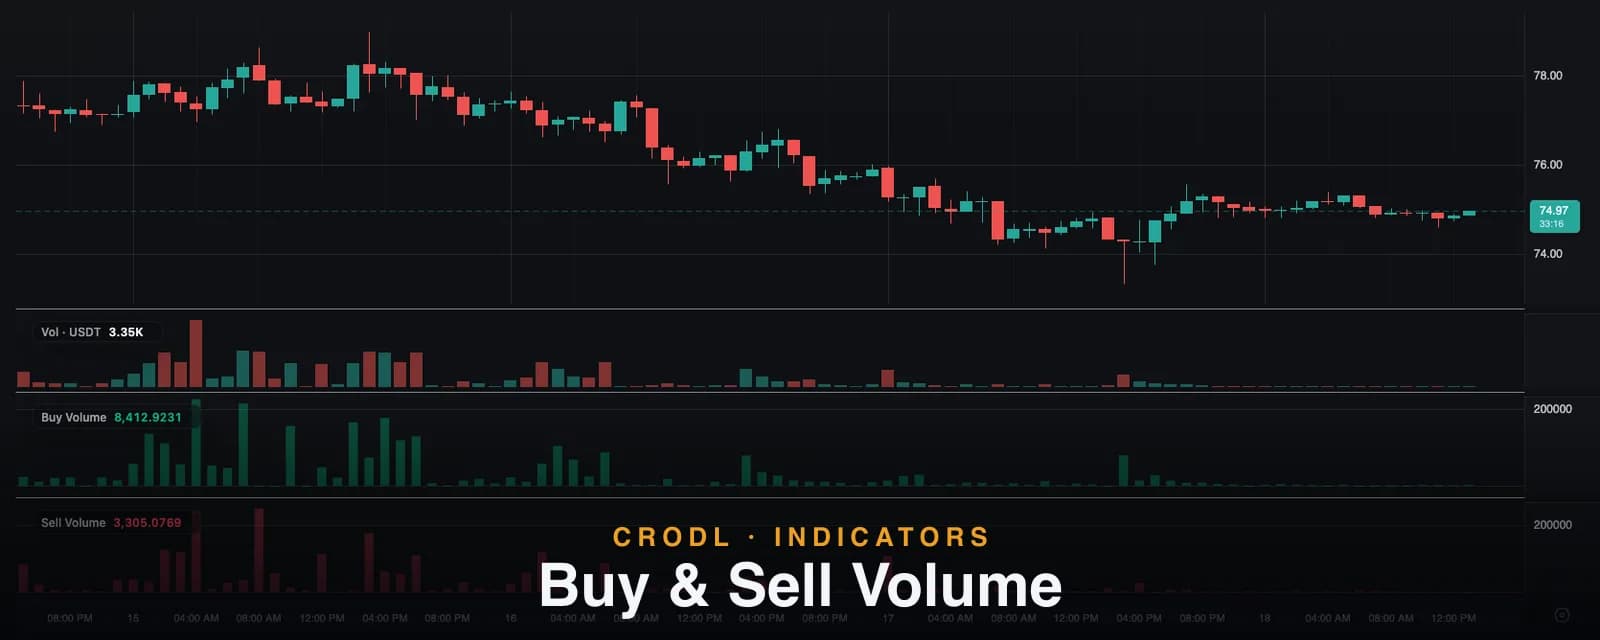
Buy Volume and Sell Volume: Splitting the Bar Into Its Two Sides
The Buy Volume and Sell Volume indicators estimate each candle's buying and selling volume from its shape. How the weighted split works and how to read each side alone.
Every volume bar on a chart is two numbers pretending to be one. Some of that volume traded because buyers lifted the offer; the rest traded because sellers hit the bid. A plain volume pane adds the two sides together and throws the distinction away — which is a pity, because the distinction is usually the interesting part.
Buy Volume and Sell Volume on the Crodl terminal are a matched pair of sub-pane histograms that split every candle's volume into its estimated buying and selling sides, so you can watch either side of the market on its own. They are open CRODL Rune presets — the source is readable and forkable — and they use the same estimation model as the Volume Delta (CVD) indicator, so all three agree with each other bar for bar.
What they show
Each indicator draws one histogram in its own pane below price:
- Buy Volume — teal bars, one per candle: the portion of that candle's volume estimated to be buying. A tall bar is heavy buying; a short bar under a big candle means the move happened on thin demand.
- Sell Volume — the rose mirror image: the estimated selling portion of each candle's volume.
- Cumulative line (optional, off by default) — an amber running total of the side you are watching, accumulated from the first loaded candle. Its slope tells you whether that side's participation is compounding or drying up.
The two presets are exact complements. The buy side is computed first, and sell volume is derived by subtraction — sell = volume − buy — so buy plus sell always reconstructs the bar's total volume exactly. Add both indicators and you are looking at the whole volume pane, split into its two sides.
How the split is estimated
The terminal works from candles, not tick data, so the split is an estimate from candle shape — the same honest approximation CVD uses, stated plainly rather than hidden.
Weighted mode (default) maps where the candle closed inside its own range to a pressure score: a close at the high scores +1 and the whole bar's volume counts as buying; a close at the low scores −1 and none of it does; a close mid-range splits the volume evenly. The buy share is (pressure + 1) / 2 of the bar's volume. A candle that rallied hard but closed back near its low correctly reads as mostly selling, because the shape says rejection.
Classic mode (Weighted Split off) is the blunt rule older studies use: an up candle's entire volume counts as buying, a down candle's as selling, and an exact doji splits half and half. Cruder, but directly comparable with legacy volume tools.
Bars with no range (high equals low) fall back to the classic rule, and dead bars count as exactly zero, so the cumulative line never jumps on bad data.
Buy Volume vs Sell Volume vs the tools next to them
| Indicator | Plots | Best for |
|---|---|---|
| Buy Volume | The buying side only | Watching demand expand or fade in isolation |
| Sell Volume | The selling side only | Spotting supply drying up into a low |
| Volume Delta (CVD) | The difference of the two, plus its running sum | The net balance and its divergences |
| Plain volume pane | The sum of the two | Total participation, no direction |
Delta already tells you who won each bar; the split pair tells you how the win happened. A delta of zero can be ten units of buying against ten of selling or a thousand against a thousand — identical delta, wildly different markets. The split makes the intensity visible.
How traders use them
Watch one side dry up
The classic bottoming read is not "buying appeared" — it is "selling ran out." Keep Sell Volume under a downtrend and watch the rose bars shrink on each successive push lower while price makes marginal new lows. Supply exhausting into a level from the Volume Profile is one of the oldest reversal footprints there is; this pane shows it directly instead of asking you to infer it from a net number.
Confirm the breakout with the side that matters
A breakout above resistance should be a Buy Volume event: expanding teal bars as the level breaks, ideally the tallest of the session. If price clears the level while Buy Volume barely ticks up, the move is running on stop-outs rather than initiative demand — the kind of breakout that round-trips. The same logic inverts for breakdowns and Sell Volume.
Read effort against result
Heavy Sell Volume that fails to move price down is absorption — someone is taking the other side of all that selling, and it usually resolves upward. Heavy Buy Volume into a level with no upward progress is the bearish mirror. Effort-versus-result is easiest to see when the effort side has its own pane instead of being netted away.
Settings that matter
- Weighted Split (default on) — the graded close-position model described above; off switches to sign-of-candle classic mode. Keep this setting identical across Buy Volume, Sell Volume and CVD if you run them together, so all three agree.
- Show Cumulative Line (default off) — the running total of the side you are watching. Like every cumulative series it re-bases when you load more history or switch timeframes: read the slope and its changes, never the absolute number.
- Colors — teal for the buy side, rose for the sell side, amber for the cumulative line, all editable.
An honest note on the model
True buy and sell volume requires trade-by-trade aggressor data, which candle charts do not carry. This pair estimates the split from where each candle closed inside its range — a good proxy that tracks tick-level numbers far more often than not, but a model, and one bar's split should never be over-trusted. The arithmetic is at least fully honest with itself: buy plus sell always equals the bar's volume, every bar, so nothing is double-counted and nothing leaks.
Frequently Asked Questions
Why not just use Volume Delta?
Delta is the difference; these are the components. A quiet market and a violent two-sided battle can print the same delta, and only the split shows the difference. The most common setup is CVD for the net read plus one of the split panes for whichever side your thesis depends on.
Do Buy Volume and Sell Volume always add up to the candle's volume?
Yes, by construction. The buy share is computed once and the sell side is that share subtracted from total volume — exact in classic mode, within a rounding whisker of exact in weighted mode. Add both histograms and you have rebuilt the plain volume pane, in color.
Why did the cumulative line change when I scrolled left?
Because it accumulates from the first candle currently loaded, extending history extends the sum backwards and shifts the whole line. That is what a running total over loaded data means; the slope and its inflections are the signal, the level is an artifact.
Which mode should I run, weighted or classic?
Weighted, unless you specifically need comparability with an older sign-of-candle study. Weighted mode reads wicks — a spike that got sold back down counts as the selling it actually was — and that is usually exactly the information you added the indicator to see.
See each side on its own
Buy Volume and Sell Volume are one click away in the indicator picker on every Crodl terminal chart — add either alone, or both for the full split. Watch one trend die and one breakout fire with them running, and the plain volume pane will feel half-blind afterwards.
This article is for educational purposes only and is not financial advice. Leveraged trading carries substantial risk of loss. Always do your own research and never risk more than you can afford to lose.

Ready to automate your trading?
Connect your exchange, set up automations, and start trading smarter — all from one platform.
Start Trading Free