
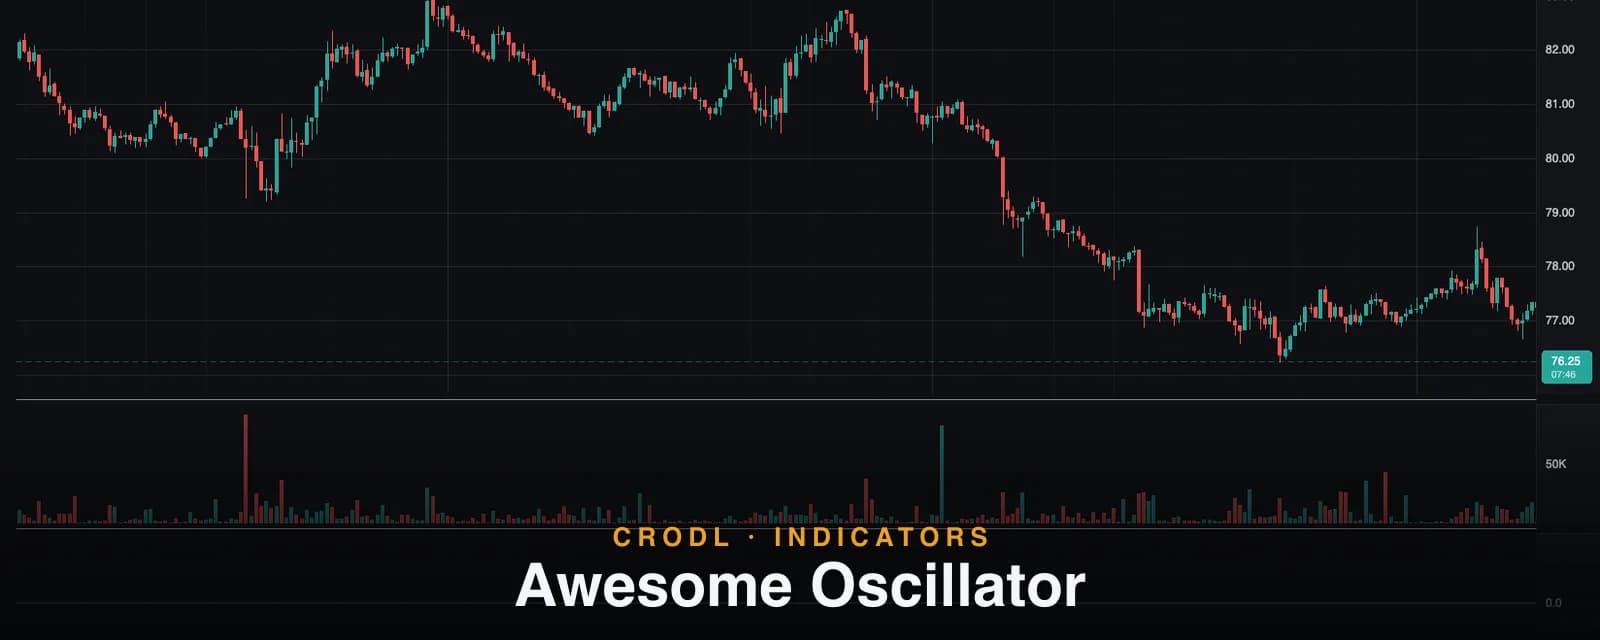
Awesome Oscillator
Bill Williams' Awesome Oscillator compares 5 and 34-period median-price averages in a bicolor histogram. How Crodl's preset works, plus the three classic signals.
Some indicators earn their place through complexity. The Awesome Oscillator (AO) earned it through the opposite: two simple moving averages, one subtraction, and a coloring rule — and out comes one of the most legible momentum reads in technical analysis. Bill Williams designed it to answer a single question: what is the market's momentum doing right now, relative to its recent past?
The construction is deliberately spartan. Take the median price of each bar — the midpoint between high and low — average it over 5 bars and over 34 bars, and plot the difference as a histogram around zero. When the fast average sits above the slow one, recent momentum is bullish; the further apart they are, the stronger it is. The bicolor histogram then adds the crucial second layer: each bar is painted by whether momentum rose or fell versus the previous bar, which is how a red bar can print above zero and a green one below it.
The Awesome Oscillator preset on the Crodl terminal is a faithful implementation of Williams' original — fixed 5/34 periods, median price, bicolor histogram. This post covers what it measures, how the preset renders it, and the three classic signals traders have run on it for decades.
What the Awesome Oscillator measures
The formula in full:
median price = (high + low) / 2
AO = SMA(median price, 5) − SMA(median price, 34)
Two design choices carry the logic. First, median price instead of the close: Williams wanted the bar's center of gravity, not its final print, so a long wick or a last-second close-jam distorts the reading less than it would a close-based oscillator. Second, the 5/34 pair: the 34-period average stands in for the market's baseline trend, the 5-period for its immediate impulse. AO is simply the gap between impulse and baseline — positive when the short-term is outrunning the trend upward, negative downward.
The histogram's color is a separate signal from its sign. Sign (above or below zero) tells you which side of the baseline momentum is on. Color tells you its direction bar to bar — green when this bar's AO is at or above the previous bar's, red when it dropped. A shrinking green stack above zero and a growing red stack above zero are very different messages at the same value.
How it works on the Crodl terminal
Crodl ships the Awesome Oscillator as a Rune preset that is deliberately parameter-free on the math — the 5 and 34 periods are fixed, as Williams specified. The two settings are visual:
- Up Color (default teal-green) — bars where AO is at or above its previous value.
- Down Color (default red) — bars where AO fell.
The pane renders two interleaved histograms from a zero baseline — up-bars in one series, down-bars in the other — with a dashed zero line. Momentum acceleration and deceleration read directly off the color changes, no squinting at slopes required.
One reading habit to build early: because AO is an absolute difference of prices, its height scales with the symbol's price. AO of 500 on BTC and AO of 0.004 on a small-cap are the same kind of reading. Compare the histogram only against its own recent swings on the same chart.
How traders use it in crypto
Williams defined three signals on AO, and all three translate directly to crypto:
| Signal | Setup | Trigger |
|---|---|---|
| Zero-line cross | Momentum flips sides of the baseline | AO crosses above zero (bullish) or below (bearish) |
| Twin peaks | Two same-side peaks, second one shallower | Bullish: two sub-zero troughs, second higher, then a green bar. Bearish mirror above zero |
| Saucer | Trend pause and resume, all on one side of zero | Above zero: red, red, green — a two-bar dip that turns back up |
Zero-line crosses
The bluntest signal: the 5-period impulse overtakes the 34-period baseline. In a trending market these crosses are solid regime confirmations; in chop they whipsaw, so most traders require higher-timeframe alignment before acting on one.
Twin peaks
The AO-native divergence. Below zero, the market sells off (first trough), bounces, then sells off again — but the second AO trough is shallower, and both stay below zero. Bearish pressure failed to match its own prior extreme; the first green bar after the second trough is the trigger. It is the same exhaustion logic as a classic price/oscillator divergence, packaged as a mechanical pattern.
Saucers
The trend-continuation entry. With AO above zero, a brief deceleration — two consecutive red bars — followed by a green bar signals the pullback within the uptrend has ended. Saucers keep you entering with the baseline trend on the earliest sign of resuming momentum, which suits crypto's pullback-heavy trends well.
Add a volume check
AO is computed purely from price — median price at that — so it knows nothing about participation. The standard upgrade is confirming its signals against a volume-flow read: a bullish twin peaks where OBV is also diverging upward, or a saucer with Chaikin Money Flow holding positive, is a far stronger trade than the AO pattern alone. Momentum says when; volume says whether anyone means it.
Frequently Asked Questions
Why are the 5/34 periods fixed?
Because the signals are defined on them. Twin peaks and saucers are calibrated to the rhythm the 5/34 pair produces; retuning the lengths quietly changes what the patterns mean. Crodl's preset keeps the math fixed and leaves the colors configurable — if you want adjustable-length momentum, MACD is the tool built for that.
What's the difference between AO and MACD?
Both are fast-minus-slow average spreads, but AO uses simple averages of median price (5/34) while MACD uses exponential averages of the close (12/26) plus a signal line. AO is deliberately smoother and pattern-oriented (twin peaks, saucers); MACD is cross-oriented. They frequently agree; AO's median-price basis makes it slightly less twitchy around volatile closes.
Can a red bar appear above zero?
Yes, constantly — and it matters. Sign and color are independent: above zero means momentum is bullish versus the 34-bar baseline; a red bar means it weakened versus the previous bar. A stack of shrinking green-then-red bars above zero is an uptrend losing steam — often the first visible crack, well before a zero cross. A zero-centered sentiment tool like Fear & Greed (SMI) pairs naturally with this read.
Does the Awesome Oscillator repaint?
No. Both SMAs use completed bar data, so once a candle closes its AO bar is final. Only the currently forming candle's bar moves with live price, like any real-time indicator.
Read momentum at a glance
The Awesome Oscillator is available on every Crodl terminal chart — add it from the indicator picker and get Williams' zero crosses, twin peaks, and saucers on any pair, alongside live trading on six exchanges.
This article is for educational purposes only and is not financial advice. Leveraged trading carries substantial risk of loss. Always do your own research and never risk more than you can afford to lose.

Ready to automate your trading?
Connect your exchange, set up automations, and start trading smarter — all from one platform.
Start Trading Free